. 2025 Aug;254(8):916-934.
doi: 10.1002/dvdy.715. Epub 2024 May 11.

Development of node architecture and emergence of molecular organizer characteristics in the pig embryo

Affiliations

Development of node architecture and emergence of molecular organizer characteristics in the pig embryo

Braah Harmoush et al. Dev Dyn. 2025 Aug.

Abstract

Background: The avian node is the equivalent of the amphibian Spemann's organizer, as indicated by its ability to induce a secondary axis, cellular contribution, and gene expression, whereas the node of the mouse, which displays limited inductive capacities, was suggested to be a part of spatially distributed signaling. Furthermore, the structural identity of the mouse node is subject of controversy, while little is known about equivalent structures in other mammals.

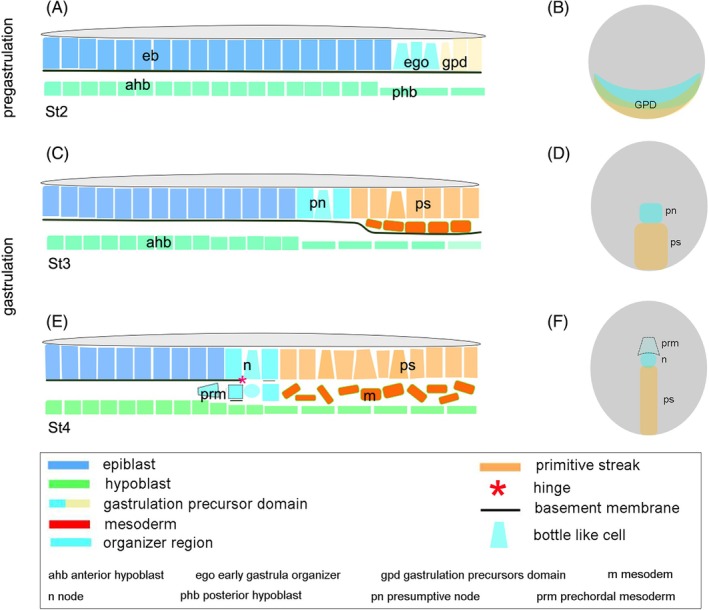
Results: We analyzed the node and emerging organizer in the pig using morphology and the expression of selected organizer genes prior to and during gastrulation. The node was defined according to the "four-quarter model" based on comparative consideration. The node of the pig displays a multilayered, dense structure that includes columnar epithelium, bottle-like cells in the dorsal part, and mesenchymal cells ventrally. Expression of goosecoid (gsc), chordin, and brachyury, together with morphology, reveal the consecutive emergence of three distinct domains: the gastrulation precursor domain, the presumptive node, and the mature node. Additionally, gsc displays a ventral expression domain prior to epiblast epithelialization.

Conclusion: Our study defines the morphological and molecular context of the emerging organizer equivalent in the pig and suggests a sequential development of its function.

Keywords: gastrulation; gene expression; goosecoid; morphogenesis; primitive streak.


Conflict of interest statement

The authors declare that the research was conducted in the absence of any commercial or financial relationships that could be construed as potential conflicts of interest.

Figures

FIGURE 1
FIGURE 1
Morphology of the gastrulation precursor domain (GPD) at pregastrulation Stage 2+ of the pig embryo. Whole‐mount views (A, C, and E) of three 10 dpc OsO4‐fixed embryos, using brightfield (A) or darkfield (C and E) illumination, and sagittal semithin sections (B, D, and F) from the embryos shown in (A), (C), and (E), respectively. Bars in overviews (A, C, and E) indicate the plane and orientation of the sagittal sections (B, D, and F), respectively. Asterisks label the periphery of the embryonic border and mark the embryonic/extraembryonic areas determined by epiblast and mural trophoblast after the complete loss of polar trophoblast. Black dots delineate the border of the anterior hypoblast. White and black brackets in the dorsal views and in the sagittal sections respectively delineate the length of the GPD. Arrowheads at high magnification of some GPD cells in (B′; D′, F′ and F″) marked the bottle‐like cells. Arrow in F″ marks the intact basement membrane. Source: Figure 1E (without inscription) is reprinted from Hassoun et al., with permission from Elsevier. AHB, anterior hypoblast; EB, epiblast; GPD, gastrulation precursors domain; MTB, mural trophoblast; PHB, posterior hypoblast. Scale bar: (A, C and E) 100 μm, (B, D, and F) 30 μm, (B′, D′, F′ and F″) 10 μm.
FIGURE 2
FIGURE 2
Brachyury expression in the gastrulation precursor domain, the primitive streak, the presumptive node, and the node. Pregastrulation Stages 2− and 2+ after whole‐mount in situ hybridization as seen in overviews (A–C) using bright field illumination, and in 5‐μm Technovit® sagittal sections (A′, B′, and G) and the higher magnification (A″, B″, D′, and D″) and inset in B′ show expression of brachyury in the gastrulation precursor domain (GPD). Gastrulation Stages 3 and 4− after whole‐mount in situ hybridization as seen in overviews (C and F) using bright field illumination (E) and dark field illumination (F), and in 5‐μm Technovit® sagittal sections (G) of specimen (F) show brachyury expression in the presumptive node (E) and in the node and primitive streak (G, G′, and G″). The position and orientation of sections are indicated by bars in (A–C and F) Asterisks, dots, and arrow heads as in Figure 1. Horizontal and vertical brackets in the sagittal sections (B′ and D′), respectively, delineate the length of the GPD at Stages 2− and 2+. AHB, anterior hypoblast; EB, epiblast; H, hypoblast; N, node; PCM, prechordal mesoderm; PHB, posterior hypoblast; PS, primitive streak; VPN, ventral part of the node. Scale bar: (A–C, E, and F) 200 μm, (A′, B′, and D) 30 μm, (D′ and G) 65 μm, and (A″, B″, D″, G′, and G″) 10 μm.
FIGURE 3
FIGURE 3
Goosecoid expression in the anterior hypoblast, polar trophoblast, and anterior two‐third of gastrulation precursor domain (GPD). Pregastrulation Stages 0, 1−, 1+, and 2− after whole‐mount in situ hybridization as seen in overviews (A and B–E) using bright field (C–E) and dark field (A and B) illumination, and in 5‐μm Technovit® sagittal sections (A′–E′) of the same specimens, respectively. Labeling by asterisks and dots is as in Figure 1. (A′–E′) show the higher magnification of gsc expression in the anterior ICM, the anterior hypoblast and in the two‐third of the GPD. Oblique bracket in the sagittal section (E′) delineates the GPD. Arrowheads in E′ mark the bottle‐like cells. AHB, anterior hypoblast; c, cavity in the epiblast; d, discontinuity in the polar trophoblast; EB, epiblast; Ex‐AHB, extraembryonic anterior hypoblast; GPD, gastrulation precursor domain; H, hypoblast; MTB, mural trophoblast; PTB, polar trophoblast; PEB, posterior epiblast;. Scale bar: (A and E) 100 μm and (A′–E′) 30 μm.
FIGURE 4
FIGURE 4
Chordin expression in the anterior epiblast, in the anterior third of the gastrulation precursor domain (GPD), in the presumptive node, and in the node. Pregastrulation Stages 2− and 2+ after whole‐mount in situ hybridization as seen in overviews (A and B) using bright field illumination, and in 5‐μm Technovit® sagittal sections (A′ and B′) of the same specimens, respectively. Gastrulation Stages 3−, 3+, and 4+ after whole‐mount in situ hybridization as seen in overviews (C–E) using bright field illumination, and in 5‐μm Technovit® sagittal sections (C′, D′, F–H) of the same specimens, respectively. (G′) shows higher magnification of the node in (G). Asterisks, dots are as in Figure 1. Hatched lines in (A and B) mark an artificial fold in the specimen. Horizontal bracket in the sagittal section (B′) delineates the GPD at Stage 2+. Horizontal brackets in C′ and D′ as in Figure 5. Arrow in G′ marks the basement membrane. Blue dot in (G′) indicates the hinge of notochordal cells. AEB, anterior epiblast; AHB, anterior hypoblast; EB, epiblast; GPD, gastrulation precursor domain; H, hypoblast; M, mesoderm; MTB, mural trophoblast; N, node; PCM, prechordal mesoderm; PS, primitive streak; RPTB, remnants of polar trophoblast; VPN, ventral part of the node. Scale bar: (A–E) 100 μm, (A′–D′ and G′) 30 μm, (G) 60 μm, and (F and H) 130 μm.
FIGURE 5
FIGURE 5
Morphology of the presumptive node area at Stage 3 of pig embryo. Whole‐mount views (A and E) of two 10.0 dpc Oso4‐fixed embryos using darkfield illumination. (B–D) transversal and (F) sagittal semithin sections from the embryos shown in (A and E), respectively. Asterisks are as in Figure 1. Planes and orientations of sections are indicated with black bars in (A and E). Numbered white bars in (A) and black bars in (F) and (F′) delineate the thickness of epiblast in three areas: (1) anterior epiblast, (2) the presumptive node area, and (3) primitive streak. The three areas are shown in higher magnification in (B′–D′), respectively and the presumptive node area is also shown in (F′). Arrowhead in (C′) marks a bottle‐like cell. Source: Figure 5E (without inscription) is reprinted from Hassoun et al., with permission from Elsevier. AEB, anterior epiblast; AHB, anterior hypoblast; M, mesoderm; PN, presumptive node; PS, primitive streak. Scale bar: (A and E) 100 μm, (B–D) 130 μm; (F) 60 μm; and (B′–D′ and F′) 30 μm.
FIGURE 6
FIGURE 6
Goosecoid expression in the presumptive node, the node, and axial mesoderm. Gastrulation Stages 3−, 4−, 4+, and 5− after whole‐mount in situ hybridization as seen in overviews (A–C and G) using bright field illumination (A, B, and G) and dark field illumination (C), and in 5‐μm Technovit® sagittal sections (A′, B′, D–F, and G′) of the same specimens, respectively. Asterisks and dots are as in Figure 1. (A″, B″, E′, and G″) show the higher magnification of gsc expression in the presumptive node, the mature node and the late node respectively. Arrowhead in A′ marks the bottle‐like cells and in E′ the arrowheads mark the borders of the node. Torquise dots indicate the hinge of notochordal cells. AEB, anterior epiblast; AHB, anterior hypoblast; c, cavity in the epiblast; EB, epiblast; ECM, extracellular matrix; Ex‐AHB, extraembryonic anterior hypoblast; H, hypoblast; MTB, mural trophoblast; N, node; NC, notochord; PCM, prechordal mesoderm; PS, primitive streak; PTB, polar trophoblast; SCM, subchordal mesoderm; VPN, ventral part of the node. Scale bar: (A–C and G) 100 μm, (A″, B″, E′, and G″) 30 μm, (A′, B′, D, F, and G′) 130 μm, and (E) 90 μm.
FIGURE 7
FIGURE 7
Morphogenesis of the node at Stages 4 and 5 of the pig embryo. (A–C and L) whole‐mount views of three 11 days pc (A–C) and one 12 dpc (L) Oso4‐fixed embryos. (D, E, and M) sagittal sections taken at the midline of the node area from the embryos in (A, B, and L), respectively. (F and G) Transversal sections taken at the anterior tip (F) and through the centre of node (G) from the embryo shown in (C). (D′–G′ and M′) show higher magnification of the node in (D–G and M), respectively. (H–K) neighboring electron microscopical 70 nm sections from the embryo shown in (E), and the higher magnification of the node in (E′). Planes and orientations of sections are indicated with short bars in (A–C and L). Asterisks are as in Figure 1. Turquoise dots indicate the hinge area of involuting/ingressing notochordal cells. Arrowheads point to the borders of the node. Arrows in (G′) refers to a microcavity. (H) shows the interruption of the basement membrane and marking the hinge at the electron microscopical level. (I and J) show the ultrastructure of the extracellular matrix in a microcavity (I) and near the basement membrane (J). (K) Anterior hypoblast cells underlying the prechordal mesoderm cells. ECM, extracellular matrix; ES, ectoderm surface; H, hypoblast; M, mesoderm; MC, microcavity; N, node; NC, notochord; PCM, prechordal mesoderm; PS, primitive streak; RPT, remnants of polar trophoblast; SCM, subchordal mesoderm; VPN, ventral part of the node. Scale bar: (A–C and L) 100 μm, (D–G and M) 130 μm; (D′–G′ and M′) 30 μm, and (H–K) 3 μm.
FIGURE 8
FIGURE 8
3D reconstruction of the early node at Stage 4− of the pig embryo. Scanning electron micrograph (A) and dorsal view (B) of 11 dpc embryo and a methylene blue stained sagittal semithin section inset and (D) a higher magnification of the node area. (E–G) sagittal semithin 1 μm histological sections taken lateral (E and G) and at the midline (F) the node and oriented by bars in B. (C) Schematic drawing illustrating the definition of the early node borders (the four quarter model). (H) and (I) show 3D reconstruction of the basement membrane and extracellular matrix material in the area of, and laterally to, the node. (J) 3D reconstruction of the dorsal and ventral sides of the node with extracellular matrix and the basement membrane lying laterally and through the node. (K and L) 3D reconstructions of the layers surrounding and covering the node vertically and horizontally. Color coding: epiblast (blue), basement membrane (red), mesoderm (purple), prechordal mesoderm (light purple), node (yellow), ventral part of the node (dark yellow), anterior hypoblast (light green), posterior hypoblast (dark green), extracellular matrix (orange) and the hinge (turquoise). AHB, anterior hypoblast; ECM, extracellular matrix; M, mesoderm; MC, microcavity; N, node; PCM, prechordal mesoderm; PHB, posterior hypoblast; PS, primitive streak; VPN, ventral part of the node. Scale bar: (A, B, and E–G) 100 μm and (D) 30 μm.
FIGURE 9
FIGURE 9
Schematic diagram showing the morphological development of the node and notochord in correlation with the organizer during pregastrulation (A and B) and gastrulation (C–F) stages. GPD, gastrulation precursor domain.
FIGURE 10
FIGURE 10
Organizer gene expression patterns during morphogenesis of the node at comparative stages of pig (2+, 3, and 4), mouse (preS, ES, and EB) and human embryos (Vc, VI, and VII). ES, early streak; EB, early bud.

References

    1. Vetrova AA, Lebedeva TS, Saidova AA, Kupaeva DM, Kraus YA, Kremnyov SV. From apolar gastrula to polarized larva: embryonic development of a marine hydroid, Dynamena pumila . Dev Dyn. 2022;251(5):795‐825. doi: 10.1002/dvdy.439 - DOI - PubMed
    1. Kuroda H, Wessely O, Robertis EMD. Neural induction in xenopus: requirement for ectodermal and endomesodermal signals via chordin, noggin, β‐catenin, and cerberus. PLoS Biol. 2004;2(5):e92. doi: 10.1371/journal.pbio.0020092 - DOI - PMC - PubMed
    1. Kraus Y, Aman A, Technau U, Genikhovich G. Pre‐bilaterian origin of the blastoporal axial organizer. Nat Commun. 2016;7(1):11694. doi: 10.1038/ncomms11694 - DOI - PMC - PubMed
    1. Selleck MAJ, Stern CD. Fate mapping and cell lineage analysis of Hensen's node in the chick embryo. Development. 1991;112(2):615‐626. doi: 10.1242/dev.112.2.615 - DOI - PubMed
    1. Weliky M, Minsuk S, Keller R, Oster G. Notochord morphogenesis in Xenopus laevis: simulation of cell behavior underlying tissue convergence and extension. Development. 1991;113(4):1231‐1244. doi: 10.1242/dev.113.4.1231 - DOI - PubMed

MeSH terms

LinkOut - more resources