. 2024 May 21;5(5):101564.
doi: 10.1016/j.xcrm.2024.101564. Epub 2024 May 10.

Monocyte bioenergetics: An immunometabolic perspective in metabolic dysfunction-associated steatohepatitis

Affiliations

Monocyte bioenergetics: An immunometabolic perspective in metabolic dysfunction-associated steatohepatitis

Moris Sangineto et al. Cell Rep Med. .

Abstract

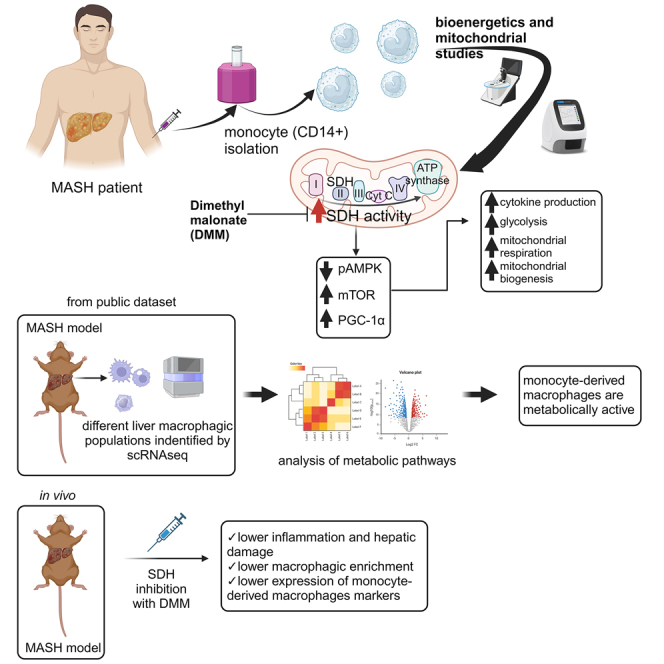
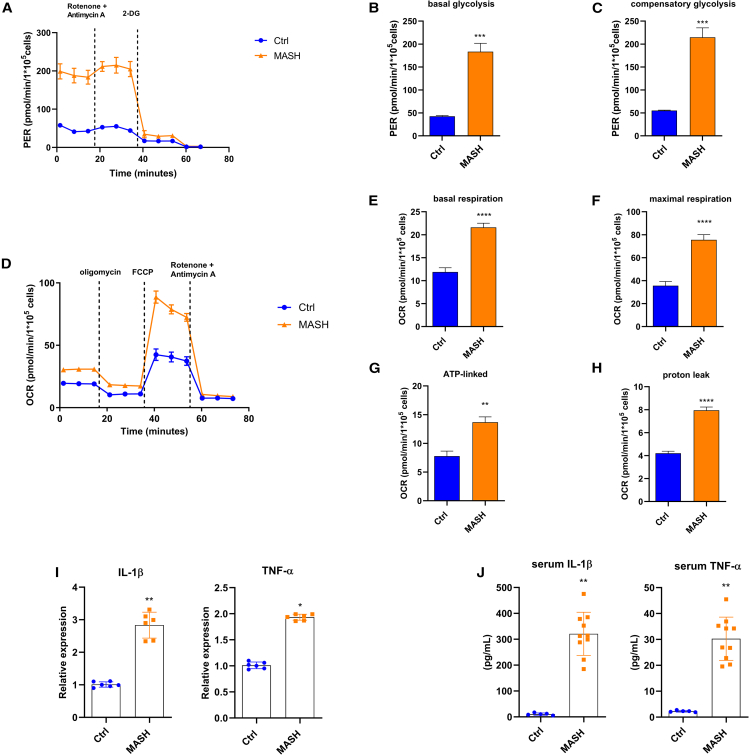
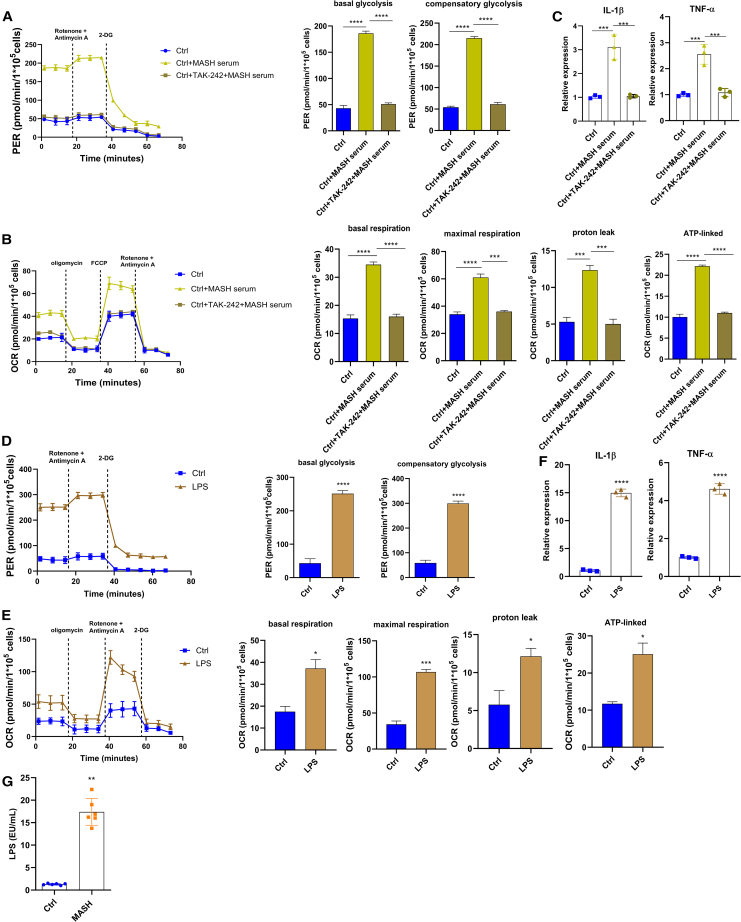
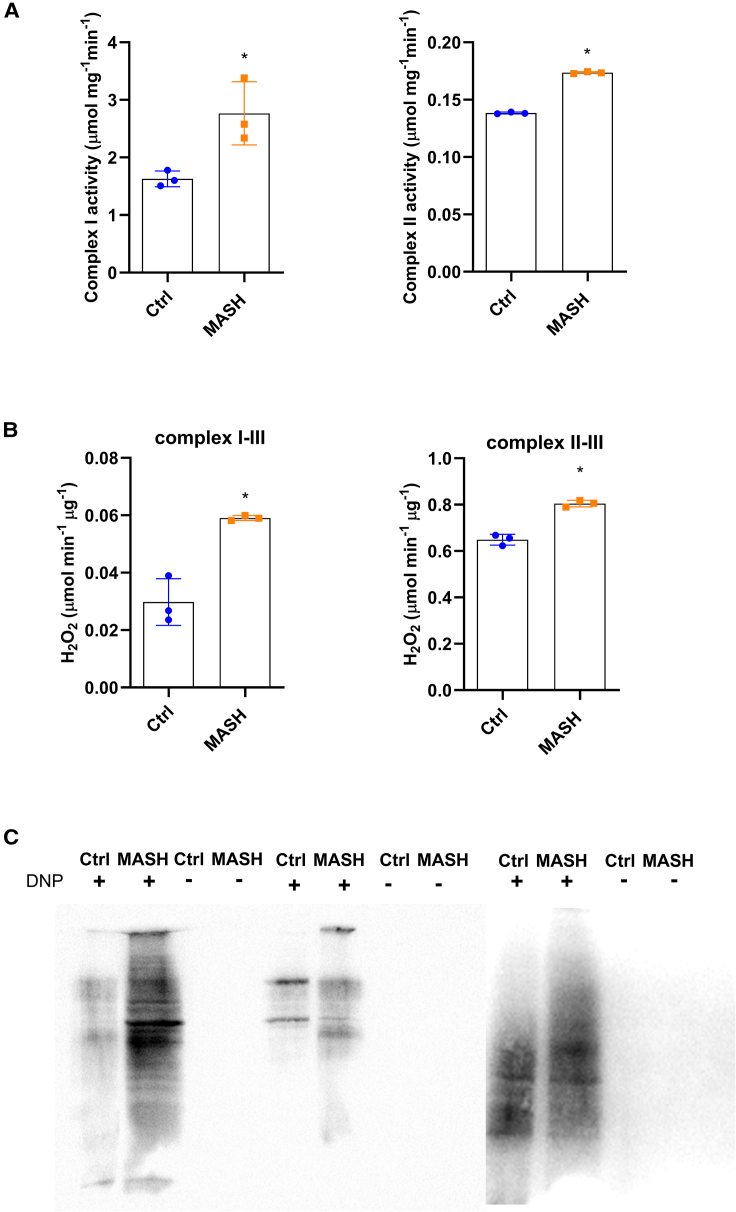
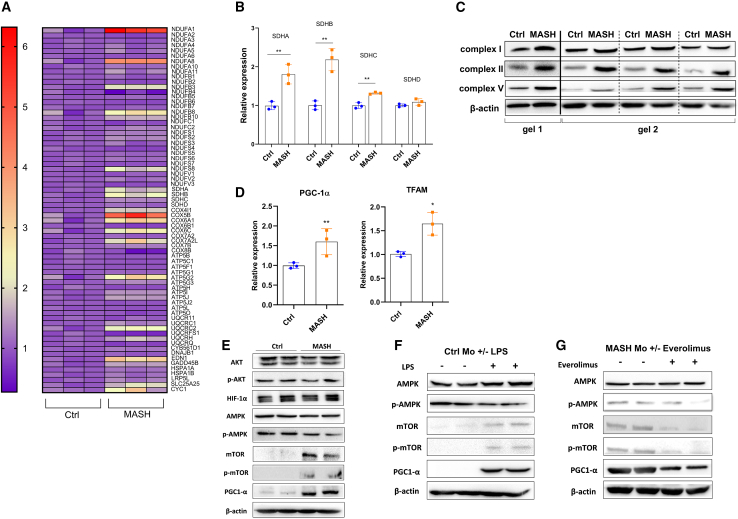
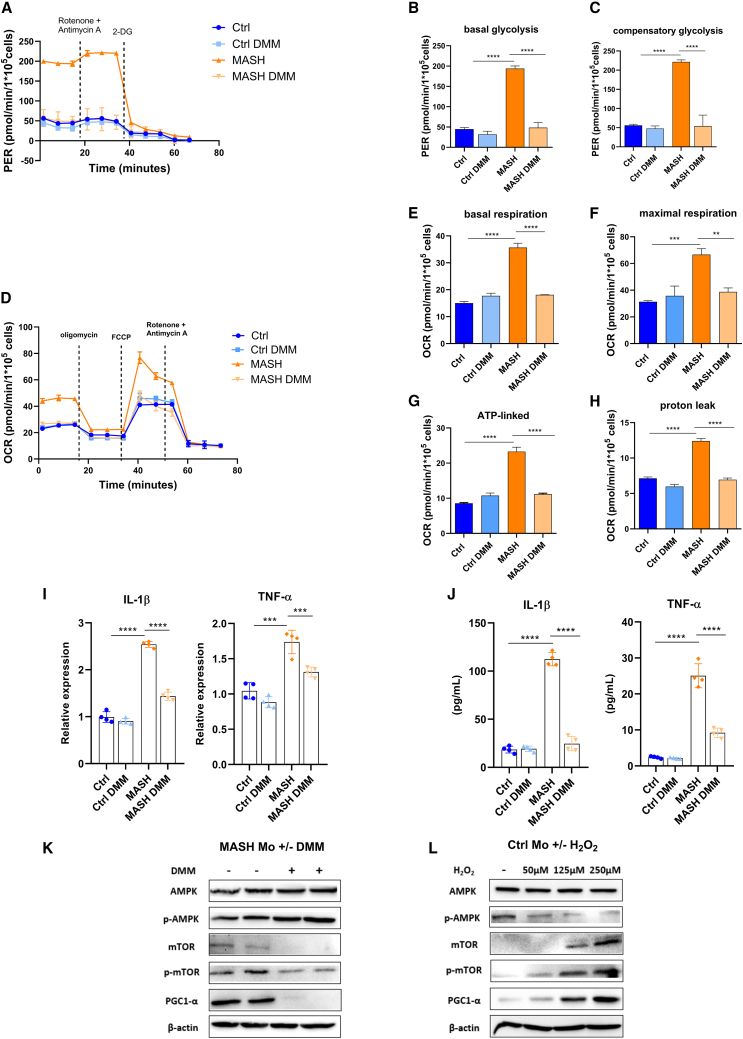
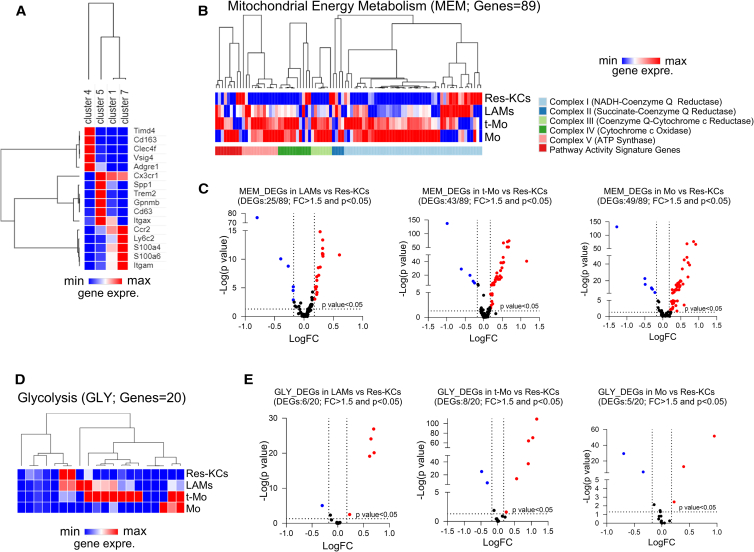
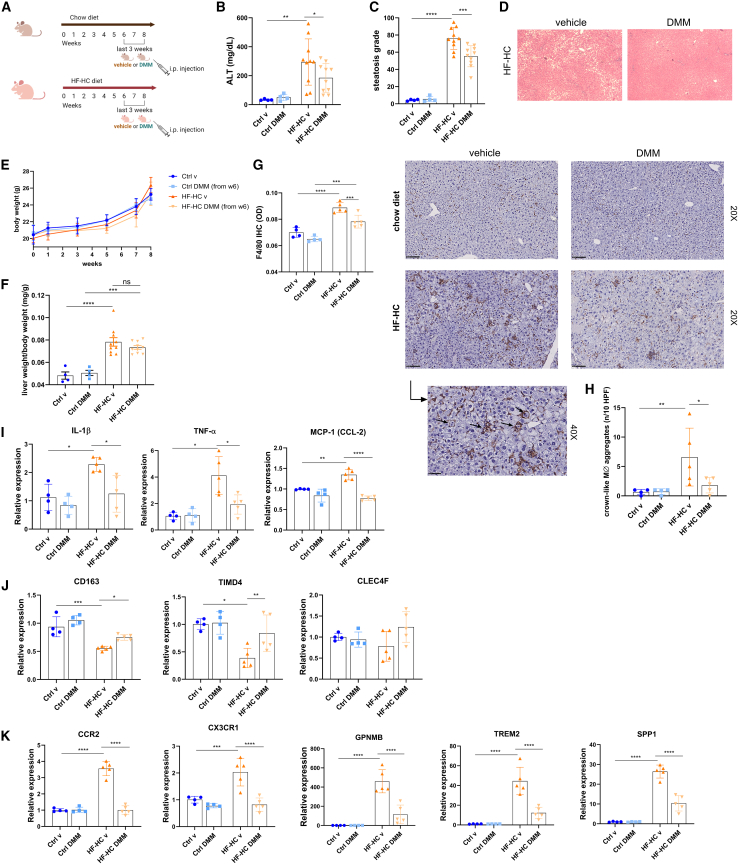
Monocytes (Mos) are crucial in the evolution of metabolic dysfunction-associated steatotic liver disease (MASLD) to metabolic dysfunction-associated steatohepatitis (MASH), and immunometabolism studies have recently suggested targeting leukocyte bioenergetics in inflammatory diseases. Here, we reveal a peculiar bioenergetic phenotype in circulating Mos of patients with MASH, characterized by high levels of glycolysis and mitochondrial (mt) respiration. The enhancement of mt respiratory chain activity, especially complex II (succinate dehydrogenase [SDH]), is unbalanced toward the production of reactive oxygen species (ROS) and is sustained at the transcriptional level with the involvement of the AMPK-mTOR-PGC-1α axis. The modulation of mt activity with dimethyl malonate (DMM), an SDH inhibitor, restores the metabolic profile and almost abrogates cytokine production. Analysis of a public single-cell RNA sequencing (scRNA-seq) dataset confirms that in murine models of MASH, liver Mo-derived macrophages exhibit an upregulation of mt and glycolytic energy pathways. Accordingly, the DMM injection in MASH mice contrasts Mo infiltration and macrophagic enrichment, suggesting immunometabolism as a potential target in MASH.

Keywords: MASH; MASLD; NASH; dimethyl malonate; immunometabolism; macrophage; mitochondria; monocyte; obesity; steatosis.


Conflict of interest statement

Declaration of interests The authors declare no competing interests.

Figures

None
Graphical abstract
Figure 1
Figure 1
MASH Mos show metabolic reprogramming (A–H) Glycolysis determined by measuring PER (A–C) and mitochondrial respiration determined by measuring OCR (D–H) in healthy control (Ctrl) and MASH Mos (n = Ctrl: 5, MASH: 8; each subject analyzed in duplicate). (I) Relative mRNA expression of pro-inflammatory cytokines (Il-1β and Tnf-α) in Ctrl and MASH Mos (n = 6 per group) determined by qPCR. (J) IL-1β and TNF-α protein levels in serum of Ctrls and patients with MASH determined by ELISA (n = Ctrl: 5, MASH: 10). Data are expressed in mean ± SEM; ∗p < 0.05, ∗∗p < 0.01, ∗∗∗p < 0.001, and ∗∗∗∗p < 0.0001 according to two-tailed Student’s t test. Mo, monocyte; PER, proton efflux rate; OCR, oxygen consumption rate.
Figure 2
Figure 2
Metabolic reprogramming in Mos is induced by TLR4 (A–C) Glycolysis determined by measuring PER (A), mitochondrial respiration determined by measuring OCR (B), and relative expression of Il-1β and Tnf-α determined by qPCR (C) in Mos of Ctrls untreated or stimulated with 10% MASH serum for 4 h ± pre-treatment with the TLR4 inhibitor TAK-242 (1 μM) for 1 h (3 experiments performed in duplicate). (D–F) Glycolysis determined by measuring PER (D), (E) mitochondrial respiration determined by measuring OCR (E), and relative expression of Il-1β and Tnf-α determined by qPCR (F) in Mos of Ctrls untreated or stimulated with LPS (50 ng/mL) for 4 h (3 experiments performed in duplicate). (G) Quantification of endotoxin (LPS) concentration in serum of Ctrls and patients with MASH determined by using the Pierce Chromogenic Endotoxin Quant Kit (Thermo Fisher Scientific) (n = 6 per group). Data are expressed in mean ± SEM; ∗p < 0.05, ∗∗p < 0.01, ∗∗∗p < 0.001, and ∗∗∗∗p < 0.0001 according to two-tailed Student’s t test or one-Way ANOVA followed by post hoc analysis (Bonferroni test). LPS, lipopolysaccharide; Mo, monocyte; PER, proton efflux rate; OCR, oxygen consumption rate.
Figure 3
Figure 3
Mitochondrial dysfunction in MASH Mos (A) Respiratory chain complex I and II enzymatic activity determined spectrophotometrically in Ctrl and MASH Mos (n = 3 per group). (B) Peroxide production from pyruvate/malate (complex I–III activity) and succinate (complex II–III activity) in Ctrl and MASH Mos (n = 3 per group). (C) Pictures of mitochondrial oxidized proteins detected with Oxyblot (Millipore Bioscience Research Reagents) in Ctrl and MASH Mos (n = 3 per group). Data are expressed in mean ± SEM; ∗p < 0.05 according to two-tailed Student’s t test. Mo, monocyte.
Figure 4
Figure 4
Mitochondrial activity is sustained at the transcriptional level in MASH Mo (A) Heatmap plot of Mo differential expressed genes involved in mitochondrial energy metabolism from the comparison between Ctrl and MASH patients (n= 3 per group); high expression is indicated in red and low expression is indicated in violet. (B) Relative mRNA expression of Sdh subunits in Ctrl and MASH Mo (n= 3 per group). A and B determined by qPCR using PrimePCR™ array “Mitochondria Energy Metabolism Plus” (Bio-Rad Laboratories Inc). (C) Pictures of protein levels of respiratory chain complexes I, II and V and β-actin as loading control, in Ctrl and MASH Mo determined by Western blot analysis (n= 4 per group; 1 MASH patient vs 1 ctrl performed on gel 1; 3 MASH patients vs 3 ctrls performed on gel 2). (D) Relative mRNA expression of Pgc-1α and Tfam in Ctrl and MASH Mo determined by qPCR (n= 3 per group). (E) Pictures of protein levels of AKT, p-AKT, HIF-1α, AMPK, p-AMPK, mTOR, p-mTOR, PGC-1α, and β-actin as loading control, in Ctrl and MASH patients Mo, determined by Western blot analysis (n=2 per group). (F) Pictures of protein levels of AMPK, p-AMPK, mTOR, p-mTOR, PGC-1α, and β-actin as loading control, in Ctrl Mo untreated or treated with LPS (50 ng/mL) for 4 h, determined by Western blot analysis (n= 2 per group). (G) Pictures of protein levels of AMPK, p-AMPK, mTOR, p-mTOR, PGC-1α, and β-actin as loading control, in MASH Mo untreated or treated with mTOR inhibitor, everolimus (10 nM) for 4 h, determined by Western blot analysis (n= 2 per group). Data are expressed in mean ± SEM; p<0.05, according to two-tails student’s t-test. SDH, Succinate dehydrogenase; AKT, Protein kinase B; p-AKT, phosphor-protein kinase B; HIF-1α, Hypoxia-inducible factor 1-α; PGC-1α, Peroxisome proliferator-activated receptor-gamma coactivator-1α; TFAM, Transcription Factor A, Mitochondrial; AMPK, AMP-activated protein kinase; p-AMPK, phospho-AMP-activated protein kinase; mTOR, mechanistic target of rapamycin kinase; phospho-mTOR, mechanistic target of rapamycin kinase; LPS, lipopolysaccharide; Mo, Monocytes.
Figure 5
Figure 5
SDH inhibition effect on MASH Mo bioenergetic and cytokine production (A–H) Glycolysis determined by measuring PER (A–C) and mitochondrial respiration determined by measuring OCR (D–H) in Ctrl and MASH Mos ± DMM (10 mM) for 4 h (experiments performed by 3 Ctrls and 3 patients, each subject studied in duplicate). (I) Relative mRNA expression of pro-inflammatory cytokines (IL-1β and TNF-α) in Ctrl and MASH Mos ± DMM (10 mM) for 4 h (n = 4 experiments performed in duplicate) determined by qPCR. (J) IL-1β and TNF-α protein levels in Mo supernatants of Ctrls and MASH patients ± DMM (10 mM) for 4 h determined by ELISA (n = 4 per group). (K) Pictures of protein levels of AMPK, p-AMPK, mTOR, p-mTOR, and PGC-1α and β-actin as loading control in MASH Mos untreated or treated with DMM (10 mM) for 4 h (n = 2 per group). (L) Pictures of protein levels of AMPK, p-AMPK, mTOR, p-mTOR, and PGC-1α and β-actin as loading control in Ctrl Mos untreated or treated with increasing concentrations of H2O2 (50, 125, and 250 μM) for 4 h. Data are expressed in mean ± SEM; ∗p < 0.05, ∗∗p < 0.01, ∗∗∗p < 0.001, and ∗∗∗∗p < 0.0001 according to one-way ANOVA followed by post hoc analysis (Bonferroni test). DMM, dimethyl malonate; IL-1β, interleukin-1β; TNF-α, tumor necrosis factor-α; Mo, monocyte; AMPK, AMP-activated protein kinase; p-AMPK, phospho-AMP-activated protein kinase; mTOR, mechanistic target of rapamycin kinase; phospho-mTOR, mechanistic target of rapamycin kinase; PGC-1α, peroxisome proliferator-activated receptor-gamma coactivator-1α; PER, proton efflux rate; OCR, oxygen consumption rate..
Figure 6
Figure 6
Analysis of scRNA-seq dataset GSE156057 (A) Hierarchical clustering and heatmap of indicated markers in clusters 4, 5, 1, and 7 obtained by clustering analysis of scRNA-seq dataset from mice fed a Western diet for 24 weeks. (B) Hierarchical clustering and heatmap analyses of 89 genes included in MEM pathway. (C) Volcano plot representing MEM DEGs in LAMs vs. Res-KCs, t-Mos vs. Res-KCs, and Mos vs. Res-KCs with a p < 0.05 and a fold change (FC) > 1.5. (D) Hierarchical clustering and heatmap analyses of 20 genes included in GLY pathway. (E) Volcano plot representing GLY DEGs in LAMs vs. Res-KCs, t-Mos vs. Res-KCs, and Mos vs. Res-KCs with a p < 0.05 and a FC > 1.5. scRNA-seq data for liver CD45+ cells in a mouse fed a Western diet for 24 weeks were used from the GEO database (GEO: GSE156057). Differences were detected with Wilcoxon rank-sum test by using ASAPv7 (Swiss Institute of Bioinformatics). MEM, mitochondrial energy metabolism; GLY, glycolysis; DEGs, differentially expressed genes; LAMs, lipid associated macrophages; Mo, monocyte; t-Mo, transitioning-monocyte; Res-KCs, resident Kupffer cells.
Figure 7
Figure 7
DMM reduces hepatic inflammation in a preclinical model of MASH (A) Experimental design (drawn with BioRender.com). (B) Serum ALT levels (Ctrl groups: n = 4; HF-HC groups: n = 10). (C and D) Histological determination of hepatic steatosis with representative pictures of H&E staining (Ctrl groups: n = 4; HF-HC groups: n = 10). (E) Body weight of mice (Ctrl groups: n = 4; HF-HC groups: n = 10). (F) Liver weight/body weight ratio of mice (Ctrl groups: n = 4; HF-HC groups: n = 10). (G) Representative pictures and quantification of F4/80 staining in the liver of control and HF-HC mice determined by immunohistochemistry (Ctrl groups: n = 4; HF-HC groups: n = 5). (H) High-magnification representative picture and quantification of crown-like macrophagic infiltrates determined by F4/80 staining on mice liver (Ctrl groups: n = 4; HF-HC groups: n = 5). (I) Relative mRNA expression of pro-inflammatory cytokines (Il-1β and Tnf-α) and MCP-1 (Ccl-2) in the liver of control and HF-HC mice determined by qPCR (Ctrl groups: n = 4; HF-HC groups: n = 5). (J) Relative mRNA expression of KC markers (Cd163, Timd4, and Clec4f) in the liver of control and HF-HC mice determined by qPCR (Ctrl groups: n = 4; HF-HC groups: n = 5). (K) Relative mRNA expression of Mo-MØ markers (Ccr2, Cx3cr1, Gpnmb, Trem2, and Spp1) in the liver of control and HF-HC mice determined by qPCR (Ctrl groups: n = 4; HF-HC groups: n = 5). Data are expressed in mean ± SEM; ∗p < 0.05, ∗∗p < 0.01, ∗∗∗p < 0.001, and ∗∗∗∗p < 0.0001 according to one-way ANOVA followed by post hoc analysis (Bonferroni test). IL-1β, interleukin-1β; TNF-α, tumor necrosis factor α; CD163, CD163 antigen; MCP-1 (CCL-2), monocyte chemoattractant protein-1; TIMD4, T cell immunoglobulin and mucin domain containing 4; CLEC4F, C-type lectin domain family 4 member F; CCR2, C-C motif chemokine receptor 2; CX3CR1, C-X3-C motif chemokine receptor 1; GPNMB, glycoprotein Nmb; TREM2, triggering receptor expressed on myeloid cell 2; SPP1, secreted phosphoprotein 1; DMM, dimethyl malonate; HF-HC, high fat and high cholesterol; MØ CLA, macrophagic crown-like aggregate; KCs, Kupffer cells; Mo-MØ, monocyte-derived macrophage.

References

    1. Anstee Q.M., Targher G., Day C.P. Progression of NAFLD to diabetes mellitus, cardiovascular disease or cirrhosis. Nat. Rev. Gastroenterol. Hepatol. 2013;10:330–344. doi: 10.1038/nrgastro.2013.41. - DOI - PubMed
    1. Witkowski M., Moreno S.I., Fernandes J., Johansen P., Augusto M., Nair S. The Economic Burden of Non-Alcoholic Steatohepatitis: A Systematic Review. Pharmacoeconomics. 2022;40:751–776. doi: 10.1007/s40273-022-01140-y. - DOI - PMC - PubMed
    1. Hardy T., Oakley F., Anstee Q.M., Day C.P. Nonalcoholic Fatty Liver Disease: Pathogenesis and Disease Spectrum. Annu. Rev. Pathol. 2016;11:451–496. doi: 10.1146/annurev-pathol-012615-044224. - DOI - PubMed
    1. Noureddin M., Mato J.M., Lu S.C. Nonalcoholic fatty liver disease: update on pathogenesis, diagnosis, treatment and the role of S-adenosylmethionine. Exp. Biol. Med. 2015;240:809–820. doi: 10.1177/1535370215579161. - DOI - PMC - PubMed
    1. Buzzetti E., Pinzani M., Tsochatzis E.A. The multiple-hit pathogenesis of non-alcoholic fatty liver disease (NAFLD) Metabolism. 2016;65:1038–1048. doi: 10.1016/j.metabol.2015.12.012. - DOI - PubMed

Substances