. 2024 May 23;187(11):2767-2784.e23.
doi: 10.1016/j.cell.2024.04.010. Epub 2024 May 10.

Perivascular neurons instruct 3D vascular lattice formation via neurovascular contact

Affiliations

Perivascular neurons instruct 3D vascular lattice formation via neurovascular contact

Kenichi Toma et al. Cell. .

Abstract

The vasculature of the central nervous system is a 3D lattice composed of laminar vascular beds interconnected by penetrating vessels. The mechanisms controlling 3D lattice network formation remain largely unknown. Combining viral labeling, genetic marking, and single-cell profiling in the mouse retina, we discovered a perivascular neuronal subset, annotated as Fam19a4/Nts-positive retinal ganglion cells (Fam19a4/Nts-RGCs), directly contacting the vasculature with perisomatic endfeet. Developmental ablation of Fam19a4/Nts-RGCs led to disoriented growth of penetrating vessels near the ganglion cell layer (GCL), leading to a disorganized 3D vascular lattice. We identified enriched PIEZO2 expression in Fam19a4/Nts-RGCs. Piezo2 loss from all retinal neurons or Fam19a4/Nts-RGCs abolished the direct neurovascular contacts and phenocopied the Fam19a4/Nts-RGC ablation deficits. The defective vascular structure led to reduced capillary perfusion and sensitized the retina to ischemic insults. Furthermore, we uncovered a Piezo2-dependent perivascular granule cell subset for cerebellar vascular patterning, indicating neuronal Piezo2-dependent 3D vascular patterning in the brain.

Keywords: Piezo2; ischemic optic neuropathy; perivascular neurons; retinal ganglion cells; three-dimensional vascular architecture; vascular lattice formation; vascular perfusions.


Conflict of interest statement

Declaration of interests J.Z. and X.Y. are employees of Genentech/Roche. J.K. is listed as an inventor on Boehringer Ingelheim’s patent (AAV-BR1, #10696717).

Figures

Figure 1
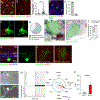
Figure 1. Retro-orbital AAV2-BR1-GFP delivery reveals perivascular RGC subset.
A, Schematic diagram showing the stereotyped organization of retinal vasculature with three planar vascular beds (SL, superficial layer; ML, middle layer; and DL, deep layer) in relative position with (GCL, ganglion cell layer, INL, inner nuclear layer; and ONL, outer nuclear layer). B, Retro-orbital delivery of AAV viral vectors for trans-vascular retinal neuron labeling. C, D, E, Sample images of retinal whole-mount I and cross-sections (D) with different AAV-CAG-GFP serotypes. Viruses at equal titer (~2–3×10¹² GC/ml) and the same volume (100 μl) in the adult C57Bl6J mice. Closed arrowheads indicate RGCs, open arrowheads indicate amacrine cells (ACs), and arrows indicate blood vessels labeled. Scale bars, 200 I(C) and 10 μm (D). Quantification (E) showing relative densities of GFP+ neurons labeled (neurons/mm2). n = 5–6 from each group. ***, p < 0.001; ****, p < 0.0001; One-Way ANOVA. F, G, H, Morphologies of perivascular AAV2-BR1-GFP+ RGCs (F, BR1-RGCs). Dendritic arbors of BR1-RGCs co-fasciculate with OFF and ON vAChT-positive starburst amacrine cells (SACs, red) as ON-OFF Direction-Selective ganglion cells (ooDSGCs) (87±3%, closed arrowhead). Rbpms (blue), a marker for RGCs. The closed arrowhead indicates the somata, the open arrowhead indicates the dendrites of BR1-RGCs, and the arrow indicates an adjacent blood vessel labeled. This BR1-RGC contacts retinal vasculature at the vertical branching point. Scale bars 20 μm. (G) Immunostaining shows BR1-RGCs do not express Cartpt (red) for conventional ooDSGCs. Scale bar, 10 μm. (H) Quantifications of BR1-RGCs expressing classic RGC markers: Rbpms, Cartpt, Satb1, and Spp1. n = 4–5 mice. I, J, K, L, in situ hybridization showing differential expression of Fam19a4 (I), Gpr88 (J), and Cdh6 (K) in virally or genetically labeled RGCs: BR1-RGCs (left), Nts-RGCs (middle), and Hb9-RGCs (right). Scale bar, 25 μm. (L) Quantification shows that Fam19a4 marks BR1-RGCs (red) and Nts-RGCs (blue), while Cdh6 labels Hb9-RGCs (grey). **, p<0.01; n.s., not significant; One-Way ANOVA. n = 4–5 mice.
Figure 2
Figure 2. Characterizations of Fam19a4/Nts-RGCs contacting ECs directly.
A, B, C, Whole-mounts showing the positions of Fam19a4/Nts-RGCs (A) versus Cartpt/Hb9-RGCs (B) to the vasculature. Close arrowheads indicate cells juxtaposed to vasculature. (C) Box plots showing the shortest distances from Hb9-RGCs versus Nts-RGCs to the nearest blood Vessels. n=4 animals, ****, p<0.0001’ Student’s t-test. D, E, Representative images and quantifications: (D, E) Fam19a4/Nts-RGC (open arrowheads) stains positive for RGC marker Tuj1 and negative for Cartpt. n=6 animals. Scale bars, 20 μm. F, G, Images (F) showing the close contact of Fam19a4/Nts-RGCs (GFP) with nearby vasculature (red, CD31) via perisomatic endfeet (closed arrowhead). Scale bars, 5 μm. Distributions (G) of Fam19a4/Nts-RGCs at the branch points (gray), onto vessels but not at branch points (shaded), and not onto vessels (white). ~22% were not at the branch point but juxtaposing the vessels, and ~14% were not juxtaposing the vessels. For this distribution to be random, the branch points must occupy >56% of the vascular length to generate a p>0.01 by Chi-square test. H, I, J, Samples from TEM showing dAPEX2-labeled Nts-RGCs (green) (H) making direct contact with a nearby blood vessel at the basement membranes (red). Such interactions were not observed for controls (I). Scale bar, 3 μm. (J) Percentages of Fam19a4/Nts-RGCs (n=13) and control RGCs (n=14) with direct blood vessel contacts. ****, p<0.000’; Fisher’s exact test. K, L, Reconstruction of Nts-RGCs for ON- and OFF- dendrites. (K) Reconstruction of dendrites of Nts-RGCs on vertical sections, indicating (91±4%) of Nts-RGCs have ON- and OFF-dendrites co-fasciculating with ChAT. (L) Wholemount views showing ON- and OFF- dendrites co-fasciculating with ChAT. Scale bar, 20 μm (K) and 50 μm (L). M, N, O, P, Fam19a4/Nts-RGCs as Temporal ooDSGCs: Sample DIC and fluorescence images identifying GFP-positive perivascular RGCs (M) for electrophysiological recording, Scale bar, 20 μm. Scatter (Bottom, Hz) and Roster (Top) plots of RGCs (N) as light stimulations: ON versus OFF responses. Direction-selectivity index (DSI, O) vector sum, based on experiments in (N) indicating them as Temporal-sensing directional responses; Quantifications (P) of GFP-RGCs (red) versus control neighboring RGCs (grey). n = 19 out of 26 possess such properties, n=4 animals, ****, p<0.0001’ Student’s t-test.
Figure 3
Figure 3. Fam19a4/Nts-RGCs pattern the perpendicular lattice of the 3D retinal vasculature.
A, B, C, Wholemount images showing aberrant lateral vascular segments in the penetrating zone (PZ) between SL and ML subject to Nts-RGC ablation (B) versus control (A) and Cartpt-RGC ablation (C) at P30. IB4 pseudo-colored: blue, SL; green, ML; red, DL; magenta, penetrating zone (PZ). Closed arrowheads indicate aberrant lateral vascular segments in PZ. Scale bars, 50 μm. Note: all retina wholemounts were taken in the medial/central retinal regions, within 750–1500 μm to optic nerve heads. D, E, Quantifications of aberrant vascular segments (D) incidence and numbers of penetrating vessels from the SL per mm2 across the indicated conditions (E). n = 5–6 animals from each group. ****, p<0.0001; n. s., not significant; One-Way ANOVA. F, G, H, Wholemount images at P10, in pseudo-colors (SL, blue; PZ, magenta; DL, red): Control injections (F), Nts-RGC ablation (G) and Cartpt-RGC ablation (H). Scale bar, 50 μm. I, J, Quantifications of vascular parameters in (F-H): Aberrant vascular segments in PZ in Fam19a4/Nts-RGC ablated retinas but not the Cartpt/Hb9-RGC ablated ones (I). The densities of penetrating vessels (J) remained unchanged. n = 5–6 animals from each group. ****, p<0.0001; n. s., not significant; One-Way ANOVA.
Figure 4
Figure 4. Neuronal Piezo2 is required for normal penetrating vessel patterning and adult 3D vascular structure.
A, Dot plots showing enrichment of Piezo2 in Fam19a4/Nts-RGCs compared to Cartpt/Hb9-RGCs (conventional ooDSGCs) in a scRNA-seq dataset of P5. B, C, E, in situ hybridization of Piezo2 (red) enrichment in Fam19a4/Nts-RGCs (B), but not in Cartpt/Hb9-RGCs (C) at P7. Boxed areas show a zoomed-in view (Piezo2) inside the somata. Quantification of Piezo2 (E) was compared in Nts-RGCs (85.2±2.4%) and Hb9-RGcs (2.3±1.4%). n=4–8 animals. ****, p<‘.0001, Student’s t-test. Scale bar, 10 μm. D, Immunostaining showing PIEZO2-GFP fusion (Green) juxtaposed to endothelial cells (CD31, blue) at the GCL (Rbmps, Red). Closed arrowheads indicate the branch point where a penetrating vessel exits the SL and extends toward the inner retina. Scale bar, 10 μm. F, G, H, I, (F) in situ hybridization of PIEZO2 and CD31 onto the central human prenatal retina (GW23), indicating that PIEZO2 is expressed at GCL; a PIEZO2-enriched RGC subset shows perivascular localization. (G) In contrast, TBR1-RGCs (green) did not exhibit such proximity with retina vessels (CD31, red). (H) in situ hybridization of PIEZO2 (green), CD31 (red), and RBPMS (blue), indicating PIEZO2 enriched in the human RGC subset. (I) Quantifications showing PIEZO2-RGCs in close contact with vessels, in contrast to TBR1-RGCs (36.5±3.1% and 0%). n=4 donor samples between GW22–23. Scale bars, 20 μm. ****, p<‘.0001, Student’s t-test. J, K, L, Wholemounts showing retinal vasculatures at P10 in pseudo-colors (blue, SL; green, PZ; red, DL) from controls (K), neuronal knockout Piezo2Ret (Six3-Cre; Piezo2F/F) (K), and endothelial knockout Piezo2Endo (Tie2-Cre; Piezo2F/F) (L). Scale bar, 50 μm. M, N, O, Quantification of vascular parameters in (J-L). Aberrant lateral vascular segments in the penetrating zone (M) were increased in Piezo2Ret but not Piezo2Endo retinas relative to controls. Densities of penetrating vessels were unaffected (N). n=4–6 animals each. ****, p<0.0001; n. s., not significant; One-Way ANOVA. Illustration (O) of the vascular phenotypes in Piezo2Ret. P, Q, R, S, T, Mesoscopic vascular reconstructions of the SL (blue), DL (red), and PV (green) in adults. ML was masked to facilitate the viewing of PVs. Side-projection of 3D rendered vascular lattice in adult controls (P) showing the pillar-like organization of PVs; in adult Piezo2Ret or Piezo2Nts mutants (Q, R) showing persistent vascular abnormalities with slanted PVs (closed arrowheads). Scale bars, 50 μm. (S) Workflow of mesoscopic imaging, enabled by a customized two-photon-microscope with a whole-eye staining protocol. (T) Angles of PVs were quantified: control (N=408, black), Piezo2Ret (N= 291, red), and Piezo2Nts (N= 365, orange). Each line in the lower panel indicates each penetrating vessel quantified. n=4 animals in each condition.
Figure 5
Figure 5. Piezo2 is required in developing Fam19a4/Nts-RGCs for PV patterning to form a normal 3D vascular lattice.
A, B, C, D, Wholemount images showing retinal vasculatures stained by IB4 at P10 in pseudo-colors (SL, blue; PZ, green; and DL, red) in control Piezo2F/F (A) versus Piezo2Nts (Nts-Cre; Piezo2F/F) (B). Scale bar, 50 μm. Quantifications of vascular parameters in (C and D): Aberrant vascular segments in PZ are observed in Piezo2Nts mutants (C), while the overall density of penetrating vessels (D) was unchanged compared to controls. ****, p<0.0001; n. s., not significant; Student’s t-test, n= 5 animals each. E, F, G, H, Single-plane wholemount images of the P8 retina show twisted (closed arrowheads) and slanted (arrows) PVs from the SL in Fam19a4/Nts-RGCs (Piezo2Nts) (F). PVs are largely perpendicular and appear as puncta in controls (open arrowheads, E). Scale bar, 50 μm. Quantification (G) showing the fraction of perpendicular versus slanted PVs in control vs. Piezo2Nts at P8. ****, p’0.0001; Fisher’s exact test. Quantifications (G) to show the fractions of perpendicular versus slanted PVs near Nts-RGCs vs. not near Nts-RGCs at P8. ****, p’0.0001; Fisher’s exact test. (H) Illustrated phenotypes in (E and F). I, J, K, L, 3D reconstructions showing co-staining of Fam19a4/Nts-RGC (GFP, green) and vasculature (red) in P8 littermate controls (I) and Piezo2Nts (J). Closed arrowheads indicate the vascular contacting endfeet seen in control Fam19a4/Nts-RGCs. Arrows depict PVs. Scale bar, 10 μm. (K) Quantification of Nts-RGCs from control versus Piezo2Nts harboring vascular-contacting perisomatic endfeet. ****, p’0.0001; Fisher’s exact test. (L) Quantifications showing the fractions of perpendicular versus slanted penetrating vessels near Nts-RGCs vs. not near Nts-RGCs at P8 in the Piezo2Nts. ****, p’0.0001; Fisher’s exact test.
Figure 6
Figure 6. Neuronal Piezo2 knockout exhibited retinal vascular perfusion deficits, tissue hypoxia, and enhanced susceptibility to ischemic ocular insults.
A, B, C, FFA showing reduced blood perfusions in Piezo2Ret (B) and Piezo2Nts (C), compared to controls (A). Scale bears, 500 μm. D, Quantification of fluorescein intensity in capillaries, showing reduced perfusions into capillaries in Piezo2Ret and Piezo2Nts compared to controls. n=5 animals each. ****, p<0.0001; n. s., not significant, One-Way ANOVA. E, F, G, H, Images showing elevated HIF1A levels in the adult Piezo2Ret (F) and Piezo2Nts (G), compared to controls (E). (H) Quantifications of HIF1A fluorescence in (E, F, and G): Control (gray), Piezo2Ret (red), and Piezo2Nts (orange). Scale bars, 20 μm; n=6–7 animals *, p<0.05; n.s., not significant; One-Way ANOVA. I, L, RGC survival rates at 3, 6, 9, and 12 months of age in Piezo2Ret, Piezo2Nts mutants, compared to controls, revealing a progressive loss of RGCs. Neuronal losses started at 9 months and demonstrated severe loss at 12 months, with sample images at 12 months shown in (L). Control (gray), Piezo2Ret (red), and Piezo2Nts (orange). Scale bars, 50 μm, n=5–16 animals each; ****, p<0.0001; ***, p<0.001 n. s., not significant, One-Way ANOVA. J, K, patterned-ERG (J) showing a decline of RGC function in Piezo2Ret and Piezo2Nts mutants compared to controls at 12 months of age (as in I): P1-N2 amplitudes quantified in (K). *, p0.05; **, p0.01; n. s., not significant, One-Way ANOVA; n=5 animals each. M, N, Illustration (M) showing the induction of transient vascular ischemia in the AION model. Rose-Bengal dye injected into the tail vein causes thrombosis and blockage of blood vessels in the laser-treated area by the photochemical reaction. RGC survivals were quantified in (N) between AION-treated and contralateral controls. n=5–8 animals each. ***, p0.001; **, p0.01; n. s., not significant, One-Way ANOVA. O, patterned-ERG measurement showing a decline of RGC function in Piezo2Ret, Piezo2Nts mutants, compared to controls under AION conditions: P1-N2 amplitudes quantified and compared between AION-treated and contralateral controls. **, p<0.01; n. s., not significant, One-Way ANOVA; n=4–7 animals each.
Figure 7
Figure 7. Perivascular CGC subsets utilize a Piezo2-dependent mechanism to regulate vasculature.
A-H, Piezo2-expressing cerebellar neurons are a subset of CGCs. (A) Images showing Piezo2expressing neurons labeled in Piezo2-Cre; ROSA26-CAG-LSL-GFP animals; Piezo2-positive neurons stain negative for Purkinje cells (Calbindin, B, open-arrowhead) or interneurons (GABA, C, open-arrowhead), but positive for CGC (Pax6, D, 99.6±0.3%, closed-arrowhead). (E) Zoom-in view showing Piezo2-CGCs (closed-arrowhead) are close to nearby vasculature (CD31, red). Low Piezo2 expression is also present in endothelial cells (CD31+, arrows). Scale bars, 50 μm. (F) Morphological analysis of Piezo2-CGCs by sparse labeling showing the distribution associated with ECs. Scale bar, 25 μm. (G) Quantification showing the percentages of Piezo2-CGCs directly contacting vessels, compared to random CGCs (64.9±3.0% and 34.6±2.0%). ****, p<0.001, Student’s t-test; n=5 animal. (H) Quantification for the fractions of Piezo2-GFP neurons with indicated markers in (B-D). I, J, K, L, Sample sagittal sections and quantification showing cerebellar vasculature (CD31, red) subject to Piezo2-CGC elimination (J) versus controls (I). Scale bar, 20 μm. Vessel orientations (K) and vessel densities (L) were quantified. The vertical-pointing vessels ratio decreases in Piezo2-CGC eliminated retinas compared to controls (25.05±0.3% and 33.98±4.6%, respectively). *, p<0.05; n.s., not significant; Student’s t-test. M, N, O, P, Sample cerebellar sagittal sections and quantification showing the structures of cerebellar vasculature (IB4) subject to Piezo2 losses. (N) versus controls (M) after Cre-virus injections. Scale bar, 20 μm. Vessel orientations (O) and vessel densities (P) were quantified. The vertical-pointing vessels ratio is decreased in Piezo2 loss conditions, compared to controls (22.34±3.5% and 33.17±3.6%, respectively). **, p<0.05; n.s., not significant; Student’s t-test. Q, Models illustrating a neuronal Piezo2-dependent mechanism in instructing cerebellar 3D-vascular patterning.

References

    1. Kaplan L, Chow BW, and Gu C. (2020). Neuronal regulation of the blood-brain barrier and neurovascular coupling. Nat Rev Neurosci 21, 416–432. 10.1038/s41583-020-0322-2. - DOI - PMC - PubMed
    1. Peguera B, Segarra M, and Acker-Palmer A. (2021). Neurovascular crosstalk coordinates the central nervous system development. Curr Opin Neurobiol 69, 202–213. 10.1016/j.conb.2021.04.005. - DOI - PMC - PubMed
    1. James JM, Gewolb C, and Bautch VL (2009). Neurovascular development uses VEGF-A signaling to regulate blood vessel ingression into the neural tube. Development 136, 833–841. 10.1242/dev.028845. - DOI - PMC - PubMed
    1. Eichmann A, and Thomas JL (2013). Molecular parallels between neural and vascular development. Cold Spring Harb Perspect Med 3, a006551. 10.1101/cshperspect.a006551. - DOI - PMC - PubMed
    1. Walchli T, Wacker A, Frei K, Regli L, Schwab ME, Hoerstrup SP, Gerhardt H, and Engelhardt B. (2015). Wiring the Vascular Network with Neural Cues: A CNS Perspective. Neuron 87, 271–296. 10.1016/j.neuron.2015.06.038. - DOI - PubMed

LinkOut - more resources