. 2024 Jun 20;187(13):3427-3444.e21.
doi: 10.1016/j.cell.2024.04.022. Epub 2024 May 10.

Spinal projecting neurons in rostral ventromedial medulla co-regulate motor and sympathetic tone

Affiliations

Spinal projecting neurons in rostral ventromedial medulla co-regulate motor and sympathetic tone

Zicong Zhang et al. Cell. .

Abstract

Many behaviors require the coordinated actions of somatic and autonomic functions. However, the underlying mechanisms remain elusive. By opto-stimulating different populations of descending spinal projecting neurons (SPNs) in anesthetized mice, we show that stimulation of excitatory SPNs in the rostral ventromedial medulla (rVMM) resulted in a simultaneous increase in somatomotor and sympathetic activities. Conversely, opto-stimulation of rVMM inhibitory SPNs decreased both activities. Anatomically, these SPNs innervate both sympathetic preganglionic neurons and motor-related regions in the spinal cord. Fiber-photometry recording indicated that the activities of rVMM SPNs correlate with different levels of muscle and sympathetic tone during distinct arousal states. Inhibiting rVMM excitatory SPNs reduced basal muscle and sympathetic tone, impairing locomotion initiation and high-speed performance. In contrast, silencing the inhibitory population abolished muscle atonia and sympathetic hypoactivity during rapid eye movement (REM) sleep. Together, these results identify rVMM SPNs as descending spinal projecting pathways controlling the tone of both the somatomotor and sympathetic systems.

Keywords: blood pressure; medulla; motor control; reticulospinal neurons; spinal projecting neurons; sympathetic regulation; sympathetic tone.


Conflict of interest statement

Declaration of interests Z.H. is a co-founder of Rugen and Myrobalan and an advisor of Axonis.

Figures
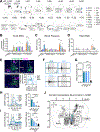
Figure 1.
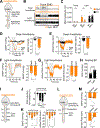
Figure 1.. Opto-stimulation mapping of excitatory SPNs controlling somatomotor and/or sympathetic responses in anesthetized mice
(A) Coordinates of fiber-optic tips targeting different populations of Vglut2+ SPNs. (B-D) Average (±SEM) changes of EMG responses (normalized to the maximum amplitude within same subject) (B), mean arterial pressure (C) or heart rate (D, with the presence of muscle relaxant), upon stimulating different populations of Vglut2+ SPNs, *, P<0.05; **, P<0.01; ****, P<0.0001; Kruskal-Wallis test with Dunn’s multiple comparisons. (E) Representative images showing fiber-optic tip (white rectangles) and soma locations of the intersectionally labeled Vglut2+ SPNs in GiA, GiV and MdV, respectively. Bottom right panel: cell distribution and fiber-optic tip location along rostral-caudal axis. Scale bar: 200μm. 7N, facial nucleus; g7, genu of the facial nerve; py, pyramidal tract; Amb, Ambiguus nucleus; IO, inferior olive. (F) Representative EMG responses upon opto-stimulation (gray shade) in GiA, GiV or MdV with ChrimsonR-expressing SPNs or in GiA of control in control wild type mice received the same virus injection. EMG scale bar: 0.01mV; Time scale bar: 10s. (G) Average (±SEM) maximal EMG responses upon opto-stimulation. ****, P<0.0001, one-way ANOVA with Dunnett’s multiple comparison test. (H, I) Time course (left) and maximum changes (right, average ± SEM) of MAP (G) and heart rate (H) upon stimulation (gray shade) from baseline (10 seconds before stimulation). *, P<0.05; **, P<0.01; ****, P<0.0001, ns, not significant; one-way ANOVA with Tukey’s multiple comparison test. (J) Stimulation sites with somatomotor and sympathetic responses.
Figure 2.
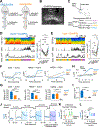
Figure 2.. Excitatory rVMM SPNs control somatomotor and sympathetic functions through spinal projections in anesthetized mice
(A) Experimental scheme. (B) Left panel: image of brainstem coronal section showing the expression of ReaChR in rVMM. Right panels: ReaChR expression areas in two coronal levels of rVMM, colors marked for different subjects, n=6. (C) Immunostaining image (left) and cell counts (right) showing nearly no ReaChR expression diffused to C1 neurons. Quantification from 16 sections of 6 mice. ****, P<0.0001; unpaired t test. (D) Examples and average (±SEM) maximal EMG responses upon opto-stimulation (gray shade) at different spinal cord levels. EMG scale bar: 0.05mV; Time scale bar: 10s. *, P<0.05; ***, P<0.001; one-way ANOVA with Dunnett’s multiple comparison test. (E, F) Time course (E) and maximal changes (F, mean ± SEM) of MAP and heart rate upon opto-stimulation (gray shade) at different spinal cord levels. ****, P<0.0001; ns, not significant; one-way ANOVA with Tukey’s multiple comparison test. (G) Scheme of assessing the effects of local stimulation of ReaChR-expressing axons from excitatory SPNs in rVMM after C4 spinal transection. (H, I) Time course (H) and maximal changes (I, mean ± SEM) of MAP and heart rate upon opto-stimulation (gray shade) at T3 before and after cervical transection. ns, not significant; paired t test. (J) Representative trace (left panel) and average change of blood pressure and heart rate after C4 transection. *, P<0.05; **, P<0.01; paired t test. BL, baseline; Tx, transection.
Figure 3.
Figure 3.. Inhibitory rVMM SPNs suppress somatomotor and sympathetic activities in anesthetized mice
(A) Experimental scheme. (B) Examples of EMG responses upon opto-stimulation (gray shade) under deep or light anesthesia in Vgat-FlpO mice (orange outline) or WT mice (black outline). EMG scale bar: 0.01mV. Time scale bar: 10s. BL: baseline. (C) Average (±SEM) EMG amplitude during baseline (BL) and opto-stimulation (Stim.) in deep or light anesthesia conditions in Vgat-FlpO mice (orange) or WT mice (black). **, P<0.01; ns, not significant; two-way ANOVA with Bonferroni’s multiple comparisons test. (D, E) Time course (left) and maximal changes (right, average ±SEM) of MAP and heart rate upon opto-stimulation in deep anesthesia with muscle relaxant. ****, P<0.0001; unpaired t test. (F, G) Time course (left) and maximal changes (right, average ±SEM) of MAP and heart rate upon opto-stimulation in lightly anesthetized condition, compared to deep anesthesia. *, P<0.05; ns, not significant; unpaired t test. (H) Comparison of resting blood pressure between deep and light anesthesia. ****, P<0.0001; unpaired t test. (I) Experimental scheme to express ChrimsonR in the inhibitory SPNs in rVMM and stimulate their spinal cord projections at different spinal levels. (J) Average (±SEM) EMG reduction upon opto-stimulation at different spinal cord levels. ***, P<0.001; ****, P<0.0001; one-way ANOVA with Tukey’s multiple comparison test. (K) Maximal reduction (mean ± SEM) of MAP and heart rate upon opto-stimulation at different spinal cord levels. *, P<0.05; one-way ANOVA with Fisher’s LSD test. (L) Scheme of assessing the effects of stimulating the spinal projections of inhibitory SPNs in rVMM after C4 spinal transection. (M) Maximal reduction (mean ± SEM) of MAP and heart rate upon opto-stimulation at T3 before and after cervical transection. ns, not significant; paired t test.
Figure 4.
Figure 4.. Spinal innervation patterns of excitatory and inhibitory rVMM SPNs
(A) Experimental scheme. (B) Contour maps of excitatory fiber densities in different spinal levels. (C) Upper panel: representative image of excitatory projections in thoracic IML. Scale bar, 100μm. Lower panel: excitatory synaptic boutons (labeled by RFP, Syp) co-localize with ChAT+ IML neurons (pointed by white arrow). Scale bar, 5μm. (D) Excitatory projections in cervical spinal cord. Scale bar, 100μm. (E) Scheme of intersectional labeling of inhibitory SPNs in rVMM with GFP and synapse-targeting RFP. (F) Contour maps of inhibitory fiber densities in different levels of the spinal cord. (G) Upper panel: representative image of inhibitory projections in thoracic IML. Scale bar, 100μm. Lower panel: excitatory synaptic boutons (labeled by RFP, Syp) colocalize with ChAT+ IML neurons (pointed by white arrow). Green and red channels of the pointed structure are split below. Scale bar, 5μm. (H) Inhibitory projections in cervical spinal cord. Scale bar, 100μm. (I, J) Left panel: scheme of intersectional labeling of L4/5-projecting excitatory (I) or inhibitory (J) rVMM SPNs with GFP and synapse-targeting RFP. Middle panel: contour maps of excitatory fiber densities at different spinal levels, derived from lumbar projecting SPNs. Right panel: excitatory synaptic boutons (Syp, RFP), derived from lumbar projecting SPNs, terminated on ChAT+ IML neurons in thoracic spinal cord (pointed by white arrow). Scale bar, 5μm.
Figure 5.
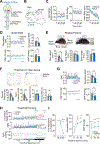
Figure 5.. Neuronal activity patterns of excitatory and inhibitory rVMM SPNs in different behavioral states
(A) Experimental scheme. (B) Representative imaging of rVMM showing the excitatory rVMM SPNs expressing GCaMP6s and the fiber-optic tract. White rectangle indicates fiber-optic tract. Scale bar, 200μm. (C) Scheme showing EMG/EEG/Photometry recording of mice. Both EMG and EEG data were considered to define four different states (see text for details). Purple for Active state, gray for Quiet state, yellow for NREM state, and blue for REM state. The same color coding is used in the subsequent panels. (D) Example recording and analysis of Vglut2+ rVMM SPNs calcium activity. Left panel: EEG spectrogram, EMG and z-scored dFF. Corresponding arousal states were indicated at the bottom. Right panel: group comparison of Vglut2+ rVMM SPNs calcium activity between different states (mean±SEM, n=9). ****, P<0.0001; ***, P<0.001; **, P<0.01; ns, not significant; repeated measures one-way ANOVA with Fisher’s LSD multiple comparisons test. (E) Example recording and analysis of Vgat+ rVMM SPNs calcium activity. Left: EEG spectrogram, EMG and z-scored dFF. Corresponding arousal states were indicated at the bottom. Right: group comparison of Vgat+ rVMM SPNs calcium activity between different states (mean±SEM, n=7). ****, P<0.0001; ***, P<0.001; **, P<0.01; ns, not significant; repeated measures one-way ANOVA with Fisher’s LSD multiple comparisons test. (F) Calcium activities (z-dFF, mean±SEM) of excitatory and inhibitory rVMM SPNs during transitions of different behavioral states. For Vglut2+ GCaMP6s, N=9 mice, n=127 events for Quiet to Active (Q-A), n=194 for NREM to Active (N-A), n=235 for NREM to REM (N-R); for Vgat+ GCaMP6s, N=7 mice, n=105 events for Q-A, n=160 for N-A, n=167 for N-R; for GFP, N=6 mice, n=61 events for Q-A, n=98 for N-A, n=132 for N-R.) (G) Average (±SEM) of calcium activity changes (9 seconds post-transition minus 9 seconds pre-transition). ***, P<0.001; ****, P<0.0001; Kruskal-Wallis test with Dunn’s multiple comparisons. (H) Calcium activities (mean±SEM) of excitatory and inhibitory rVMM SPNs during locomotion bout onset in open arena. Activities of 2 seconds before bout onset (>5cm/s) were used as baseline. (I) Comparison of calcium activities difference between each group. ns, not significant; ***, P<0.001; ****, P<0.0001; one-way ANOVA with Bonferroni comparison. (J) Calcium activities (mean±SEM) of Vglut2+ rVMM SPNs in treadmill running at different speeds. Average traces showing z-scored dFF in each treadmill speed. Timepoints of 2 seconds before and 2 seconds after treadmill onset are shown as break lines in orange and green, respectively. 30-second periods are shaded in blue. N=7. (K) Mean (±SEM) z-dFF of two seconds before and two seconds after treadmill onset at different speeds. *, P<0.05; **, P<0.01; paired t-test. (L) Mean (±SEM) z-dFF of 30 seconds after treadmill onset at different speeds, compared to the mean z-dFF during quiet moments (0). **, P<0.01; Mixed-effects analysis with Fisher’s LSD multiple comparisons test.
Figure 6.
Figure 6.. Silencing excitatory rVMM SPNs reduces muscle and sympathetic tone at rest and during locomotion
(A) Experimental Scheme. (B) Scheme of EEG/EMG and blood pressure (BP) / heart rate (HR) recording in behaving mice. (C) Dynamics (in 20-minute time window right after vehicle or DCZ treatment) of EMG amplitude, MAP and heart rate of mice in home cage. Zero represents baseline of 20 minutes prior to treatment. *, P<0.05; n=7; Mixed-effects analysis with Bonferroni’s multiple comparisons test. (D) Representative EMG amplitude and MAP in quite state (left) and quantification (right) after vehicle or DCZ treatment. Scale bar, 60 seconds. Right panel: mean and individual value of EMG amplitude and MAP in quiet state after vehicle or DCZ treatment. *, P<0.05; **, P<0.01; paired t test. (E) Images (upper) and quantification of body posture at rest after vehicle or DCZ treatment. For lower panel, quantification, mean and individual value. *, P<0.05; **, P<0.01; ****, P<0.0001; paired t test. (F) Trajectory of body mass position for 10 minutes in open arena after vehicle or DCZ treatment (Left) and quantification of performance in open arena (right). Scale bar: 10 cm. For the right panel, mean and individual value. ***, P<0.001; ****, P<0.0001; paired t test. (G) Representative EMG amplitude and MAP in open arena after vehicle or DCZ treatment (left) and mean and individual value of EMG amplitude and MAP (right). Scale bar, 60. **, P<0.01; paired t test. (H) Representative traces of locomotion speed (top), normalized EMG (middle), and MAP (bottom) at different treadmill speeds after vehicle or DCZ treatment. Time scale bar, 60s. (I) Average (±SEM) locomotion speed, EMG peak amplitude and MAP at different treadmill Speeds after vehicle or DCZ treatment. The levels of EMG and MAP from vehicle controls were sub-sampled to match the duration of running in the DCZ group. **, P<0.01, ****, P<0.0001; n=7; two-way ANOVA with Tukey’s multiple comparisons test.
Figure 7.
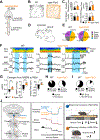
Figure 7.. Silencing inhibitory rVMM SPNs increases locomotion in awake mice and impairs muscle atonia and sympathetic reduction in REM sleep
(A) Experimental scheme. (B) Representative body-mass trajectories in open arena. Scale bar, 10 cm. (C) Average (±SEM) of different parameters for locomotion in open arena, n=6 for Vgat-FlpO mice, n=10 for WT mice. *, P<0.05; **, P<0.01; ns, not significant; unpaired t test. (D) Scheme of EEG/EMG and BP/HR recording in behaving mice. (E) Mean proportion of four different behavioral states from 24-hour recording in WT and Vgat-FlpO mice. Statistical differences are found in active, and REM sleep states (Figure S7F). Percentage, mean±SEM, n=7, unpaired t test. (F) Representative traces of EEG power spectrum, EMG amplitude, MAP and HR in REM sleep episode in WT and Vgat-FlpO mice. Scale bar, 60 seconds. (G) Average (±SEM) changes of EMG, MAP and heart rate compared to preceding baseline (30 seconds prior to REM onset). ***, P<0.001; unpaired t test. (H, I) Proportion of REM sleep episodes with or without muscle (I), and proportion of REM sleep episodes with or without blood pressure drop (J) atonia in WT or Vgat-FlpO mice. Differences are statistically significant (Figure S7G). (J) Summary of the key results.

References

    1. Waldrop TG, Eldridge FL, Iwamoto GA, and Mitchell JH (2010). Central neural control of respiration and circulation during exercise. Comprehensive physiology, 333–380.
    1. Michelini LC, O’Leary DS, Raven PB, and Nóbrega AC (2015). Neural control of circulation and exercise: a translational approach disclosing interactions between central command, arterial baroreflex, and muscle metaboreflex. American Journal of Physiology-Heart and Circulatory Physiology 309, H381–H392. - PMC - PubMed
    1. Liu D, and Dan Y (2019). A Motor Theory of Sleep-Wake Control: Arousal-Action Circuit. Annu Rev Neurosci 42, 27–46. 10.1146/annurev-neuro-080317-061813. - DOI - PubMed
    1. Scammell TE, Arrigoni E, and Lipton JO (2017). Neural Circuitry of Wakefulness and Sleep. Neuron 93, 747–765. 10.1016/j.neuron.2017.01.014. - DOI - PMC - PubMed
    1. Strack AM, Sawyer WB, Marubio LM, and Loewy AD (1988). Spinal origin of sympathetic preganglionic neurons in the rat. Brain Res 455, 187–191. 10.1016/0006-8993(88)90132-1. - DOI - PubMed

LinkOut - more resources