. 2024 Jul;89(1):106173.
doi: 10.1016/j.jinf.2024.106173. Epub 2024 May 9.

Baseline and end-of-treatment host serum biomarkers predict relapse in adults with pulmonary tuberculosis

Affiliations

Baseline and end-of-treatment host serum biomarkers predict relapse in adults with pulmonary tuberculosis

Hygon Mutavhatsindi et al. J Infect. 2024 Jul.

Abstract

Background: There is a need for new tools for monitoring of the response to TB treatment. Such tools may allow for tailored treatment regimens, and stratify patients initiating TB treatment into different risk groups. We evaluated combinations between previously published host biomarkers and new candidates, as tools for monitoring TB treatment response, and prediction of relapse.

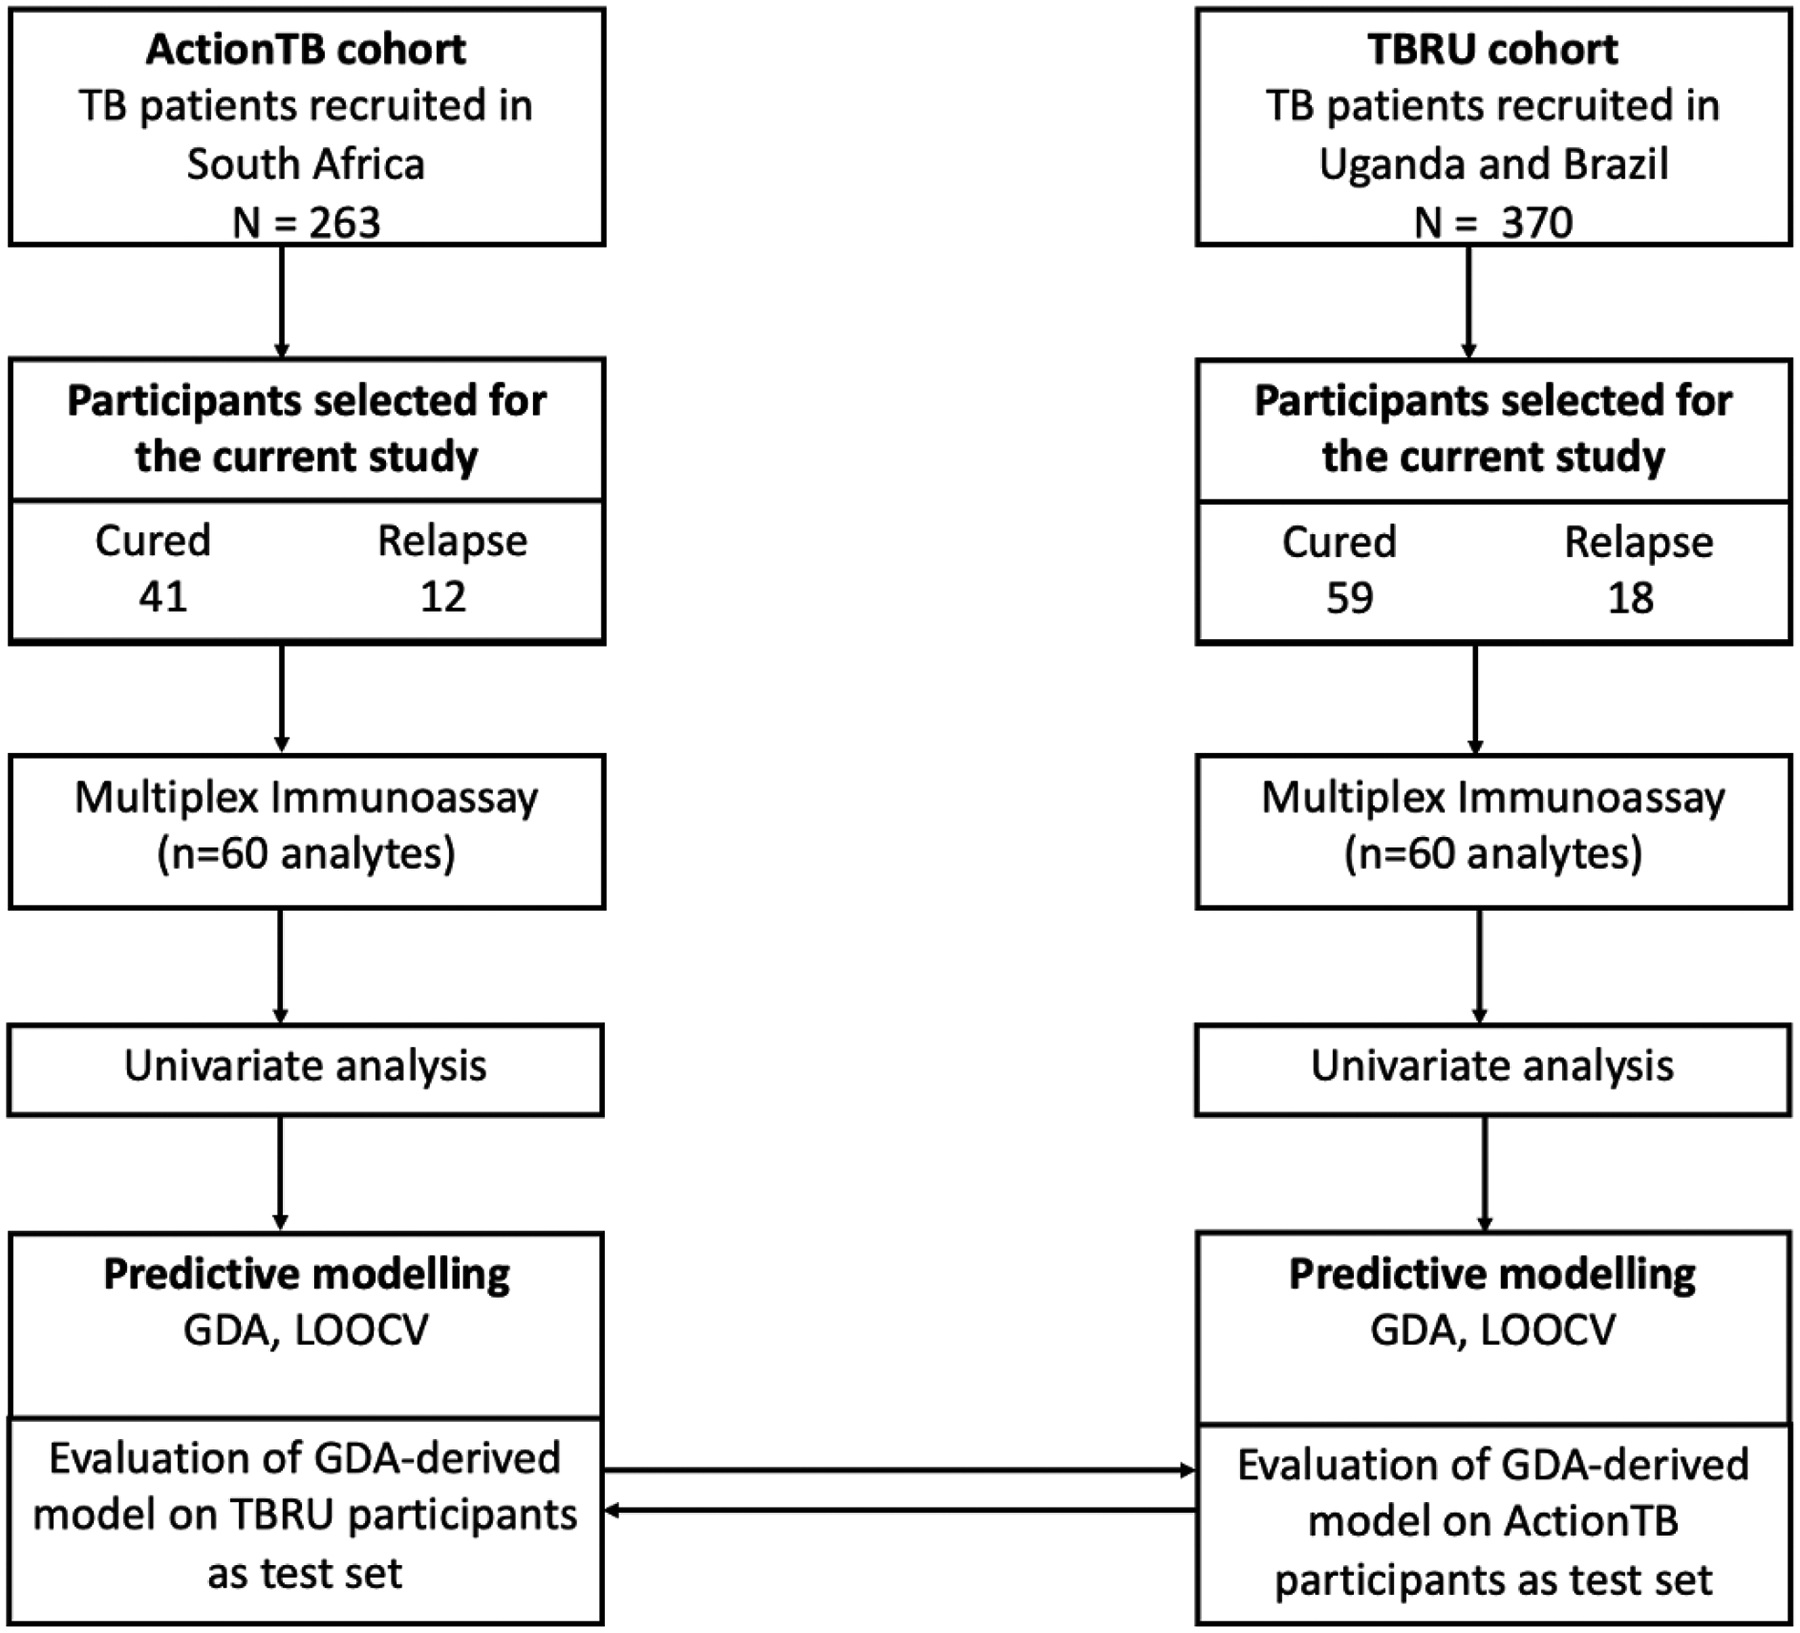
Methods: Serum samples were collected at multiple time points, from patients initiating TB treatment at research sites situated in South Africa (ActionTB study), Brazil and Uganda (TBRU study). Using a multiplex immunoassay platform, we evaluated the concentrations of selected host inflammatory biomarkers in sera obtained from clinically cured patients with and without subsequent relapse within 2 years of TB treatment completion.

Results: A total of 130 TB patients, 30 (23%) of whom had confirmed relapse were included in the study. The median time to relapse was 9.7 months in the ActionTB study (n = 12 patients who relapsed), and 5 months (n = 18 patients who relapsed) in the TBRU study. Serum concentrations of several host biomarkers changed during TB treatment with IL-6, IP-10, IL-22 and complement C3 showing potential individually, in predicting relapse. A six-marker signature comprising of TTP, BMI, sICAM-1, IL-22, IL-1β and complement C3, predicted relapse, prior to the onset of TB treatment with 89% sensitivity and 94% specificity. Furthermore, a 3-marker signature (Apo-CIII, IP-10 and sIL-6R) predicted relapse in samples collected at the end of TB treatment with sensitivity of 71% and specificity of 74%. A previously identified baseline relapse prediction signature (TTP, BMI, TNF-β, sIL-6R, IL-12p40 and IP-10) also showed potential in the current study.

Conclusion: Serum host inflammatory biomarkers may be useful in predicting relapse in TB patients prior to the initiation of treatment. Our findings have implications for tailored patient management and require prospective evaluation in larger studies.

Keywords: Biomarkers; Biosignatures; Relapse; Treatment response; Tuberculosis.


Conflict of interest statement

Declaration of Competing Interest The authors declare that they have no known competing financial interests or personal relationships that could have appeared to influence the work reported in this paper.

Figures

Figure 1:
Figure 1:. Overall study design.
Of the 263 TB patients that were recruited in the ActionTB study, 12 had documented relapse. These 12 patients who had a relapse were selected, and proportionally matched according to sex at diagnosis, to the cured controls. Specimens obtained from 18 patients who relapsed from the TBRU study, and 59 cured patients were available. Prediction models using combinations between clinical, microbiological, and host immunological parameters were evaluated in the ActionTB study alone, TBRU study alone and when both studies were combined. The predictive accuracies of biosignatures identified in one study cohort were evaluated on specimens obtained from the other, with either cohort serving as “test set”. GDA= General discriminant analysis, LOOCV= leave-one-out cross validation.
Figure 2:
Figure 2:. Changes in the concentrations of host biomarkers during TB treatment.
Host biomarkers whose concentrations changed the most in ActionTB study participants are shown. Specimens collected prior to the start of TB treatment (diagnosis; Dx), weeks 2, 6 and 26 of treatment were available for all ActionTB study participants. Data were analysed using mixed model repeated measures ANOVA. Means are shown for each time point. Red lines represent the cured patient group and blue lines represent patients who relapsed. The means of the two groups were compared at each time point (cured vs relapse). The letters ‘a’ to ‘f’ indicate statistical significance. That is, any two points with the same letter are not significantly different from each other. A p-value of <0.05 was regarded as significantly different. Error bars indicate the 95% confidence intervals. All concentrations are in pg/mL apart from SAP and CFB (ng/mL).
Figure 3:
Figure 3:. Changes in the concentrations of host biomarkers with treatment in the TBRU cohort.
Host markers whose concentrations changed significantly in the TBRU study participants are shown. Specimens collected at diagnosis (Dx), weeks 8, and 26 of treatment were available for the TBRU study participants. Data were analysed using mixed model repeated measures ANOVA. Means are shown for each time point. Red lines represent the cured patient group and blue lines represent patients who relapsed. The means of the two groups were compared at each time point (cured vs relapse). All concentrations are in pg/mL except for C4 and Apo-CIII (ng/mL). The letters ‘a’ to ‘d’ indicate statistical significance. i.e., points with the same letter are not significantly different from each other. A p-value of <0.05 was regarded as significantly different. Error bars indicate the 95% confidence intervals.
Figure 4:
Figure 4:. Accuracy of biosignatures derived from specimens collected from ActionTB study participants at various time points following the initiation of TB treatment, in the prediction of relapse.
(A) ROC curve showing the accuracy of the 6-marker baseline biosignature (TTP, BMI, sICAM-1, IL-22, IL-1β and complement C3). (B) ROC curve showing the accuracy of the 3-marker biosignature (sICAM-1, D-dimer and TNF-α) at week 2 of treatment. (C) ROC curve showing the accuracy of the 4-marker biosignature (MPO, MMP-3, IFN-γ and MMP-3) at week 6 of treatment. (D) ROC curve showing the accuracy of the 2-marker end-of-treatment biosignature (IP-10 and sIL-6R).
Figure 5:
Figure 5:. Accuracy of biosignatures derived from specimens collected from TBRU study participants at various time points in the prediction of relapse.
(A) ROC curve showing the accuracy of the 3-marker baseline biosignature (TTP, BMI and IL-22). (B) ROC curve showing the accuracy of the 4-marker biosignature (sICAM-1, sIL-4R, MCP-1 and MIP-1α) derived at week 8 of treatment. (C) ROC curve showing the accuracy of the 2-marker end-of-treatment signature (Apo CIII and MIP-1α).

References

    1. Global tuberculosis report 2023. Accessed March 14, 2024. https://www.who.int/publications/i/item/9789240083851
    1. Uys P, Brand H, Warren R, van der Spuy G, Hoal EG, van Helden PD. The Risk of Tuberculosis Reinfection Soon after Cure of a First Disease Episode Is Extremely High in a Hyperendemic Community. Mistry N, ed. PLoS ONE. 2015;10(12):e0144487. doi: 10.1371/journal.pone.0144487 - DOI - PMC - PubMed
    1. Marx FM, Floyd S, Ayles H, Godfrey-Faussett P, Beyers N, Cohen T. High burden of prevalent tuberculosis among previously treated people in Southern Africa suggests potential for targeted control interventions. Eur Respir J. 2016;48(4):1227–1230. doi: 10.1183/13993003.00716-2016 - DOI - PMC - PubMed
    1. Cudahy PGT. Risk factors for recurrent tuberculosis after successful treatment in a high burden setting: a cohort study. Published online 2020:8. - PMC - PubMed
    1. Organization WH. Treatment of Tuberculosis: Guidelines. World Health Organization; 2010. - PubMed

Publication types

LinkOut - more resources