. 2024 May 11;15(1):3994.
doi: 10.1038/s41467-024-48467-y.

Structural basis of human NOX5 activation

Affiliations

Structural basis of human NOX5 activation

Chenxi Cui et al. Nat Commun. .

Abstract

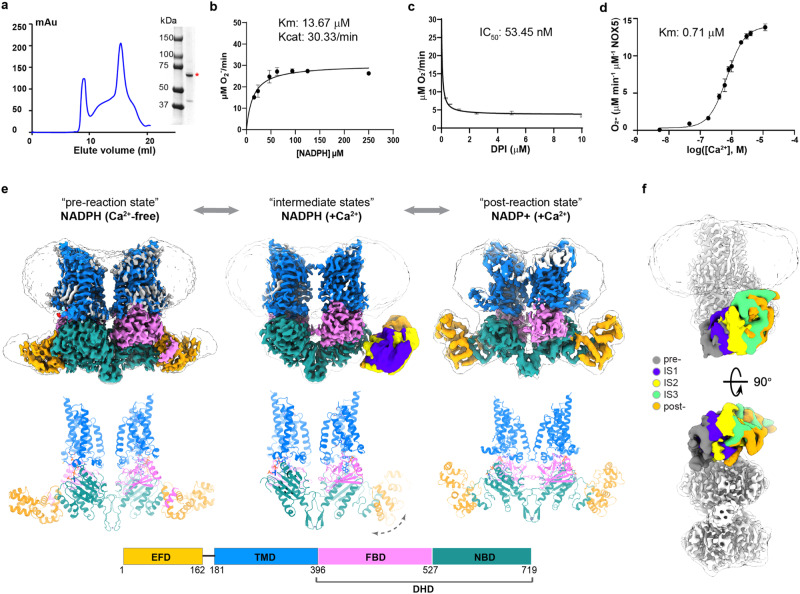
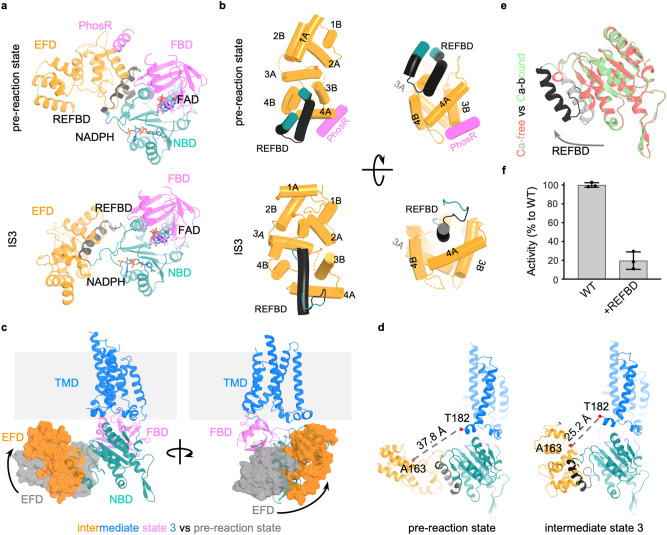
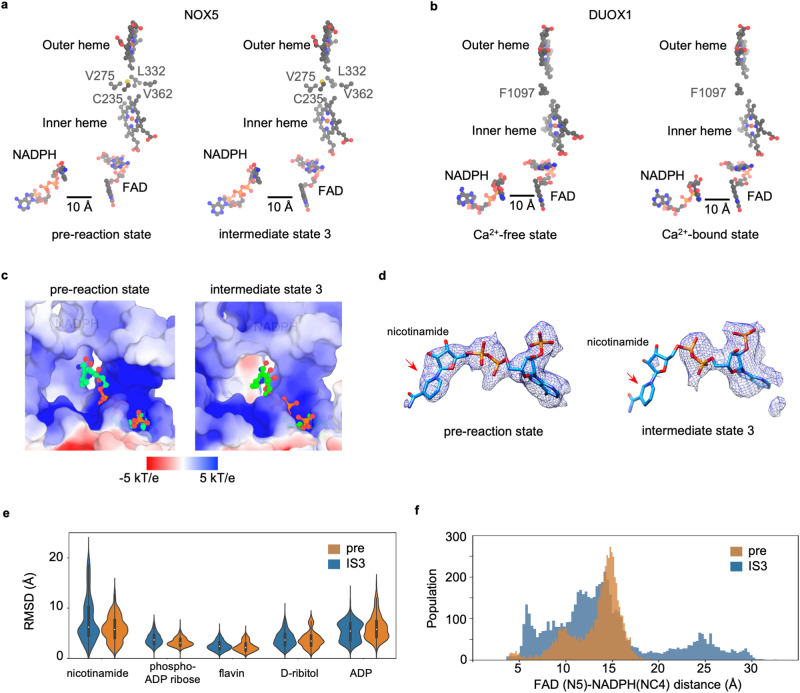
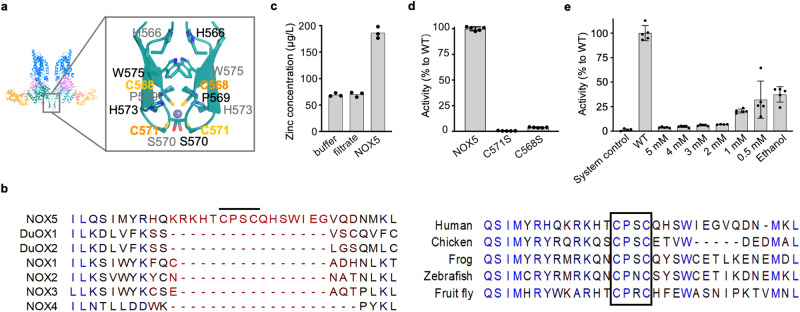
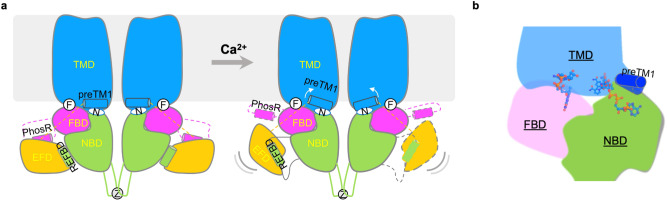
NADPH oxidase 5 (NOX5) catalyzes the production of superoxide free radicals and regulates physiological processes from sperm motility to cardiac rhythm. Overexpression of NOX5 leads to cancers, diabetes, and cardiovascular diseases. NOX5 is activated by intracellular calcium signaling, but the underlying molecular mechanism of which - in particular, how calcium triggers electron transfer from NADPH to FAD - is still unclear. Here we capture motions of full-length human NOX5 upon calcium binding using single-particle cryogenic electron microscopy (cryo-EM). By combining biochemistry, mutagenesis analyses, and molecular dynamics (MD) simulations, we decode the molecular basis of NOX5 activation and electron transfer. We find that calcium binding to the EF-hand domain increases NADPH dynamics, permitting electron transfer between NADPH and FAD and superoxide production. Our structural findings also uncover a zinc-binding motif that is important for NOX5 stability and enzymatic activity, revealing modulation mechanisms of reactive oxygen species (ROS) production.


Conflict of interest statement

The authors declare no competing interests.

Figures

Fig. 1
Fig. 1. Structural study of NOX5 in the pre-reaction, intermediate, and post-reaction states.
a Purification of human NOX5 in the Ca2+-free condition using a Superose 6 increase column. SDS-PAGE shows the purified full-length human NOX5 with the peak fractions combined. This purification was repeated independently with similar results more than 3 times. Source data are provided as a Source Data file. b Enzymatic activity of NOX5 measured by WST-1 assay. Y-axis is the O2- generation rate (μM/min), x-axis is the concentration of NADPH (μM). Data are shown (average +/-SD) with n = 5 biologically independent samples. Source data are provided as a Source Data file. c Activity inhibition of NOX5 by DPI. Y-axis is the O2- generation rate (μM/min), x-axis is the concentration of DPI (μM). Data are shown (average +/-SD) with n = 3 biologically independent samples. Source data are provided as a Source Data file. d Ca2+-dependent activation of NOX5. Y-axis is the O2- generation rate (μM/min/μM (NOX5)), x-axis is the log value of Ca2+ concentration (M). Data are shown as means ± standard deviations (n = 5). Source data are provided as a Source Data file. e Top: structures of NOX5 in the pre-reaction (EGTA + NADPH), intermediate (Ca2+ + NADPH) and post-reaction (Ca2+ + NADP + ) states. Bottom: domain scheme of NOX5. EFD: EF-hand domain; TMD: transmembrane domain; FBD: FAD-binding domain; NBD: NADPH-binding domain; DHD: dehydrogenase domain. TMD, FBD and NBD are colored in blue, pink, and dark green, respectively. The same color scheme is used unless otherwise noted. In the intermediate states, EFD are colored in violet, yellow and orange, respectively. FBD and NBD form the dehydrogenase domain (DHD). f The different conformations of EFD in two views (side and bottom). Top and bottom panel represent side and bottom view, respectively. Here, the catalytic modules of different states from Fig. 1e are aligned to the consensus map of the intermediate state (white). Micelles are shown to indicate the membrane position, and only the consensus map of the intermediate state are shown for clarity. Different conformations of EFD are colored in dark gray (pre-reaction), violet (IS1), yellow (IS2), orange (IS3) and green (post-reaction). IS1-3 indicate intermediate state 1-3. All EFD are low pass filtered to 12 Å for comparison between different states.
Fig. 2
Fig. 2. Conformational changes of EFD.
a Conformational differences between pre-reaction state and intermediate state 3 in the cytosolic part of NOX5. b Conformational changes within EFD. The four EF hands are labeled with 1 A, 1B to 4 A, 4B. REFBD and PhosR segments are labeled. c The movement of EFD between intermediate state 3 and pre-reaction state. EFD color in orange and gray, respectively, in the intermediate state 3 and pre-reaction state. d Distance change between C-terminal of EFD and preTM1 in pre-reaction state and intermediate state 3. The REFBD motif is colored in black. e The movement of REFBD helix upon Ca2+ binding. f REFBD inhibits the activity of NOX5. Y-axis is the relative activity compared with NOX5 wild type. x-axis indicates the NOX5 wild type and the NOX5 wild type incubated with REFBD. Data are shown (average +/-SD) with n = 3 biologically independent samples. Source data are provided as a Source Data file.
Fig. 3
Fig. 3. Activation of human NOX5.
Electron transfer pathway in human NOX5 (a) and DUOX1 (b) before and after Ca2+ activation. Side chains of residues between two hemes are shown. c Electrostatic representation of the NOX5 NADPH binding pockets for pre-reaction state and intermediate state 3. d Cryo-EM density of NADPH in pre-reaction state and intermediate state 3. Nicotinamide group is indicated with red arrow. e The RMSD of chemical groups from NADPH and FAD in pre-reaction state and intermediate state 3. For pre-reaction state, the minima, maxima, centre, 25% percentile and 75% percentile of nicotinamide group are 0.03, 15.07, 5.77, 4.13 and 7.58, respectively. The minima, maxima, centre, 25% percentile and 75% percentile of phosphor-ADP ribose group are 0.03, 7.44, 3.10, 2.62 and 3.81, respectively. The minima, maxima, centre, 25% percentile and 75% percentile of flavin group are 0.04, 6.13, 2.17, 1.65 and 2.93, respectively. The minima, maxima, centre, 25% percentile and 75% percentile of D-ribitol group are 0.03, 8.96, 3.49, 2.60 and 4.49, respectively. The minima, maxima, centre, 25% percentile and 75% percentile of ADP group are 0.04, 15.86, 5.79, 4.32 and 7.41, respectively. For intermediate state 3, the minima, maxima, centre, 25% percentile and 75% percentile of nicotinamide group are 0.00, 22.51, 6.27, 4.58 and 10.20, respectively. The minima, maxima, centre, 25% percentile and 75% percentile of phosphor-ADP ribose group are 0.00, 8.23, 3.70, 2.95 and 4.62, respectively. The minima, maxima, centre, 25% percentile and 75% percentile of flavin group are 0.00, 6.54, 2.41, 1.86 and 3.11, respectively. The minima, maxima, centre, 25% percentile and 75% percentile of D-ribitol group are 0.00, 10.41, 3.66, 2.70 and 4.81, respectively. The minima, maxima, centre, 25% percentile and 75% percentile of ADP group are 0.00, 13.74, 5.47, 3.70 and 6.95, respectively. The bar covers 25% and 75% of the data. All data are plotted on the violin plot. Pre and IS3 represent pre-reaction state and intermediate state 3, respectively. Data in all triplicates are combined to a single histogram. f Distance distribution between FAD and NADPH in pre-reaction state and intermediate state 3. Pre and IS3 represent pre-reaction state and intermediate state 3, respectively. Data in all triplicates are combined to a single histogram.
Fig. 4
Fig. 4. The putative zinc binding site at the dimer interface.
a Structural details of the zinc binding site. b Sequence alignment of the CXXC-containing insertion between NOX5 paralogs and orthologs. The CXXC motif is indicated with black line and black box in left and right panel, respectively. c ICP-MS shows the presence of Zinc ions in NOX5. In x-axis: buffer indicates NOX5 sample buffer (20 mM Tris, 200 mM NaCl, 0.05% Digitonin); filtrate indicates the buffer passed through the filter device during NOX5 concentration; NOX5 is the experimental group. Data are shown with n = 3 technical repeats. Source data are provided as a Source Data file. d Relative activity of C571S and C568S to wild-type NOX5. Y-axis indicates the relative activity compared with NOX5 wild type. Data are shown (average +/-SD) with n = 5 biologically independent samples. Source data are provided as a Source Data file. e Dose-dependent inhibition of NOX5 by TPEN. Y-axis indicates the relative activity compared with NOX5 wild type. Data are shown with (average +/-SD) n = 5 biologically independent samples. Data are processed with GraphPad Prism (Version 10.1.1). We performed Grubbs’ test (also known as extreme studentized deviate, ESD), to determine the outliers. We excluded one data point in “2 mM TPEN” group, which is a significant outliner (P < 0.05) based on Grubbs’ test. Source data are provided as a Source Data file.
Fig. 5
Fig. 5. Working model of NOX5 activation.
a Conformational changes between pre-reaction and intermediate states of NOX5. The movement and flexibility of the EFD domain are illustrated. The upward rotation of preTM1 is indicated by white arrows. F in the white cycle stands for FAD, N in the white oval stands for NADPH, and Z stands for zinc. b The active site of NOX5 with flexible NADPH triggers electron transfer upon activation.

References

    1. Devasagayam TP, et al. Free radicals and antioxidants in human health: current status and future prospects. J Assoc. Physicians India. 2004;52:794–804. - PubMed
    1. Touyz RM, Anagnostopoulou A, Rios F, Montezano AC, Camargo LL. NOX5: molecular biology and pathophysiology. Exp. Physiol. 2019;104:605–616. doi: 10.1113/EP086204. - DOI - PMC - PubMed
    1. Bánfi B, et al. A Ca2+-activated NADPH oxidase in testis, spleen, and lymph nodes. J. Biol. Chem. 2001;276:37594–37601. doi: 10.1074/jbc.M103034200. - DOI - PubMed
    1. Bedard K, Jaquet V, Krause K-H. NOX5: from basic biology to signaling and disease. Free Radic. Biol. Med. 2012;52:725–734. doi: 10.1016/j.freeradbiomed.2011.11.023. - DOI - PubMed
    1. Accetta R, et al. Reactive oxygen species derived from NOX3 and NOX5 drive differentiation of human oligodendrocytes. Front. Cell. Neurosci. 2016;10:146. doi: 10.3389/fncel.2016.00146. - DOI - PMC - PubMed

Publication types

LinkOut - more resources