. 2024 Nov;29(11):3364-3380.
doi: 10.1038/s41380-024-02586-6. Epub 2024 May 11.

Reduction of APOE accounts for neurobehavioral deficits in fetal alcohol spectrum disorders

Affiliations

Reduction of APOE accounts for neurobehavioral deficits in fetal alcohol spectrum disorders

Hye M Hwang et al. Mol Psychiatry. 2024 Nov.

Abstract

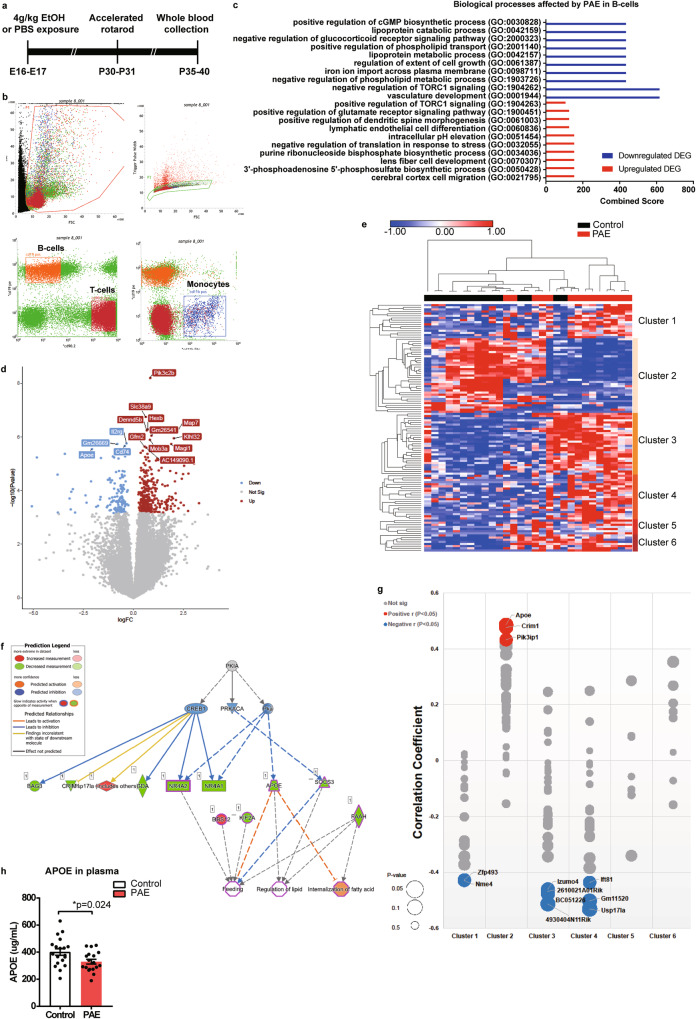
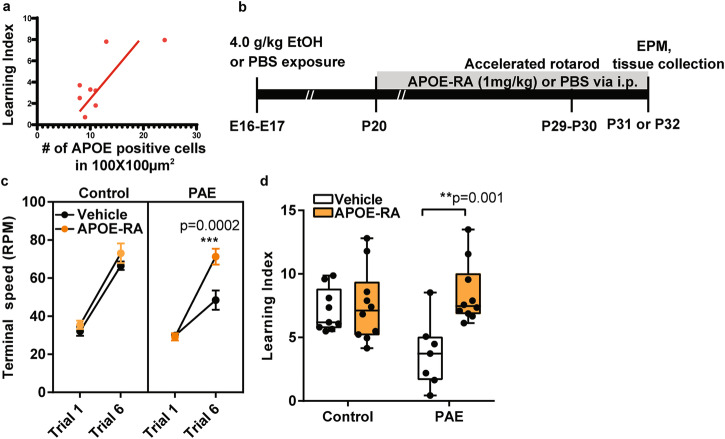
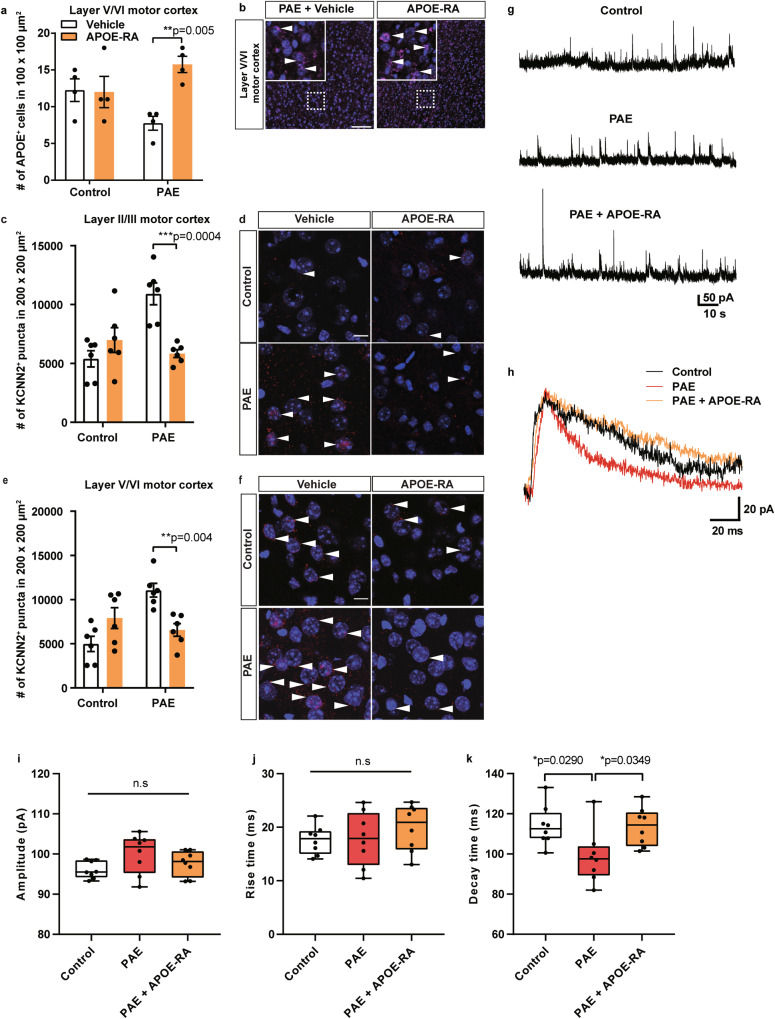
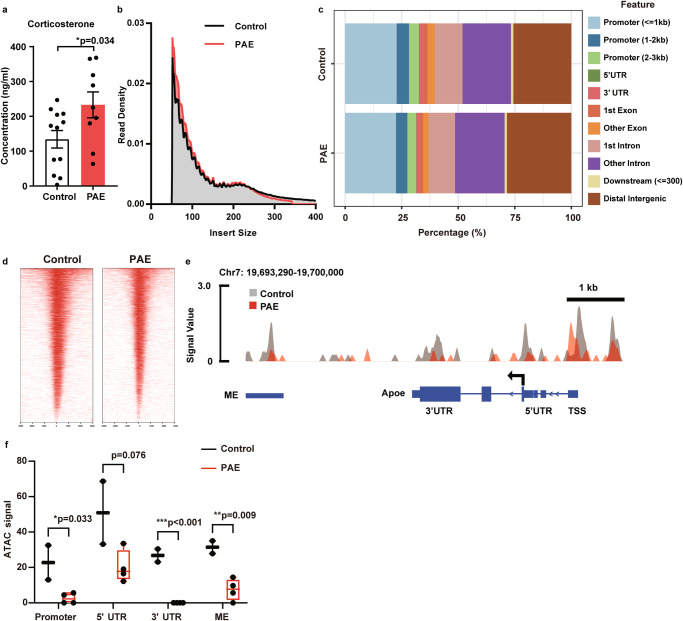
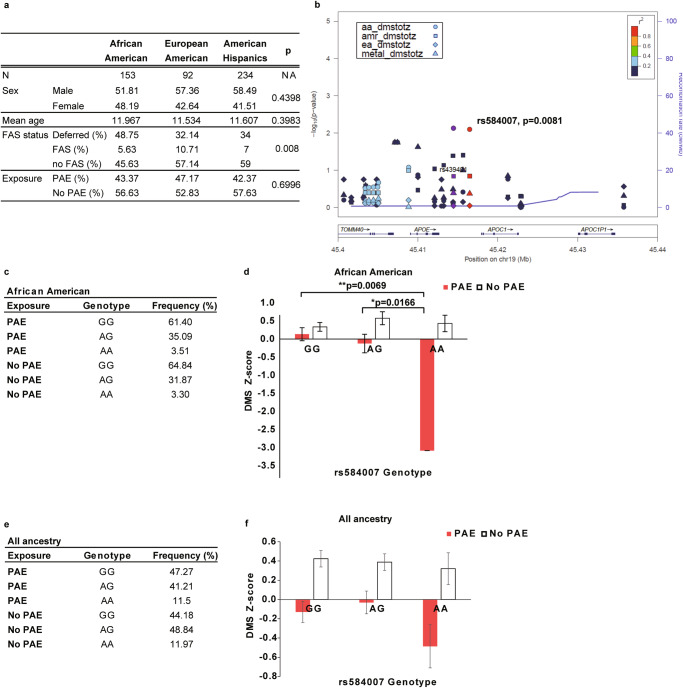
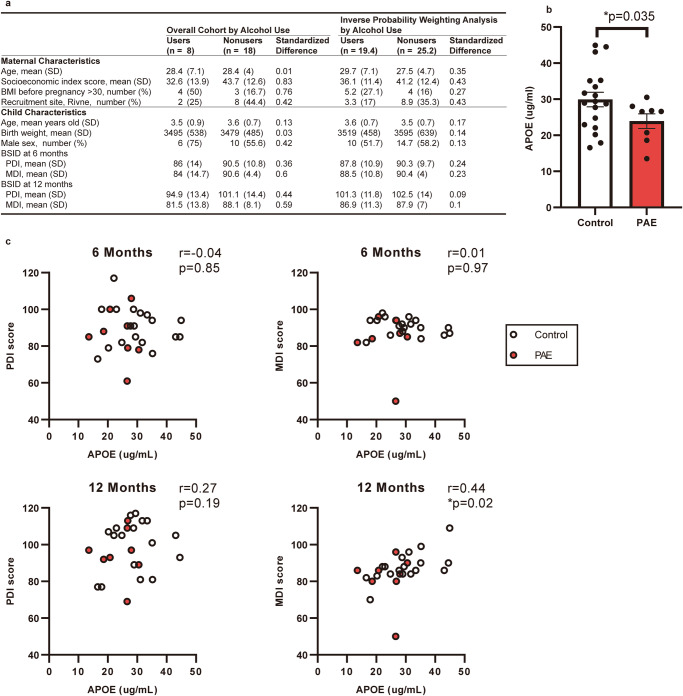
A hallmark of fetal alcohol spectrum disorders (FASD) is neurobehavioral deficits that still do not have effective treatment. Here, we present that reduction of Apolipoprotein E (APOE) is critically involved in neurobehavioral deficits in FASD. We show that prenatal alcohol exposure (PAE) changes chromatin accessibility of Apoe locus, and causes reduction of APOE levels in both the brain and peripheral blood in postnatal mice. Of note, postnatal administration of an APOE receptor agonist (APOE-RA) mitigates motor learning deficits and anxiety in those mice. Several molecular and electrophysiological properties essential for learning, which are altered by PAE, are restored by APOE-RA. Our human genome-wide association study further reveals that the interaction of PAE and a single nucleotide polymorphism in the APOE enhancer which chromatin is closed by PAE in mice is associated with lower scores in the delayed matching-to-sample task in children. APOE in the plasma is also reduced in PAE children, and the reduced level is associated with their lower cognitive performance. These findings suggest that controlling the APOE level can serve as an effective treatment for neurobehavioral deficits in FASD.


Conflict of interest statement

The authors declare no competing interests.

Figures

Fig. 1
Fig. 1. PAE reduces APOE expression in PBMCs.
a Schematic of PBMC RNA profiling following accelerated rotarod test. b A representative result of FACSorting of PBMCs collected from control animals at P35. PBMCs were labeled with CD11b, CD19, and CD90.2, and sequentially sorted based on the cell size (forward scatter [FSC] versus side scatter [SSC]) and singlets (FSC vs. trigger pulse width). Then cells were further divided into B-cells (CD19+/CD90.2−), T-cells (CD90.2+/CD19−), and monocytes (CD11+/CD19−) indicated by orange, red, and blue boxes, respectively. c Top 10 enriched gene ontologies (GOs) with Combined Scores (see “Materials and methods”) in downregulated (blue) and upregulated (red) differentially expressed genes (DEGs) by PAE in B-cells. d Volcano plot shows the DEGs by PAE in B-cells. Top 15 DEGs are labeled with their gene symbols. Blue and red indicate downregulated and upregulated genes, respectively. e Heatmap of hierarchical K-means clustering shows 6 distinctive clusters of DEGs by PAE in B-cells. Gene names in each cluster are shown in Supplementary Table 2. DEGs in cluster 2 contains lipid metabolism-related GOs (Supplementary Fig. 1c). f Result of IPA on the genes in cluster 2. Regulator effects network overlaid with top diseases and functions shows that decreased Apoe expression is associated with other genes that have reduced expression by PAE and fall in the same pathways. g Bubble plot of Pearson’s correlation analysis between the gene expression level and learning index of animals (control: n = 15, PAE: n = 14). Red and blue bubbles indicate significant (P < 0.05) positive and negative correlations, respectively. Grey bubbles indicate non-significant (P ≧ 0.05) correlations. The size of the circle corresponds to the p-value. h PAE mice show significantly lower levels of plasma APOE than control mice (control: n = 19; PAE: n = 18). *P = 0.024 by two-tailed Student’s t-test. Data represent mean ± s.e.m.
Fig. 2
Fig. 2. APOE-RA improves motor learning in PAE mice.
a Pearson’s correlation analysis reveals a positive correlation (R2 = 0.558, P = 0.0166) between the motor learning index and the number of APOE positive cells in the motor cortex in PAE mice (Supplementary Fig. 3). Each dot represents an individual animal (n = 8). Solid line indicates the best fit line. b Schematic shows a timeline of the APOE-RA treatment and behavioral tests. c PAE mice treated daily with APOE-RA for 10 days show significantly improved terminal speed in trial 6 in accelerated rotarod test compared to vehicle-treated PAE mice (control+vehicle: n = 9; control+APOE-RA: n = 10; PAE+vehicle: n = 7; PAE + APOE-RA: n = 10). ***P < 0.001 by two-way ANOVA with simple main effect test. Data represent mean ± s.e.m. d Postnatal APOE-RA treatment significantly improves motor learning index in PAE mice (control+ vehicle: n = 9; control+APOE-RA: n = 10; PAE+vehicle: n = 7; PAE + APOE-RA: n = 10). Box plot represents 25th, median, and 75th percentile. Whiskers extended to min and max values. **P < 0.01 by two-way ANOVA with simple main effect test. Data represent mean ± s.e.m.
Fig. 3
Fig. 3. Postnatal APOE-RA treatment alleviated the decreased endogenous APOE level, excessive KCNN2, and shorter decay time of NMDAR-mediated sEPSC in the motor cortex in PAE mice.
a APOE-RA treatment increases the number of APOE-positive cells that is reduced by PAE in layer V/VI of the motor cortex (n = 4 per group). **P < 0.01 by two-way ANOVA with simple main effect test. Data represent mean ± s.e.m. b Representative images of APOE (magenta, arrowheads) and DAPI (blue) staining in layer V/VI of the motor cortex in PAE mice treated with vehicle or APOE-RA. Dotted boxes indicate the region shown at higher magnification in the inset. The number of KCNN2 puncta is significantly decreased in layer II/III (c) and layer V/VI of the motor cortex (e) in PAE mice after the APOE-RA treatment compared to vehicle treatment (n = 6 per group). **P < 0.01, ***P < 0.001 by two-way ANOVA with simple main effect test. Data represent mean ± s.e.m. d, f Representative images of KCNN2 (red, arrowheads) and DAPI (blue) staining. Scale bars = 10 µm. g Examples of NMDAR-mediated sEPSCs recorded under the voltage-clamp condition at a holding potential of +50 mV in pyramidal neurons of layer V/VI in the indicated experimental groups. h NMDAR-mediated sEPSCs averaged from 5 events in control, PAE, and PAE + APOE-RA mice. i–k No significant differences are observed in the amplitude (i) and rise time (j) between the groups. PAE group shows a significantly shorter decay time than control and APOE-RA treated PAE group (k). Box plot represents the 25th, median, and 75th percentile. n = 8 cells per group. Whiskers extend to min and max values. *P < 0.05 by One-way ANOVA with Tukey’s post hoc test.
Fig. 4
Fig. 4. PAE decreases chromatin accessibility in the brain.
a PAE mice show a significantly increased corticosterone concentration in the plasma compared to control mice (control: n = 12, PAE: n = 9). *P < 0.05 by two-tailed Student’s t-test. Data represent mean ± s.e.m. b Distribution of ATAC-seq fragment lengths shows enrichment under 100 bp and around 200 bp, indicating nucleosome-free and mono-nucleosome-bound fragments, respectively. c Peak annotation graphs show that the proportion of aligned genomic features is similar between control and PAE samples. d Heatmap shows the enrichment of ATAC reads around the transcription start site (TSS) (−1,000- + 1,000) in both control and PAE mouse samples. ATAC-seq signal in regulatory regions of the Apoe (e) and the quantification (f) show significantly reduced chromatin accessibility in the promoter, 3’ untranslated region (UTR), and multienhancer (ME) in the PAE group. 5’ UTR shows a trend of decrease in the PAE group (control: n = 2, PAE: n = 4). *P < 0.05, **P < 0.01,***P < 0.001 by two-tailed Student’s t-test. The box plot represents the 25th, median, and 75th percentile. Whiskers extend to the min and max values. Each dot represents an individual animal.
Fig. 5
Fig. 5. The SNP rs584007 in an ApoE enhancer is associated with DMS Z-score in PAE children.
a Table shows demographic information on study subjects. No significant differences are found in the gender ratio and mean age between the three ancestry groups by Chi-square test and one-way ANOVA, respectively. A significant difference in fetal alcohol syndrome (FAS) diagnosis, but not in the number of PAE individuals, is observed between the ancestry groups by Chi-square test. NA = not applicable. b Regional plot between 45.4 and 45.44 Mb on chromosome 19 around the APOE locus in the African (aa), American Hispanic (amr), and European (ea) ancestries and meta-analysis (metal) of GWAS with DMS Z-score. The interaction between SNP and PAE shows a significant association with the DMS z-score in the group of African American ancestry. c Table indicates the frequency of individuals with the rs584007 genotype in the African American ancestry group. d In the group of African American ancestry, AA individuals prenatally exposed to alcohol have significantly lower DMS Z-scores compared to individuals with other genotypes with or without exposure to alcohol. *P < 0.05, **P < 0.01 by two-way ANOVA with simple main effect test. Data represent mean ± s.e.m. e Table indicates the frequency of individuals with the rs584007 genotype in all ancestry groups. f When all ancestry groups are combined, no significant interaction between PAE and SNP is observed by two-way ANOVA (P = 0.3769). A significant alcohol effect is observed (P < 0.0001). There is a marginal difference in the DMS Z-score between AA and other genotypes in alcohol exposed groups (AA vs GG P = 0.09937; AA vs AG P = 0.0991 by Tukey’s post hoc test). Data represent mean ± s.e.m.
Fig. 6
Fig. 6. APOE in the plasma is reduced in PAE patients.
a Baseline characteristics of mothers who drank alcohol during pregnancy (users) and who did not (nonusers) and their children. Right columns show the results of Inverse probability weighing analysis. b Graph shows that the plasma APOE level at age 2–4 years old is significantly lower in PAE children. *P < 0.05 by Student’s t-test. Data represent mean ± s.e.m. c Pearson’s correlation analysis shows positive correlations between the plasma APOE level and the BSID-II MDI score at 12 months old, but not at 6 months old.

References

    1. Mattson SN, Bernes GA, Doyle LR. Fetal alcohol spectrum disorders: a review of the neurobehavioral deficits associated with prenatal alcohol exposure. Alcohol Clin Exp Res. 2019;43:1046–62. - PMC - PubMed
    1. May PA, Chambers CD, Kalberg WO, Zellner J, Feldman H, Buckley D, et al. Prevalence of fetal alcohol spectrum disorders in 4 US Communities. JAMA. 2018;319:474. - PMC - PubMed
    1. Portales-Casamar E, Lussier AA, Jones MJ, MacIsaac JL, Edgar RD, Mah SM, et al. DNA methylation signature of human fetal alcohol spectrum disorder. Epigenetics Chromatin. 2016;9:25. - PMC - PubMed
    1. Popova S, Lange S, Probst C, Gmel G, Rehm J. Estimation of national, regional, and global prevalence of alcohol use during pregnancy and fetal alcohol syndrome: a systematic review and meta-analysis. Lancet Glob Health. 2017;5:e290–e299. - PubMed
    1. Abel EL. An update on incidence of FAS: FAS is not an equal opportunity birth defect. Neurotoxicol Teratol. 1995;17:437–43. - PubMed

Grants and funding