. 2024 Jul:119:818-835.
doi: 10.1016/j.bbi.2024.05.004. Epub 2024 May 10.

CCR2+ monocytes promote white matter injury and cognitive dysfunction after myocardial infarction

Affiliations

CCR2+ monocytes promote white matter injury and cognitive dysfunction after myocardial infarction

Edward B Thorp et al. Brain Behav Immun. 2024 Jul.

Abstract

Survivors of myocardial infarction are at increased risk for vascular dementia. Neuroinflammation has been implicated in the pathogenesis of vascular dementia, yet little is known about the cellular and molecular mediators of neuroinflammation after myocardial infarction. Using a mouse model of myocardial infarction coupled with flow cytometric analyses and immunohistochemistry, we discovered increased monocyte abundance in the brain after myocardial infarction, which was associated with increases in brain-resident perivascular macrophages and microglia. Myeloid cell recruitment and activation was also observed in post-mortem brains of humans that died after myocardial infarction. Spatial and single cell transcriptomic profiling of brain-resident myeloid cells after experimental myocardial infarction revealed increased expression of monocyte chemoattractant proteins. In parallel, myocardial infarction increased crosstalk between brain-resident myeloid cells and oligodendrocytes, leading to neuroinflammation, white matter injury, and cognitive dysfunction. Inhibition of monocyte recruitment preserved white matter integrity and cognitive function, linking monocytes to neurodegeneration after myocardial infarction. Together, these preclinical and clinical results demonstrate that monocyte infiltration into the brain after myocardial infarction initiate neuropathological events that lead to vascular dementia.

Keywords: Cognitive; Infarction; Monocyte; Myocardial.


Conflict of interest statement

Declaration of competing interest The authors declare that they have no known competing financial interests or personal relationships that could have appeared to influence the work reported in this paper.

Figures
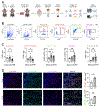
Figure 1.
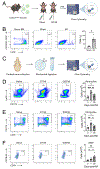
Figure 1.. Abundance of CCR2+ monocytes and macrophages is increased in the brain after experimental MI.
A Experimental design for analyzing myeloid cells in the brain after permanent occlusion MI induced by surgical ligation of the left anterior descending (LAD) coronary artery. B Flow cytometry gating strategy for myeloid cells in the brain. C Total abundance of different myeloid cell subsets within the brain after MI. n = 7 mice/group pooled from more than 3 independent experiments. *P < 0.05; **P < 0.01; ***P < 0.001 by one-way ANOVA followed by Tukey test. D Histological analyses of CCR2+ monocytes and CX3CR1+ brain-resident myeloid cells in the brain 7 days after MI compared to sham controls. Scale bar, 50 μm. Arrows, colocalization of CCR2+ monocytes with CD31+ endothelial cells. n = 3 mice/group pooled from 2 independent experiments. *P < 0.05; **P < 0.01 by two-tailed, unpaired t test. All data are presented as mean ± SEM.
Figure 2.
Figure 2.. Monocytes are mobilized from the peripheral and local bone marrow reservoirs after MI.
A Experimental design for tracking peripheral monocyte recruitment to the brain after MI. B Total abundance of transferred CX3CR1-GFP monocytes in the brains of recipient infarcted mice compared to sham controls. n = 3-4 mice per group pooled from 2 independent experiments *P<0.05 by unpaired t test. C Experimental design for measuring cells within skull bone marrow after MI. Total abundance of D neutrophils, E CCR2+ monocytes, and F granulocyte-monocyte progenitors (GMP) within skull bone marrow after MI. n = 4-5 mice/group pooled from more than 3 independent experiments. *P < 0.05; **P < 0.01; ***P < 0.001 by one-way ANOVA followed by Tukey test. All data are presented as mean ± SEM.
Figure 3.
Figure 3.. Spatial transcriptomics reveals inflammatory activation of myeloid cells and endothelial dysfunction after MI.
A Representative images of CCR2+ monocytes, CX3CR1+ brain-resident myeloid cells, or CD31+ endothelial cells in brains from mice 7 days after MI or sham controls used for spatial transcriptomics. Scale bar, 50 μm. Arrows, colocalization of CCR2+ monocytes with CD31+ endothelial cells. Volcano plot of differentially expressed genes in B CX3CR1+, D CCR2+, or F CD31+ cells from the brains of mice after MI compared to sham controls. Pathway enrichment of differentially expressed genes in C CX3CR1+, E CCR2+, or G CD31+ cells from the brains of mice after MI compared to sham controls.
Figure 4.
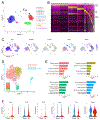
Figure 4.. Single cell RNA sequencing of brains after MI reveals inflammatory activation of perivascular macrophages and microglia.
Mice were subjected to MI or sham surgery and brains were collected 7 days later for single cell transcriptomics. A Identification of 17 unique clusters by uniform manifold approximation and projection (UMAP) in combined groups. B Heatmap of the top 20 most differentially expressed genes within each cluster in combined groups with annotation of myeloid cell marker genes. C Feature plots representing single cell expression of microglia, macrophage, monocyte, and astrocyte marker genes. D Identification of 5 unique clusters of microglia and perivascular macrophages in combined groups with the percent of different clusters present within brains from MI mice or sham controls inset. E Pathway enrichment of differentially expressed genes in microglia and perivascular macrophages after MI compared to sham controls. F Violin plots of cytokine and chemokine expression in perivascular macrophages after MI compared to sham controls.
Figure 5.
Figure 5.. CCR2 monocytes are required for perivascular macrophage expansion and microglia activation after MI.
Total abundance of A CCR2+ monocytes, B neutrophils, C perivascular macrophages, and D MHCII+ microglia after MI. n = 6-7 mice/group pooled from 3 independent experiments. *P < 0.05; **P < 0.01; ***P < 0.001 by two-way ANOVA followed by Tukey’s test. E Total abundance of CD206+ perivascular macrophages (arrows) within the cortex of mice 28 days after MI compared to sham controls. Scale bar, 50 μm. n = 6 mice/group pooled from 2 independent experiments. *P < 0.05; **P < 0.01; ***P < 0.001 by two-way ANOVA followed by Tukey’s test. All data represent mean ± SEM.
Figure 6.
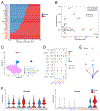
Figure 6.. Sema4D signaling is increased between myeloid cells and oligodendrocytes after MI.
A Relative information flow 7 days after MI compared to sham controls. B Changes in myeloid cell signaling after MI compared to controls. C UMAP of microglia, perivascular macrophages, and oligodendrocytes from combined conditions. D Signaling pathways increased between myeloid cells and oligodendrocytes after MI. E Cross signaling between Sema4d and Plxnnb3 after MI compared to sham controls. F Violin plots of Sema4d and Plxnb3 in myeloid cells and oligodendrocytes after MI compared to sham controls.
Figure 7.
Figure 7.. CCR2 monocytes are required for white matter injury and cognitive dysfunction after MI.
A Total abundance of oligodendrocytes within the corpus callosum of mice 28 days after MI compared to sham controls. Scale bar, 50 μm. n = 6 mice/group pooled from 2 independent experiments. *P < 0.05; **P < 0.01; ***P < 0.001 by two-way ANOVA followed by Tukey’s test. B Total abundance of oligodendrocyte precursor cells within the cortex of mice 28 days after MI compared to sham controls. Scale bar, 50 μm. n = 6 mice/group pooled from 2 independent experiments. ns, not significant by two-way ANOVA followed by Tukey’s test. Percent time frozen during the C contextual memory test or D auditory cued memory test. n = 6 mice/group pooled from 2 independent experiments. **P < 0.01 by two-way ANOVA followed by Tukey’s test. E Percent time with the novel object during the novel object recognition test. n = 6 mice/group pooled from 2 independent experiments. ***P < 0.001 by two-way ANOVA followed by Tukey’s test. All data represent mean ± SEM.
Figure 8.
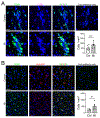
Figure 8.. Myeloid cell recruitment and activation are increased in human brains after MI.
Histological analyses of A CD68+CCR2+ or B CD68+HLA-DR+ myeloid cells (arrows) in frontal watershed autopsy samples collected from patients with a history of MI. Patients with non-MI deaths and no history of neurodegenerative disease were used as controls. Scale bar is 20 μm for A and 50 μm for B. n = 6 patients per group *P<0.05 by two-tailed, unpaired t test. All data represent mean ± SEM.

References

    1. Akhter N, Hasan A, Shenouda S, Wilson A, Kochumon S, AN S, Tuomilehto J, Sindhu S, Ahmad R, 2018. TLR4/MyD88 -mediated CCL2 production by lipopolysaccharide (endotoxin): Implications for metabolic inflammation. Journal of Diabetes & Metabolic Disorders 17, 77–84. - PMC - PubMed
    1. Anzai A, Choi JL, He S, Fenn AM, Nairz M, Rattik S, McAlpine CS, Mindur JE, Chan CT, Iwamoto Y, Tricot B, Wojtkiewicz GR, Weissleder R, Libby P, Nahrendorf M, Stone JR, Becher B, Swirski FK, 2017. The infarcted myocardium solicits GM-CSF for the detrimental oversupply of inflammatory leukocytes. Journal of Experimental Medicine 214, 3293–3310. - PMC - PubMed
    1. Bliksøen M, Mariero LH, Ohm IK, Haugen F, Yndestad A, Solheim S, Seljeflot I, Ranheim T, Andersen GØ, Aukrust P, Valen G, Vinge LE, 2012. Increased circulating mitochondrial DNA after myocardial infarction. International Journal of Cardiology 158, 132–134. - PubMed
    1. Boring L, Gosling J, Chensue SW, Kunkel SL, Farese RV Jr., Broxmeyer HE, Charo IF, 1997. Impaired monocyte migration and reduced type 1 (Th1) cytokine responses in C-C chemokine receptor 2 knockout mice. The Journal of Clinical Investigation 100, 2552–2561. - PMC - PubMed
    1. Bots ML, Breteler MMB, Hofman A, Grobbee DE, van Swieten JC, van Gijn J, van Swieten JC, de Jong PTVM, 1993. Cerebral white matter lesions and atherosclerosis in the Rotterdam Study. The Lancet 341, 1232–1237. - PubMed

MeSH terms

Substances

LinkOut - more resources