. 2024 Jun;300(6):107362.
doi: 10.1016/j.jbc.2024.107362. Epub 2024 May 10.

Bayesian network models identify cooperative GPCR:G protein interactions that contribute to G protein coupling

Affiliations

Bayesian network models identify cooperative GPCR:G protein interactions that contribute to G protein coupling

Elizaveta Mukhaleva et al. J Biol Chem. 2024 Jun.

Abstract

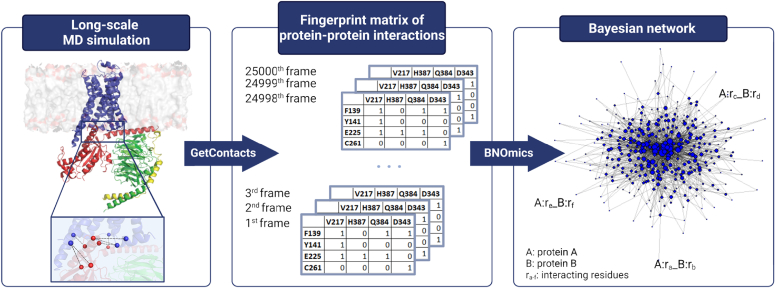
Cooperative interactions in protein-protein interfaces demonstrate the interdependency or the linked network-like behavior and their effect on the coupling of proteins. Cooperative interactions also could cause ripple or allosteric effects at a distance in protein-protein interfaces. Although they are critically important in protein-protein interfaces, it is challenging to determine which amino acid pair interactions are cooperative. In this work, we have used Bayesian network modeling, an interpretable machine learning method, combined with molecular dynamics trajectories to identify the residue pairs that show high cooperativity and their allosteric effect in the interface of G protein-coupled receptor (GPCR) complexes with Gα subunits. Our results reveal six GPCR:Gα contacts that are common to the different Gα subtypes and show strong cooperativity in the formation of interface. Both the C terminus helix5 and the core of the G protein are codependent entities and play an important role in GPCR coupling. We show that a promiscuous GPCR coupling to different Gα subtypes, makes all the GPCR:Gα contacts that are specific to each Gα subtype (Gαs, Gαi, and Gαq). This work underscores the potential of data-driven Bayesian network modeling in elucidating the intricate dependencies and selectivity determinants in GPCR:G protein complexes, offering valuable insights into the dynamic nature of these essential cellular signaling components.

Keywords: Bayesian network; G protein selectivity; GPCR:G protein interaction; GPCRs; Gα protein selectivity; MD simulations and network; cooperativity; machine learning; molecular dynamics; network modeling; protein-protein interactions.


Conflict of interest statement

Conflict of interest The authors declare that they have no conflicts of interest with the contents of this article.

Figures

Figure 1
Figure 1
Example of a Bayesian network. The underlying topology is a directed acyclic graph (DAG), comprising the nodes representing random variables A–G and the edges reflecting direct probabilistic dependencies between the nodes.
Figure 2
Figure 2
Workflow combining MD simulations and Bayesian network models to delineate the GPCR:Gα interface residue contacts that show cooperativity for Gα coupling. The left panel shows the GPCR:Gα interface residue pairs that display direct interaction as calculated from the MD simulation trajectories of each of the GPCR:Gα system using the program “GetContacts” (75). The middle panel shows the stack of fingerprint matrices for the GPCR:Gα residue contacts derived for every MD snapshot. The right panel shows the BN model derived for each GPCR:G protein complex using BNOmics software (43). BN, Bayesian network; GPCR, G protein–coupled receptor; MD, molecular dynamics.
Figure 3
Figure 3
MD simulations expand the repertoire of GPCR:Gα interface interactions.A, general representation of GPCR:G protein complex. The area highlighted by black rectangular is the GPCR:Gα subunit interface that was used in further analysis. B, Venn diagram of GPCR:Gα residue contacts present in the 3D structures (green circle—Gi-coupled receptors: 6D9H, 6G79; red circle—Gs-coupled receptors:3SN6, 6GDG; blue circle—Gq-coupled receptor: 7DFL, 7F6G). C, Venn diagram of persistent GPCR:Gα residue contacts formed during the MD simulation. D, schematic diagram of GPCR and Gα labeling their different structural regions. E, bar plot demonstrating how residue contacts are distributed over GPCR structural elements in the three-dimensional structures and after MD simulations (65). F, stacked plot of the percentage of GPCR:Gα residue interactions observed in the three-dimensional structures and in MD simulations located in different structural regions of the Gα subtypes. GPCR, G protein–coupled receptor; MD, molecular dynamics.
Figure 4
Figure 4
Bayesian network modeling analysis of GPCR:Gα subunit interaction residues and their cooperativity in different Gα subunit subtypes.A, a complete BN model of the GPCR:Gα subunit interaction residues in β2 adrenergic receptor: Gαs complex. Arrow thickness corresponds to the edge strength in the BN. Blue node—polar interaction, gray—nonpolar interaction. B, formula used for calculating the weighted degree that we define as cooperativity of each node in the BN. An illustrative subnetwork from the β2AR-Gs complex centered on the most cooperative node 7.55_G.H5.24. C, radial plot of cooperative interactions and their distribution over GPCR structural elements. Blue—polar interactions in Gq coupled receptors, red—polar interaction in Gs coupled receptors, green—polar interactions in Gi coupled receptors. Gray-hydrophobic interactions in the all the Gα subtypes. D, heatmap of the fraction of polar cooperative interactions each of the Gα structural region forms with each TM helix of the GPCR. Each TM-Gα region fraction was corrected on the number of total interactions made by this Gα subunit region, to account for differences in the sizes of Gα structures. The darker the color, the larger the number of cooperative nodes in the structural region of GPCRs and Gα subunits. Left to right: Gαi coupled, Gαq coupled, and Gαs coupled. Bar plots show the percentage of cooperative interactions formed by the different Gα structural regions. E, heatmap of the fraction of nonpolar cooperative interactions each of the Gα subunit structural region forms with each TM helix of the GPCR. Each TM-Gα subunit region fraction was corrected on the number of total interactions made by this Gα subunit region, to account for differences in the sizes of Gα subunit structures. The darker the color, the larger the number of cooperative nodes in the structural region of GPCRs and Gα subunits. Left to right: Gi coupled, Gq coupled, Gs coupled. Bar plots show the percentage of cooperative interactions formed by the different Gα structural regions. BN, Bayesian network; GPCR, G protein–coupled receptor; TM, transmembrane.
Figure 5
Figure 5
Cooperative residue contacts in GPCR:Gα interface show neighboring and allosteric dependencies on other contacts within the interface.A, schematic representation of neighboring and allosteric dependencies. Nodes (GPCR:Gα residue contact) are represented by oval shapes. Pairwise distance between nodes marked as black dashed line. A node dependency is considered as neighboring if at least one of distances (d1, d2, d3, and d4) is less than 10 Å and allosteric—if all distances (d1 to d4) are larger than 10 Å. B, the Markov neighborhoods (the number of edges connected to a node) of the nodes with connections greater than ten in Gαi-, Gαq-, and Gαs-coupled GPCR complexes (left to right) are shown. Neighboring dependencies are shown as gray bars, allosteric dependencies as hatched bars. C, the structural representation of the Markov neighborhood of the node 7.55_G.H5.24. Cα atoms of residues, making contacts, are shown as spheres. The receptor is represented by gray color, the core of G protein—blue, the tip—red. D, the Markov neighborhood of the most connected node, 7.55_G.H5.24 (light green), of the β2AR-Gαs complex. Light red color corresponds to the contacts made by the H5-tip, light blue color—contacts made by the core of the Gα subunit. The color intensities of the edges are proportional to the edge strength. GPCR, G protein–coupled receptor.
Figure 6
Figure 6
Analysis of Bayesian networks of CCK1coupled to different Gα Subtypes.A, Venn diagram of CCK1:Gα interface residue contacts calculated from the MD simulation trajectories showing the common and Gα subtype specific CCK1:Gα interface contacts. Venn diagram of the cooperative nodes delineated from the BN models (green circle—Gαi1; red circle—Gαs; blue circle—Gαq). B, the structural representation of the six common cooperative contacts between CCK1:Gαq, CCK1:Gαi1, and CCK1:Gαs. Cα atoms of residues, making contacts, are represented as spheres. The receptor is represented by gray color, G protein—blue. The GPCR and G protein residue numbering systems are used to label the residues. C, heatmap of cooperative interactions in the interface of CCK1:Gαq, located in different GPCR and G protein structural regions. The darker the color, the larger the number of cooperative nodes in that structural region of GPCRs and Gα subunit. D, heatmap of cooperative interactions in the interface of CCK1:Gαi1, located in different GPCR and G protein structural regions. E, heatmap of cooperative interactions in the interface of CCK1:Gαs, located in different GPCR and G protein structural regions. F, BN model predictions of cooperative residues for CCK1:Gα protein coupling. Residues 56.C1, 56.C3, 56.C4 are C-terminal ICL3 residues. Numbering starts with the first C-terminal residue S301 as 56.C1. G, mutagenesis combined with BRET experimental data of CCK1:Gα protein coupling from Masuho et al. Black square means mutating this position decreases or increases G protein coupling. H, overlap of the prediction and experimental results. BN, Bayesian network; BRET, bioluminescence resonance energy transfer; CCK1, cholecystokinin 1; GPCR, G protein–coupled receptor; ICL, intracellular loop; MD, molecular dynamics.
Figure 7
Figure 7
Comparison of Bayesian network-based predictions of cooperative nodes to experiments.A, schematic of G protein structural regions. Red stars represent regions identified as selectivity hotspots by Jelinek et al. (68), blue stars represent selectivity hotspots predicted by BN models. Heatmap represents the cooperativity score of proposed selectivity hotspot based on the BN model of H1-Gq complex. B, ΔlogEC50 values measured for the M3-Gαoq chimera complex coupling from Jelinek et al. plotted against cooperativity score of predicted selectivity hotspots by BN modeling. C, ΔlogEC50 values of measuring of H1-Gαoq chimera complex coupling from Jelinek et al. plotted against cooperativity score of selectivity hotspots identified by BN modeling. BN, Bayesian network.

Update of

Similar articles

Cited by

References

    1. Armstrong J.F., Faccenda E., Harding S.D., Pawson A.J., Southan C., Sharman J.L., et al. The IUPHAR/BPS Guide to PHARMACOLOGY in 2020: extending immunopharmacology content and introducing the IUPHAR/MMV Guide to MALARIA PHARMACOLOGY. Nucleic Acids Res. 2020;48:D1006–D1021. - PMC - PubMed
    1. Masuho I., Ostrovskaya O., Kramer G.M., Jones C.D., Xie K., Martemyanov K.A. Distinct profiles of functional discrimination among G proteins determine the actions of G protein-coupled receptors. Sci. Signal. 2015;8:ra123. - PMC - PubMed
    1. Lukasheva V., Devost D., Le Gouill C., Namkung Y., Martin R.D., Longpré J.-M., et al. Signal profiling of the β(1)AR reveals coupling to novel signalling pathways and distinct phenotypic responses mediated by β(1)AR and β(2)AR. Sci. Rep. 2020;10:8779. - PMC - PubMed
    1. Okashah N., Wan Q., Ghosh S., Sandhu M., Inoue A., Vaidehi N., et al. Variable G protein determinants of GPCR coupling selectivity. Proc. Natl. Acad. Sci. U. S. A. 2019;116:12054–12059. - PMC - PubMed
    1. Sandhu M., Cho A., Ma N., Mukhaleva E., Namkung Y., Lee S., et al. Dynamic spatiotemporal determinants modulate GPCR:G protein coupling selectivity and promiscuity. Nat. Commun. 2022;13:7428. - PMC - PubMed

Publication types

MeSH terms

Substances

LinkOut - more resources