. 2024 Jun 3;147(6):2085-2097.
doi: 10.1093/brain/awae055.

Neuropathy target esterase activity defines phenotypes among PNPLA6 disorders

Affiliations

Neuropathy target esterase activity defines phenotypes among PNPLA6 disorders

James Liu et al. Brain. .

Abstract

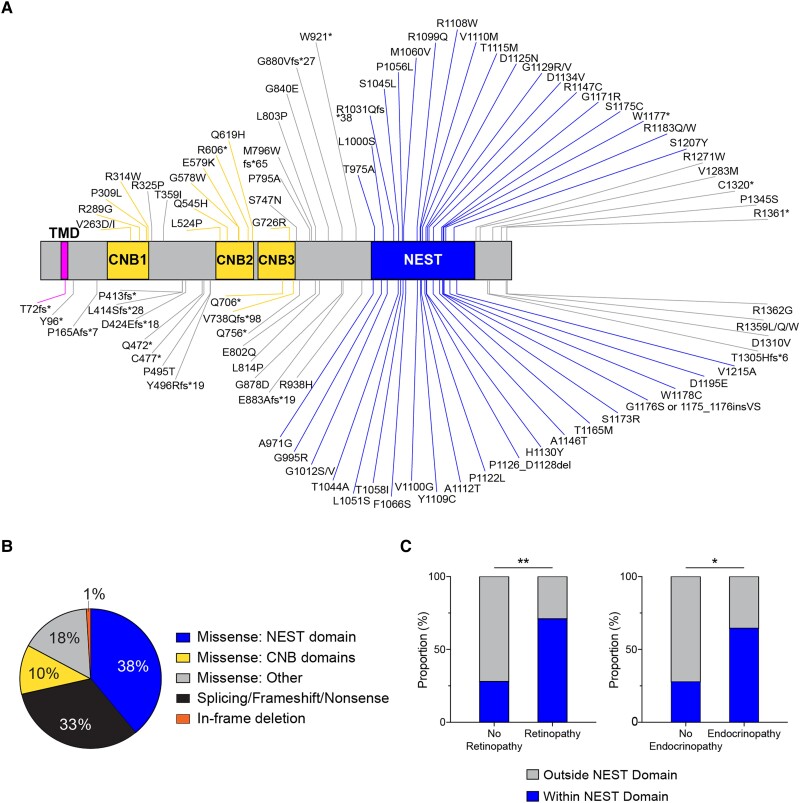
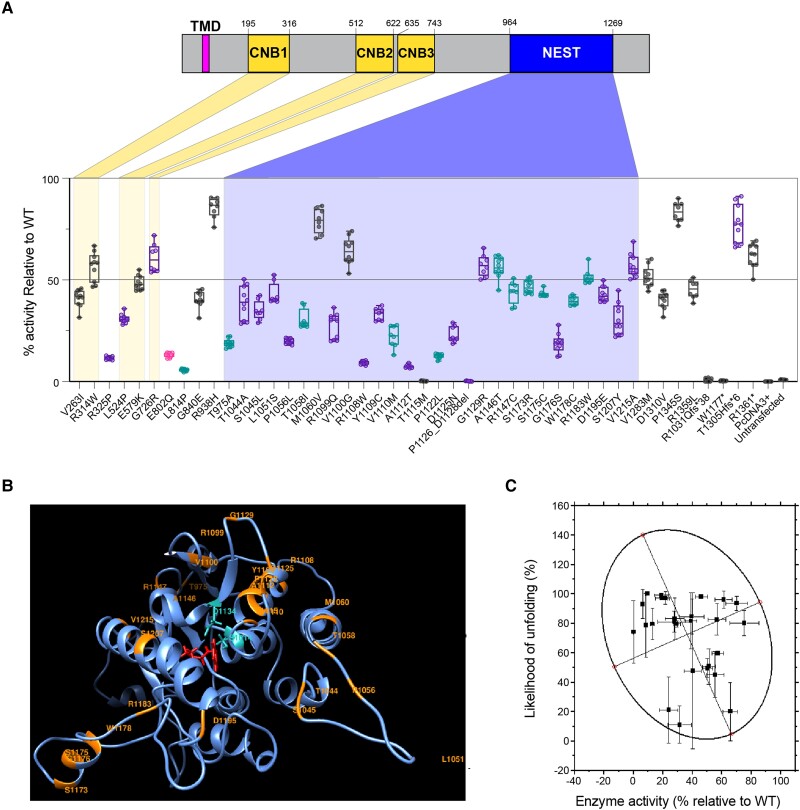
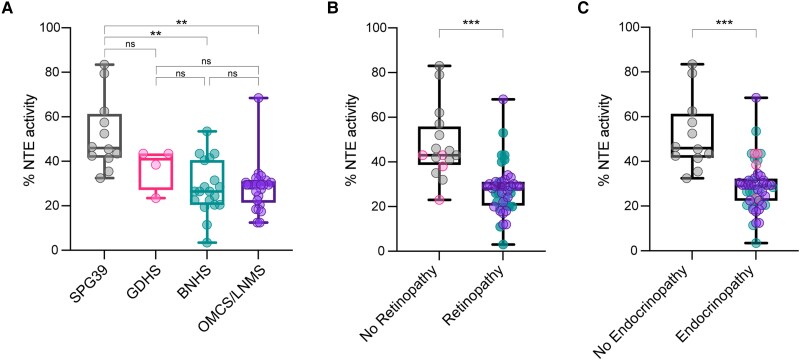
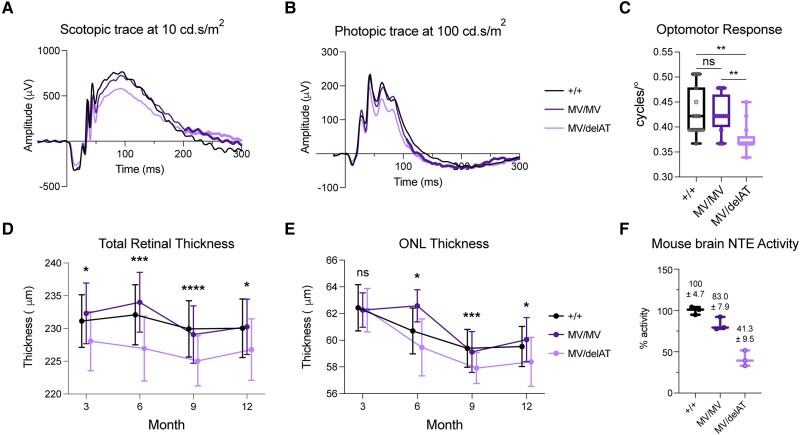
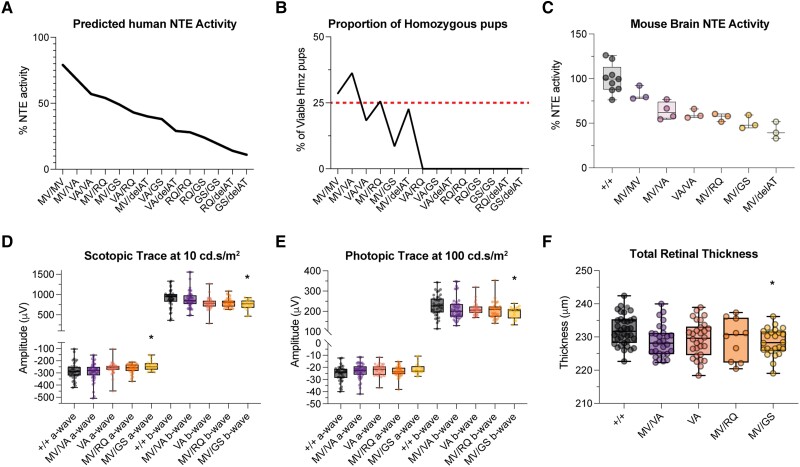
Biallelic pathogenic variants in the PNPLA6 gene cause a broad spectrum of disorders leading to gait disturbance, visual impairment, anterior hypopituitarism and hair anomalies. PNPLA6 encodes neuropathy target esterase (NTE), yet the role of NTE dysfunction on affected tissues in the large spectrum of associated disease remains unclear. We present a systematic evidence-based review of a novel cohort of 23 new patients along with 95 reported individuals with PNPLA6 variants that implicate missense variants as a driver of disease pathogenesis. Measuring esterase activity of 46 disease-associated and 20 common variants observed across PNPLA6-associated clinical diagnoses unambiguously reclassified 36 variants as pathogenic and 10 variants as likely pathogenic, establishing a robust functional assay for classifying PNPLA6 variants of unknown significance. Estimating the overall NTE activity of affected individuals revealed a striking inverse relationship between NTE activity and the presence of retinopathy and endocrinopathy. This phenomenon was recaptured in vivo in an allelic mouse series, where a similar NTE threshold for retinopathy exists. Thus, PNPLA6 disorders, previously considered allelic, are a continuous spectrum of pleiotropic phenotypes defined by an NTE genotype:activity:phenotype relationship. This relationship, and the generation of a preclinical animal model, pave the way for therapeutic trials, using NTE as a biomarker.

Keywords: Boucher-Neuhäuser syndrome; Gordon-Holmes syndrome; Laurence-Moon syndrome; Oliver-McFarlane syndrome; neurodegeneration; spastic paraplegia type 39.


Conflict of interest statement

The authors report no competing interests.

Figures

Figure 1
Figure 1
Summary of systematic evidence-based review of patients with PNPLA6 variants. (A) Schematic of the protein domain architecture and the location of 93 PNPLA6 missense, truncating, nonsense and in-frame variants (excluding 11 splice variants, one duplication and one deletion) known since May 2023 (NCBI reference NP_001159583.1). Neuropathy target esterase (NTE) contains a single pass transmembrane domain (aa60-80), three cyclic nucleotide binding (CNB) domains, and a NTE-esterase (NEST) domain. Figure generated using IBS Cuckoo illustration software. (B) Frequency distribution of variants based on their locations on the protein and variant type. Missense: NEST domain, n = 40; splicing/frameshift/nonsense, n = 35; Missense: CNB domains, n = 11; Missense: Other, n = 19; in-frame deletion: n = 1. (C) Missense variants categorized within the NEST domain (aa964–1269) and outside the nest domain (aa1–964, aa1270–1375) were grouped by their association with/without retinopathy and endocrinopathy. (C) Used a Fisher’s exact test with α = 0.05. Additional genotypic information can be found in the Supplementary material, ‘Supporting data values’ file.
Figure 2
Figure 2
PNPLA6 variants reduce in vitro NTE activity and increase likelihood of in silico misfolding. (A) Variants colour-coded by the syndrome they associate with (black = SPG39; pink = GDHS; teal = BNHS; purple = OMCS/LNMS). Highlighted areas indicate the location of variants within the protein’s domains (RefSeq protein NP_001159583.1). ‘% activity’ is the activity of variants relative to wild-type (WT). The activity of variants was normalized to the wild-type samples run in parallel. Each run had a wild-type, a previously tested missense variant, Arg1031Glnfs*38 and untransfected samples. Box and whisker plots extend from the 25th to 75th percentiles, with whiskers extending to the minimum and maximum values in the dataset. The median is the line plotted between boxes. See Supplementary material, ‘Supporting data values’ file for exact mean, n and standard deviation values. (B) The homology model of the human patatin domain. The ribbon structure of the patatin domain is shown in blue. Positions of 27 missense variants in the domain are labelled orange. Two residues forming a catalytic dyad, Ser1014-Asp1134, are shown in cyan. A patatin substrate, phenyl pentanoate, was docked to the active site and shown in red. (C) Global computational mutagenesis analysis comparing predicted unfolding fraction versus residual NTE activity. A 95% confidence ellipse is fitted in a scatter plot. R2 = 0.7. BNHS = Boucher-Neuhäuser syndrome; CNB = cyclic nucleotide binding; GDHS = Gordon-Holmes syndrome; LNMS = Laurence-Moon syndrome; NEST = NTE-esterase domain; NTE = neuropathy target esterase; OMCS = Oliver-McFarlane syndrome; SPG39 = spastic paraplegia type 39.
Figure 3
Figure 3
Inverse relationship between residual NTE activity and disease severity and tissue manifestation. (A) Comparing synthetically determined patient neuropathy target esterase (NTE) activity categorized by PNPLA6-associated syndromes. (B) Comparing synthetically determined patient NTE activity between individuals with and without retinopathy. (C) Comparing synthetically determined patient NTE activity between individuals with and without endocrinopathy. ‘% activity’ is the activity of variants relative to wild-type (WT). Data-points for B and C correspond to the following: black = SPG39; pink = GDHS; teal = BNHS; purple = OMCS/LNMS. Box and whisker plots extend from the 25th to 75th percentiles, with whiskers extending to the minimum and maximum values in the dataset. The median is the line plotted between boxes. (A) Used a Brown-Forsythe ANOVA with post hoc Tukey test with α = 0.05. (B and C) Used a Welch’s t-test with α = 0.05. P > 0.05 (not significant, ns), *P < 0.05, **P < 0.01, ***P < 0.001, ****P < 0.0001. See Supplementary material, ‘Supporting data values’ file for exact mean, n and standard deviation values. BNHS = Boucher-Neuhäuser syndrome; GDHS = Gordon-Holmes syndrome; LNMS = Laurence-Moon syndrome; OMCS = Oliver-McFarlane syndrome; SPG39 = spastic paraplegia type 39.
Figure 4
Figure 4
Residual NTE activity determines the loss of visual function and structure in PNPLA6 allelic series mice in a dose-dependent manner. (A) Scotopic electroretinogram (ERG) trace at maximum stimulus intensity (10 cd.s/m2) for our photopic imaging protocol. (B) Photopic ERG trace at maximum stimulus intensity (100 cd.s/m2) for our scotopic imaging protocol. (C) Optomotor response (OMR) (+/+ n = 15, MV/MV n = 12, MV/delAT n = 13) of allelic series mice at 3 months. (D) Time course of total retinal thickness of optical coherence tomography (OCT) images. Significant values are between Control and MV/delAT values. Control and MV/MV line were not significantly different, and MV/MV and MV/delAT were significantly different. (E) Time course of outer nuclear layer (ONL) thickness of OCT images. Significant values are between Control and MV/delAT values. Control and MV/MV line were not significantly different, and MV/MV and MV/delAT were significantly different. (F) Neuropathy target esterase (NTE) activity of allelic series mice brain homogenate. Each time point took measurements from littermates, and bars in E and F are offset for cleaner presentation. All error bars in standard deviations. Box and whisker plots extend from the 25th to 75th percentiles, with whiskers extending to the minimum and maximum values in the dataset. The median is the line plotted between boxes. Statistical tests from these figures used one-way ANOVA with post hoc Tukey test with α = 0.05. P > 0.05 (not significant, ns), *P < 0.05, **P < 0.01, ***P < 0.001, ****P < 0.0001. See Supplementary material, ‘Supporting data values’ file for exact mean, n and standard deviation values.
Figure 5
Figure 5
Residual NTE activity dictates the onset of retinopathy and embryonic lethality in PNPLA6 missense allelic series mice. (A) Predicted overall neuropathy target esterase (NTE) activity of allelic series mice using human in vitro variant activities (Fig. 2). (B) The proportion of viable homozygous pups in the PNPLA6 allelic series. The red line denotes the normal Mendelian ratio expected (25%). See Supplementary Table 2 for exact numbers. (C) NTE activity of viable homozygous allelic series mice brain homogenate. (D) Six-month scotopic electroretinogram (ERG) wave amplitudes at a stimulus intensity of 10 cd.s/m2. (E) Six-month photopic ERG wave amplitudes at a stimulus intensity of 100 cd.s/m2. (F) Total retinal thickness measured from spectral domain-optical coherence tomography (SD-OCT) images at 6 months. Box and whisker plots extend from the 25th to 75th percentiles, with whiskers extending to the minimum and maximum values in the dataset. The median is the line plotted between boxes. DF used one-way ANOVA with post hoc Tukey test with α=0.05. P > 0.05 (not significant, ns), *P < 0.05, **P < 0.01, ***P < 0.001, ****P < 0.0001. Significant values in DF indicate significance between Control and MV/GS values. See Supplementary material, ‘Supporting data values’ file for exact mean, n and standard deviation values.

Update of

  • Neuropathy target esterase activity predicts retinopathy among PNPLA6 disorders.
    Liu J, He Y, Lwin C, Han M, Guan B, Naik A, Bender C, Moore N, Huryn LA, Sergeev Y, Qian H, Zeng Y, Dong L, Liu P, Lei J, Haugen CJ, Prasov L, Shi R, Dollfus H, Aristodemou P, Laich Y, Németh AH, Taylor J, Downes S, Krawczynski M, Meunier I, Strassberg M, Tenney J, Gao J, Shear MA, Moore AT, Duncan JL, Menendez B, Hull S, Vincent A, Siskind CE, Traboulsi EI, Blackstone C, Sisk R, Utz V, Webster AR, Michaelides M, Arno G, Synofzik M, Hufnagel RB. Liu J, et al. bioRxiv [Preprint]. 2023 Jun 11:2023.06.09.544373. doi: 10.1101/2023.06.09.544373. bioRxiv. 2023. Update in: Brain. 2024 Jun 3;147(6):2085-2097. doi: 10.1093/brain/awae055. PMID: 37333224 Free PMC article. Updated. Preprint.

References

    1. Hufnagel RB, Arno G, Hein ND, et al. Neuropathy target esterase impairments cause Oliver-McFarlane and Laurence-Moon syndromes. J Med Genet. 2015;52:85–94. - PMC - PubMed
    1. Kmoch S, Majewski J, Ramamurthy V, et al. Mutations in PNPLA6 are linked to photoreceptor degeneration and various forms of childhood blindness. Nat Commun. 2015;6:5614. - PMC - PubMed
    1. Rainier S, Bui M, Mark E, et al. Neuropathy target esterase gene mutations cause motor neuron disease. Am J Hum Genet. 2008;82:780–785. - PMC - PubMed
    1. Synofzik M, Gonzalez MA, Lourenco CM, et al. PNPLA6 mutations cause Boucher-Neuhauser and Gordon Holmes syndromes as part of a broad neurodegenerative spectrum. Brain. 2014;137(Pt 1):69–77. - PMC - PubMed
    1. Topaloglu AK, Lomniczi A, Kretzschmar D, et al. Loss-of-function mutations in PNPLA6 encoding neuropathy target esterase underlie pubertal failure and neurological deficits in Gordon Holmes syndrome. J Clin Endocrinol Metab. 2014;99:E2067–E2075. - PMC - PubMed

Publication types