. 2024 Apr 25:15:1369536.
doi: 10.3389/fimmu.2024.1369536. eCollection 2024.

The nature of chronic rejection after lung transplantation: a murine orthotopic lung transplant study

Affiliations

The nature of chronic rejection after lung transplantation: a murine orthotopic lung transplant study

Tobias Heigl et al. Front Immunol. .

Abstract

Introduction: Chronic rejection is a major complication post-transplantation. Within lung transplantation, chronic rejection was considered as airway centred. Chronic Lung Allograft Dysfunction (CLAD), defined to cover all late chronic complications, makes it more difficult to understand chronic rejection from an immunological perspective. This study investigated the true nature, timing and location of chronic rejection as a whole, within mouse lung transplantation.

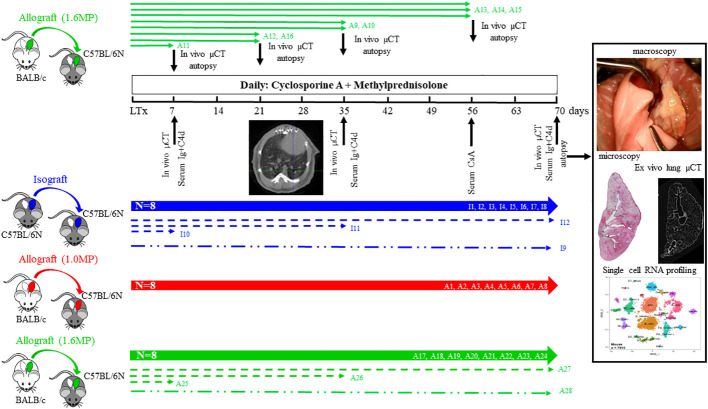
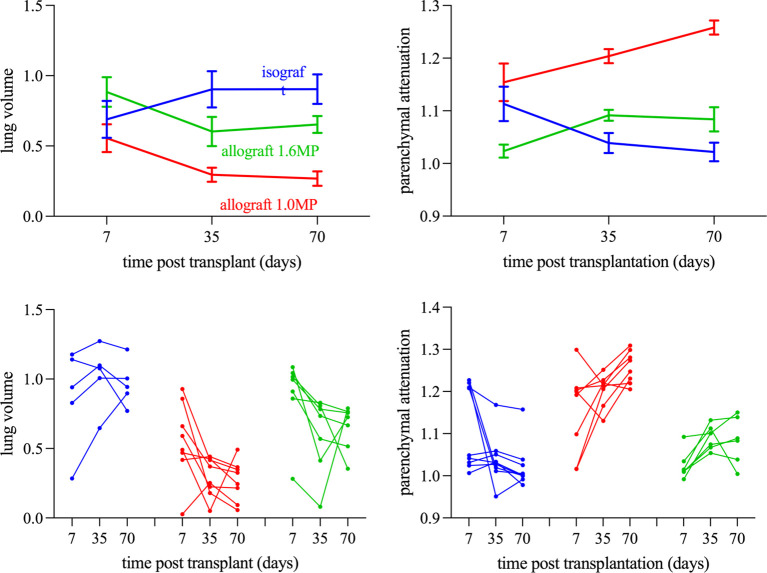
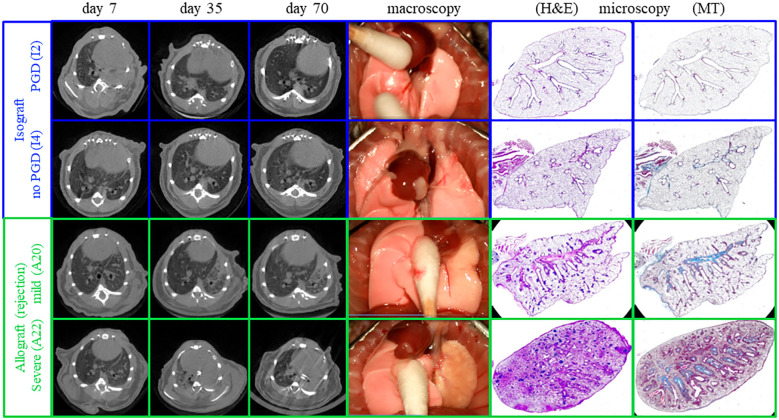
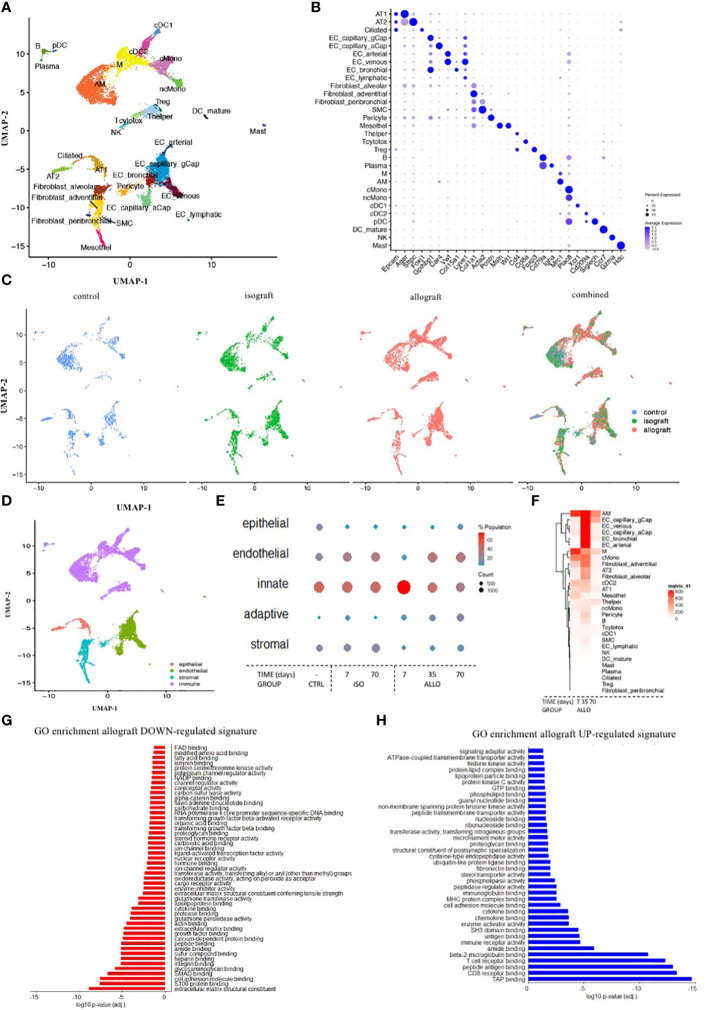
Methods: 40 mice underwent an orthotopic left lung transplantation, were sacrificed at day 70 and evaluated by histology and in vivo µCT. For timing and location of rejection, extra grafts were sacrificed at day 7, 35, 56 and investigated by ex vivo µCT or single cell RNA (scRNA) profiling.

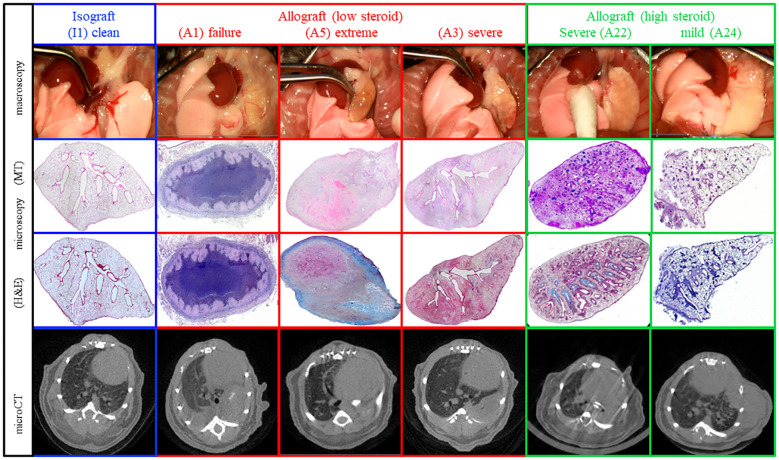
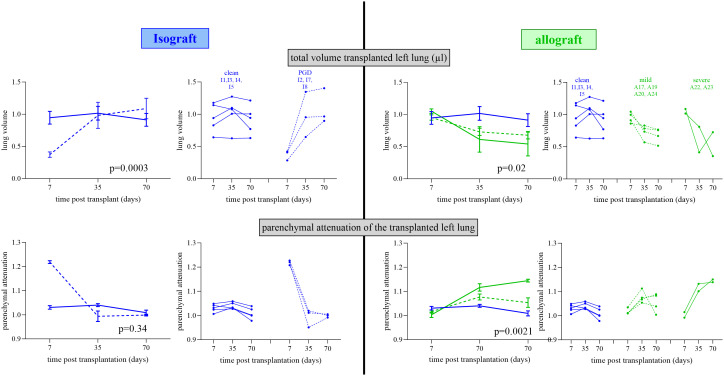
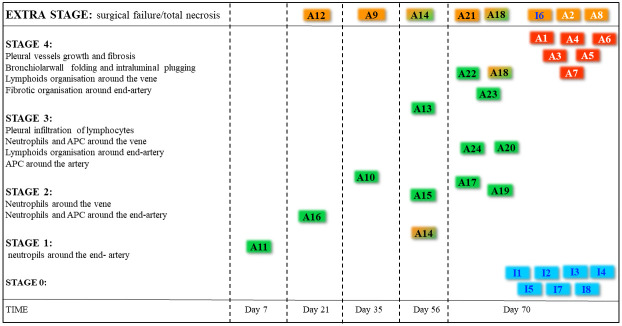
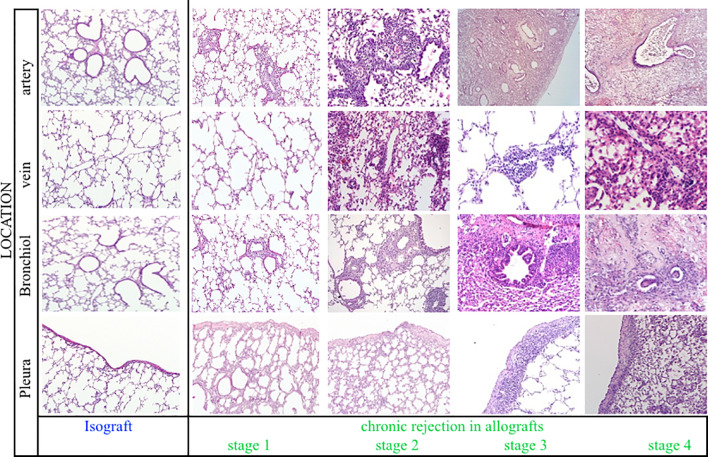
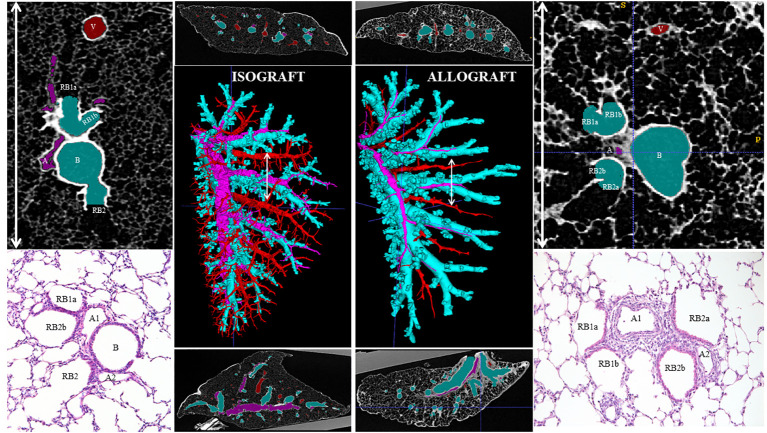
Results: Chronic rejection originated as innate inflammation around small arteries evolving toward adaptive organization with subsequent end-arterial fibrosis and obliterans. Subsequently, venous and pleural infiltration appeared, followed by airway related bronchiolar folding and rarely bronchiolitis obliterans was observed. Ex vivo µCT and scRNA profiling validated the time, location and sequence of events with endothelial destruction and activation as primary onset.

Conclusion: Against the current belief, chronic rejection in lung transplantation may start as an arterial response, followed by responses in venules, pleura, and, only in the late stage, bronchioles, as may be seen in some but not all patients with CLAD.

Keywords: chronic rejection; imaging; lung transplantation; mouse model; single-cell profiling.


Conflict of interest statement

The authors declare that the research was conducted in the absence of any commercial or financial relationships that could be construed as a potential conflict of interest.

Figures

Figure 1
Figure 1
The study design of the allograft and isograft orthotopic single left lung transplantation in mice receiving daily immunosuppression of cyclosporine and steroids. Isograft (blue), allograft (low dose of steroids; red), and high dose of steroids (green) were sacrificed at 10 weeks (n = 8/group; thick lines). Additional allografts (high dose; n = 8) are sacrificed at weeks 1, 3, 5, and 8 (green, thin lines). Evaluation parameters post-transplantation are in vivo lung imaging, serum sampling and histology, ex vivo lung imaging, and single-cell analysis. Additional mice for single-cell RNA profiling and the ex vivo µCT are presented as dotted lines and dot-dashed lines. All animals are coded and reported later on.
Figure 2
Figure 2
Representative macroscopy, microscopy, and in vivo µCT of the different pathological presentations at day 70. The different patterns include fully normal lungs, completely destroyed failures, and lungs demonstrating chronic rejection with a spectrum of extreme, severe, and mild rejection.
Figure 3
Figure 3
Repeated in vivo µCT lung evolution of the isograft and allograft groups. In vivo µCT lung evolution for lung volume and parenchymal attenuation. µCT parameters are normalized to the reference lungs. The left side shows the isografts (blue lines) stratified according to the occurrence of PGD (dotted line) or not (full line) with group variation and individual evolution. The right side shows isografts (no PGD; blue) and allografts (green) stratified according to mild (dotted line) and severe (full line) rejection with group variation and individual evolution. For group variation, the median with SEM is presented at each time point.
Figure 4
Figure 4
The pathological staging of rejection. All allografts were used to identify the stage and were subdivided into stages of rejection. Failures are documented in orange boxes. Two animals demonstrated a part of the lung to be destroyed, and another part presented rejection (half green half orange boxes). The color of the boxes in the included lungs represents the origin of the graft being an isograft (blue, n = 7), an allograft under high-dose steroids (green boxes, n = 13), and an allograft under low-dose steroids (red boxes, n = 6).
Figure 5
Figure 5
Longitudinal morphometric µCT analysis stratified according to the severity of rejection (Tx left lung). (A) Total lung volume of the transplanted left lung. (B) Parenchymal attenuation of the transplanted left lung. The Left shows the isograft group (blue lines) stratified according to the occurrence of PGD (dotted lines). The right shows the Allograft 1.6MP group (green lines) stratified according to the severity of rejection (mild rejection is denoted as dotted lines and severe rejection is denoted as full lines). All data have been normalized as described in the Methods section.
Figure 6
Figure 6
Representative macroscopy, microscopy, and in vivo µCT imaging of mild and severe chronic rejection. One allograft with mild rejection and one with severe rejection are presented (green). In comparison, a control isograft is present, and an additional isograft demonstrating on µCT at week 1 primary graft dysfunction (PGD).
Figure 7
Figure 7
Representative histological illustrations of the four stages of chronic rejection. For each stage, the different anatomical lung compartments involved were presented, including arteries, veins, bronchioles, and pleura. Stage 1, Stage 2, Stage 3, and Stage 4 are represented by A11 at day 7, A16 at day 21, A24 at day 70, and A22 at day 70, respectively.
Figure 8
Figure 8
An ex vivo high-resolution µCT imaging and reconstruction of the organization of chronic rejection. The airways (light blue), arterial vessels (pink), and venous vessels (red) of the transplanted left lung were segmented and reconstructed in 3D (middle large picture) in an isograft (left) and an allograft (right). A transverse and sagittal image of the scans is presented above and below the reconstruction. On the right and left sides of the figure, μCT (top) and histological (bottom) details of the broncho-vascular bundle, specifically of the location of the white arrow line, identify the arterial origin of rejection at the generation where airways go over in respiratory bronchioles.
Figure 9
Figure 9
Single-cell RNA profiling to validate the sequence of chronic rejection across the different cells involved and subcellular mechanisms. (A) UMAP plot of the cells from the left lung of three isografts (7, 35, and 70 days), three allografts (7, 35, and 70 days), and one control BalBc lung color-coded by major cellular lineage. (B) Dot plot heatmap of the expression of representative marker genes of cellular lineages. The size and color intensity of each dot represent, respectively, the percentage or average expression of the marker gene in this cell type. Color scale: blue, high expression; white, low expression. (C) UMAP plot of lung cells, color-coded for the indicated conditions of the left lung. (D) UMAP plot of lung cells, color-coded for the indicated major cell subcluster. (E) Dot plot heatmap of the major cell subcluster. The size and color intensity of each dot represent, respectively, the total number and percentage of cells within each cell type. Color scale: red, high expression; blue, low expression. (F) Gene expression heatmap of all individual genes in every identified cell type. Color scale: red, high expression; blue, low expression. (G, H) A barplot of the GO enrichment analysis of down- and upregulated gene signatures in allograft lungs.

References

    1. Sayegh MH, Carpenter CB. Transplantation 50 years later - progress, challenges, and promises. New Engl J Med. (2004) 351:2761–6. doi: 10.1056/NEJMon043418 - DOI - PubMed
    1. Li XC, Jevnikar AM. Transplant immunology. Houston, USA: Wiley-Blackwell; (2015). doi: 10.1002/9781119072997 - DOI
    1. Verleden GM, Glanville AR, Lease ED, Fisher AJ, Calabrese F, Corris PA, et al. . Chronic lung allograft dysfunction: Definition, diagnostic criteria, and approaches to treatment-A consensus report from the Pulmonary Council of the ISHLT. J Heart Lung Transplant. (2019) 38:493–503. doi: 10.1016/j.healun.2019.03.009 - DOI - PubMed
    1. Barker AF, Bergeron A, Rom WN, Hertz MI. Obliterative bronchiolitis. N Engl J Med. (2014) 370:1820–8. doi: 10.1056/NEJMra1204664 - DOI - PubMed
    1. Sato M, Waddell TK, Wagnetz U, Roberts HC, Hwang DM, Haroon A, et al. . Restrictive allograft syndrome (RAS): a novel form of chronic lung allograft dysfunction. J Heart Lung Transplant. (2011) 30:735–42. doi: 10.1016/j.healun.2011.01.712 - DOI - PubMed

Publication types