. 2024;2(1):42.
doi: 10.1038/s44271-024-00094-5. Epub 2024 May 9.

Social environment-based opportunity costs dictate when people leave social interactions

Affiliations

Social environment-based opportunity costs dictate when people leave social interactions

Anthony S Gabay et al. Commun Psychol. 2024.

Abstract

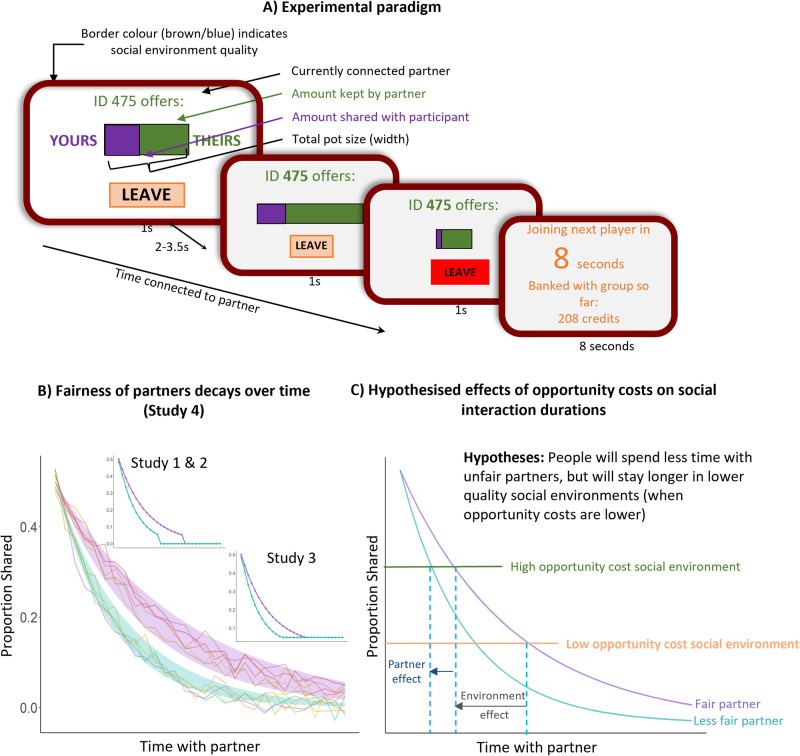
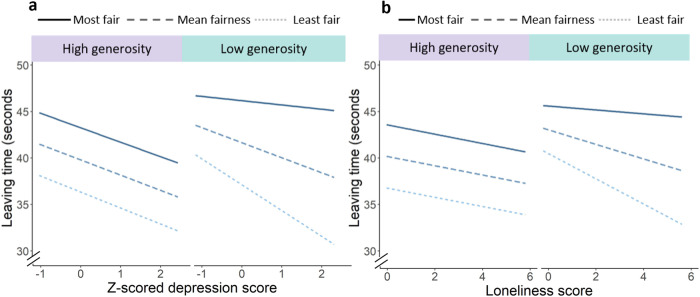
There is an ever-increasing understanding of the cognitive mechanisms underlying how we process others' behaviours during social interactions. However, little is known about how people decide when to leave an interaction. Are these decisions shaped by alternatives in the environment - the opportunity-costs of connecting to other people? Here, participants chose when to leave partners who treated them with varying degrees of fairness, and connect to others, in social environments with different opportunity-costs. Across four studies we find people leave partners more quickly when opportunity-costs are high, both the average fairness of people in the environment and the effort required to connect to another partner. People's leaving times were accounted for by a fairness-adapted evidence accumulation model, and modulated by depression and loneliness scores. These findings demonstrate the computational processes underlying decisions to leave, and highlight atypical social time allocations as a marker of poor mental health.

Keywords: Human behaviour; Social behaviour.


Conflict of interest statement

Competing interestsThe authors declare no competing interests.

Figures

Fig. 1
Fig. 1. Experimental paradigm.
A Participants were connected with partners (indicated by numeric ID numbers). Partners made decisions about how much to share out of different pots of total credits of different sizes, indicated by the width of a bar on the screen. The amount being shared was purple, and the amount kept by the partner was shown in green. Participants’ task was to decide when to leave a partner to connect to another. When participants chose to leave, they experienced an eight-second delay during which they were shown the amount of credits collected in the environment so far. Participants joined different virtual “groups” of potential partners for five-minute blocks, creating different social environments. This information was indicated by a coloured border for the entirety of blocks and an instruction screen between blocks. Note that this figure shows the stimulus presentation for Study 4. Studies 1–3 used text and numerals instead as can be seen in the supplementary materials. B The decisions by partners were experimentally controlled with different rates of decline in fairness - the proportion shared. The lines represent examples of proportions shared by partners over time. Studies 1, 2, and 3 (inset) had only two types of partner. Study 4 had multiple partners, with noise surrounding the rates of decay of fairness. The purple shaded area represents proportions shared by “fair” partners, and the green shaded area represents proportions shared by “unfair” partners. C An opportunity-cost account predicts that people will leave sooner from less fair (teal line) than fair (purple) partners, but also that it will depend on the opportunity-cost afforded by the social environment. To manipulate opportunity costs for studies 1, 2, and 4, environments differed by their average generosity, determined by the proportion of fair or unfair partners included in the virtual group. In Study 3, they differed by the amount of effort (a high low number of button presses) to be completed before being connected to a new partner. When effort was low or average generosity high (green line), the opportunity cost was higher, and thus, it is predicted people would leave partners sooner than when the opportunity cost was low (orange).
Fig. 2
Fig. 2. Mean leaving times–time spent connected before deciding to leave–with partners of different types and in different quality social environments.
There were statistically significant main effects of partner-type and environment in all four studies. In all studies, participants spent more time connected with fairer partners, but less time with partners when the opportunity-cost of the environment was high (i.e., when the group was generous or when it was low effort to connect to another partner). Means from study 1 (A), study 2 (B) where the social environment quality was defined by average generosity, high (purple) and low (teal). In study 3, C the social environment quality was defined by the effort–the number of button presses–required to connect to the next partner. For study 4 (D), partner type was a continuous variable, with shaded regions representing 95% CIs. Points represent individual participant means, and triangles represent the summary means with error bars of ±1SE.
Fig. 3
Fig. 3. Study 4 results.
a Depicts the statistically significant three-way interaction between partner-type, environment, and depression. b Depicts the three-way interaction between partner-type, environment, and loneliness. In both cases, in low generosity environments, participants with higher self-reported scores spent less time interacting with more unfair participants (three-way interaction p = 0.030 for both measures). Thus, higher depression and loneliness ratings were linked to different sensitivity to the fairness of partners and the quality of the social environment on decisions to leave social interactions. ‘Most fair’ and ‘least fair’ refer to mean fairness plus 1 SD and mean fairness minus 1 SD, respectively.
Fig. 4
Fig. 4. Evidence accumulation.
A Schematic representation of evidence accumulation models. In all models evidence accumulated to leave the social interaction over time. The fairness and reward DDMs adapted this accumulation, with the drift multiplied by reward obtained (reward) or proportion or shared (fairness) at the time of each decision by the partner. B Model comparison of the three competing models (BIC) showed that the fairness model was best able to explain behaviour compared to the reward and standard DDMs. C Plots of the simulated data for each of the three models compared against data from study 4 (top left). Dots represent estimated/actual mean for a participant. Only the Fairness-DDM replicated the effects of partner-type and environment on simulated leaving times. Triangles represent estimated/actual mean across participants. Error bars represent SEM.

References

    1. De Jong Gierveld, J. & Van Tilburg, T. The De Jong Gierveld short scales for emotional and social loneliness: tested on data from 7 countries in the UN generations and gender surveys. Eur. J. Ageing7, 121–130 (2010). 10.1007/s10433-010-0144-6 - DOI - PMC - PubMed
    1. Kupferberg, A., Bicks, L. & Hasler, G. Social functioning in major depressive disorder. Neurosci. Biobehav. Rev. 69, 313–332 (2016). - PubMed
    1. Mastroianni, A. M., Gilbert, D. T., Cooney, G. & Wilson, T. D. Do conversations end when people want them to? Proc. Natl. Acad. Sci.118, e2011809118 (2021). 10.1073/pnas.2011809118 - DOI - PMC - PubMed
    1. Schroeder, J. Ending conversation is a fraught endeavor. Trends Cogn. Sci.25, 552–553 (2021). 10.1016/j.tics.2021.04.010 - DOI - PubMed
    1. Charnov, E. L. Optimal foraging, the marginal value theorem. Theor. Popul. Biol.9, 129–136 (1976). 10.1016/0040-5809(76)90040-X - DOI - PubMed

LinkOut - more resources