

Endometrium development patterns and BMI groups among in vitro fertilization patients; prognostic aspects
- PMID: 38737557
- PMCID: PMC11082419
- DOI: 10.3389/fendo.2024.1379109
Endometrium development patterns and BMI groups among in vitro fertilization patients; prognostic aspects
Abstract
Introduction: The impact of the obesity pandemic on female reproductive capability is a factor that needs to be investigated. In addition, the link between endometrial thickness and in vitro fertilization (IVF) outcomes is contentious.
Goal: Our goal was to analyze the association among endometrium development, hormone levels, embryo quality, clinical pregnancy, anamnestic parameters, and body mass index (BMI) in women receiving IVF treatment.
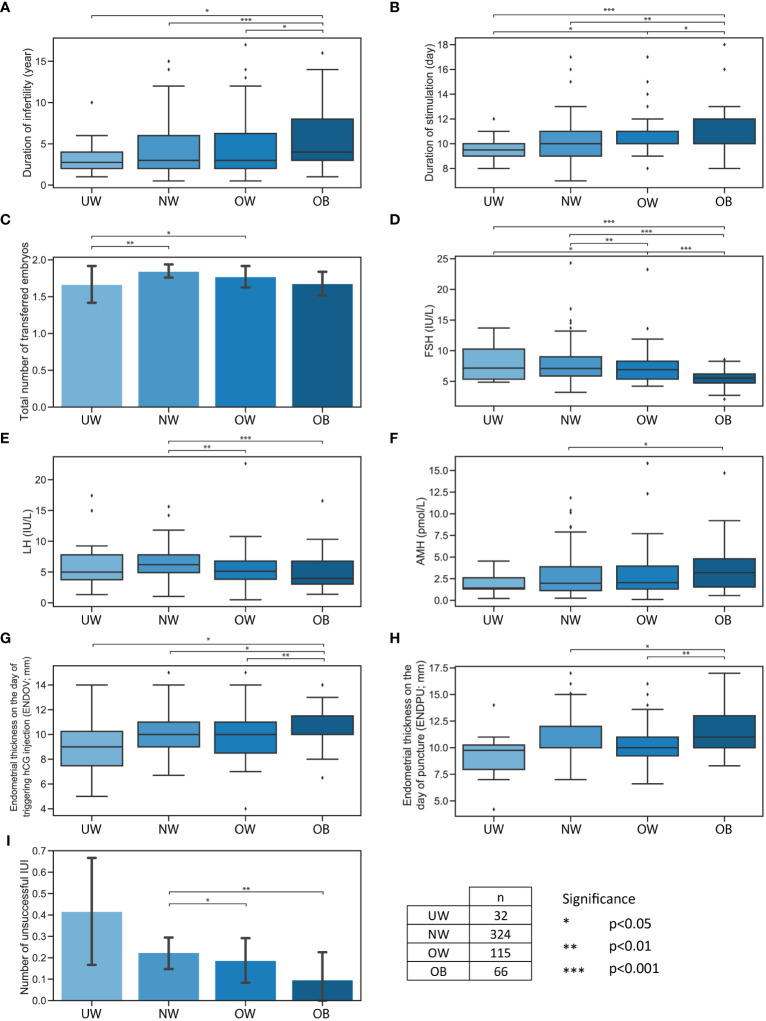
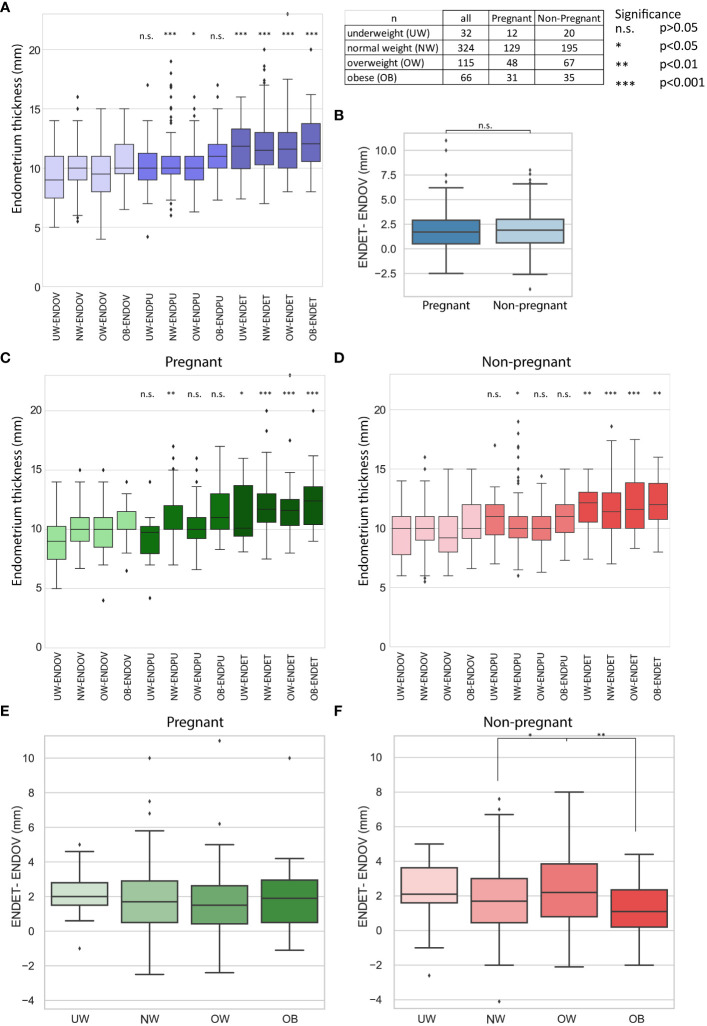
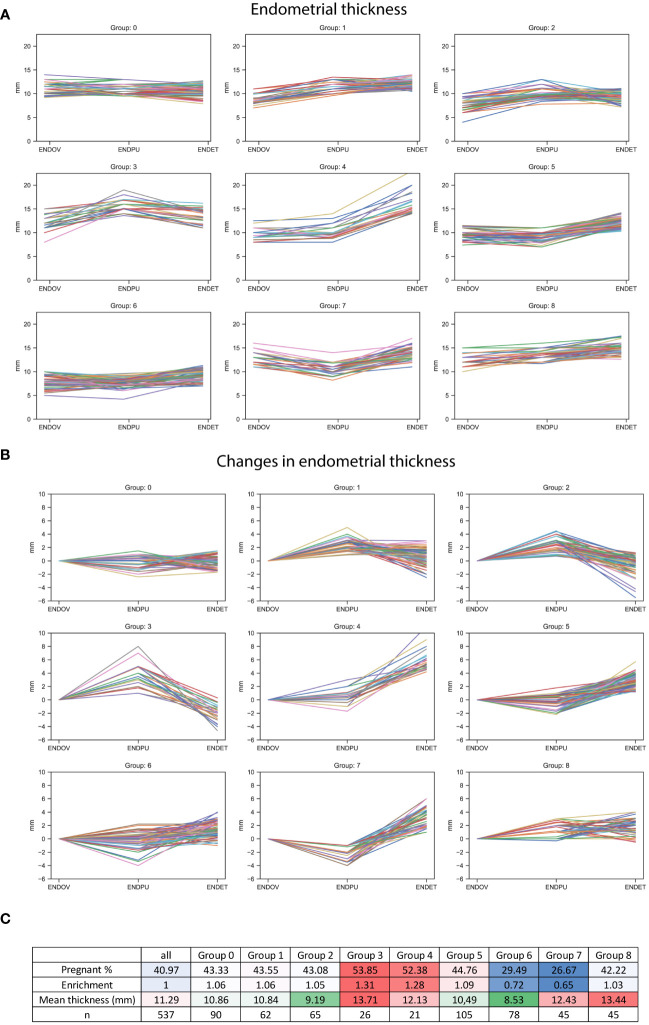
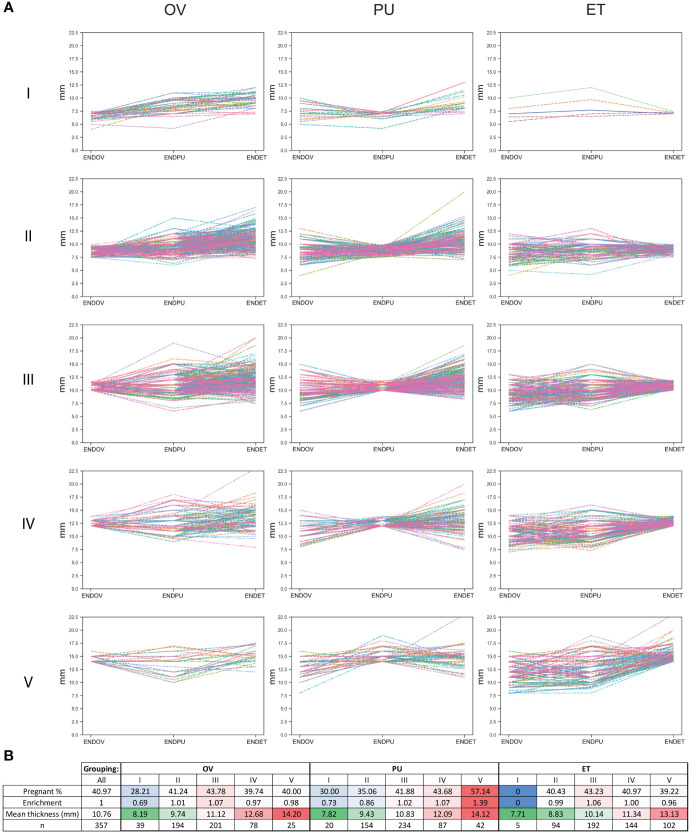
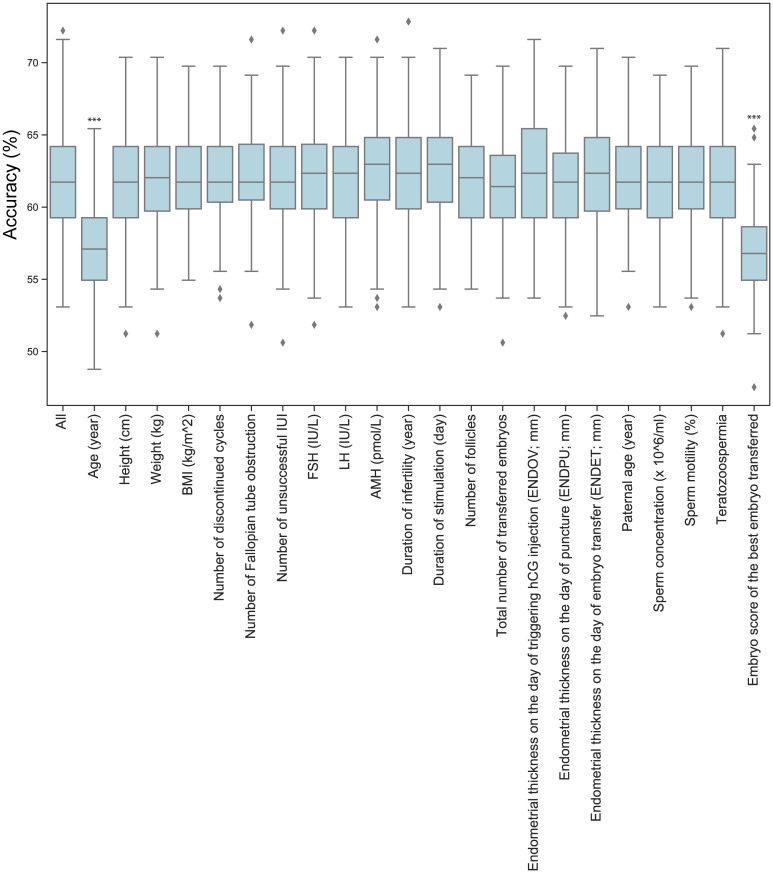
Patients and methods: 537 participants undergoing IVF/ICSI cycles with successful oocyte retrieval were enrolled. Subjects were divided into four BMI based groups: underweight (UW; n=32), normal weight (NW; n=324), overweight (OW; n= 115), obesity (OB; n=66). Anthropometric and anamnestic parameters, characteristics of stimulation, endometrial thickness on the day of hCG injection, at puncture, at embryo transfer, FSH, LH, AMH, partner's age and the semen analysis indicators, embryo quality, clinical pregnancy, were recorded and analyzed. Support Vector Machine (SVM) was built to predict potential pregnancies based on medical data using 22 dimensions.
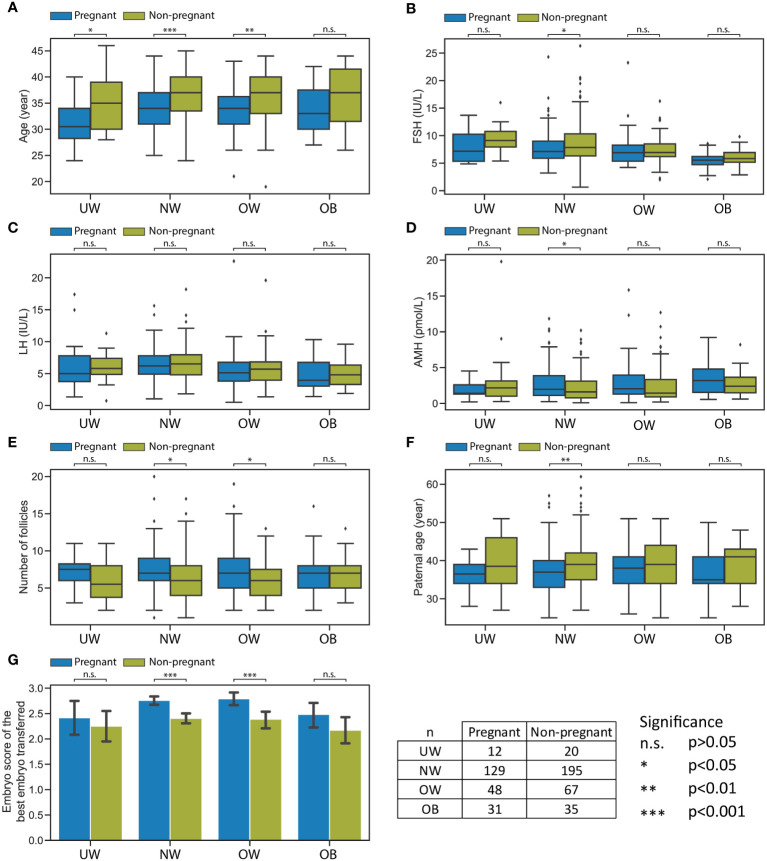
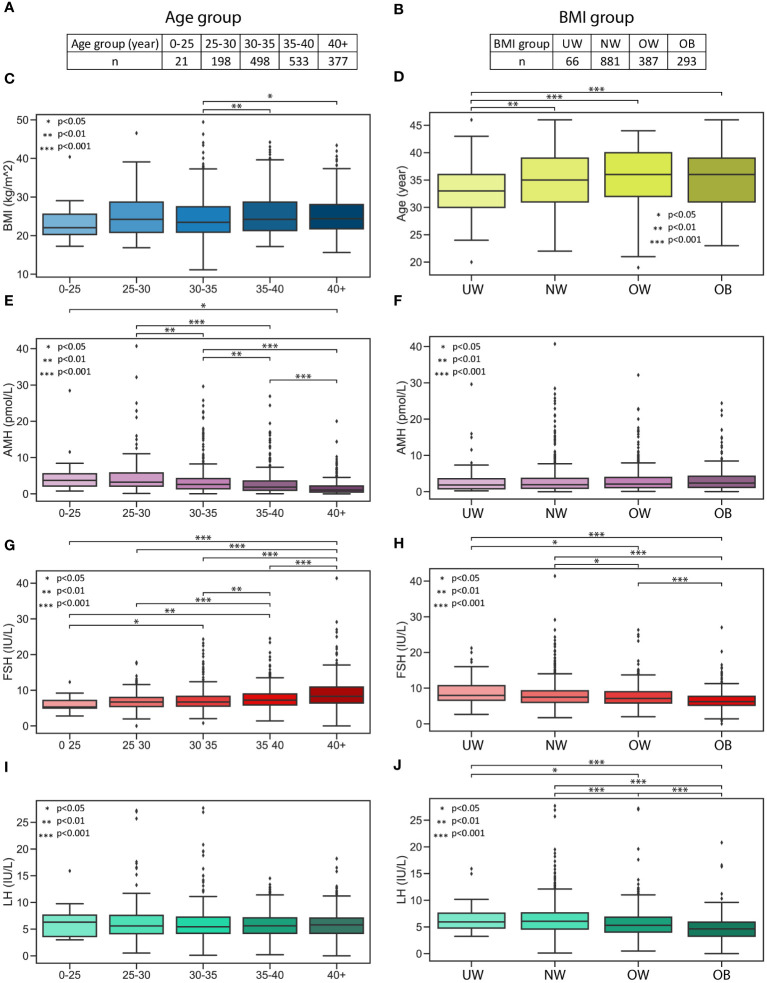
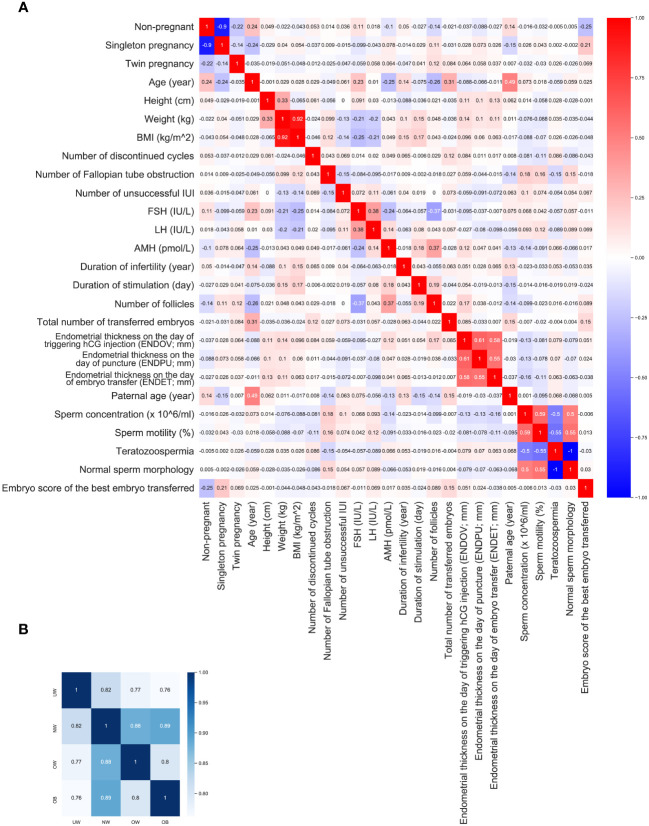
Results: In accordance with BMI categories, when examining pregnant/non-pregnant division, the average age of pregnant women was significantly lower in the UW (30.9 ± 4.48 vs. 35.3 ± 5.49 years, p=0.022), NW (34.2 ± 4.25 vs. 36.3 ± 4.84 years, p<0.001), and OW (33.8 ± 4.89 vs. 36.3 ± 5.31 years, p=0.009) groups. Considering FSH, LH, and AMH levels in each BMI category, a statistically significant difference was observed only in the NW category FSH was significantly lower (7.8 ± 2.99 vs. 8.6 ± 3.50 IU/L, p=0.032) and AMH (2.87 ± 2.40 vs. 2.28 ± 2.01 pmol/L, p=0.021) was higher in pregnant women. There were no further statistically significant differences observed between the pregnant and non-pregnant groups across any BMI categories, especially concerning endometrial development. Surprisingly, BMI and weight correlated negatively with FSH (r=-0.252, p<0.001; r=-0.206, p<0.001, respectively) and LH (r= -0.213, p<0.001; r= -0.195, p<0.001) in the whole population. SVM model average accuracy on predictions was 61.71%.
Discussion: A convincing correlation between endometrial thickness development and patients' BMI could not be substantiated. However, FSH and LH levels exhibited a surprising decreasing trend with increasing BMI, supporting the evolutionary selective role of nutritional status. Our SVM model outperforms previous models; however, to confidently predict the outcome of embryo transfer, further optimization is necessary.
Keywords: body mass index; clinical pregnancy rate; endometrium thickness; in vitro fertilization; obesity.
Copyright © 2024 Vedelek, Bicskei, Tábi, Lajkó, Ékes, Bereczki, Meixner-Csáti, Sinka, Vágvölgyi and Zádori.
Conflict of interest statement
The authors declare that the research was conducted in the absence of any commercial or financial relationships that could be construed as a potential conflict of interest.
Figures

Similar articles
-
Relationship Between Anti-Müllerian Hormone and In Vitro Fertilization-Embryo Transfer in Clinical Pregnancy.Front Endocrinol (Lausanne). 2020 Dec 4;11:595448. doi: 10.3389/fendo.2020.595448. eCollection 2020. Front Endocrinol (Lausanne). 2020. PMID: 33343511 Free PMC article.
-
Association between gestational trophoblastic disease (GTD) history and clinical outcomes in in vitro fertilization/intracytoplasmic sperm injection (IVF/ICSI) cycles.Reprod Biol Endocrinol. 2022 Feb 4;20(1):27. doi: 10.1186/s12958-022-00898-2. Reprod Biol Endocrinol. 2022. PMID: 35120557 Free PMC article.
-
The impact of LH, E2, and P level of HCG administration day on outcomes of in vitro fertilization in controlled ovarian hyperstimulation.Clin Exp Obstet Gynecol. 2015;42(3):361-6. Clin Exp Obstet Gynecol. 2015. PMID: 26152012
-
Can Ratios Between Prognostic Factors Predict the Clinical Pregnancy Rate in an IVF/ICSI Program with a GnRH Agonist-FSH/hMG Protocol? An Assessment of 2421 Embryo Transfers, and a Review of the Literature.Reprod Sci. 2021 Feb;28(2):495-509. doi: 10.1007/s43032-020-00307-2. Epub 2020 Sep 4. Reprod Sci. 2021. PMID: 32886340 Review.
-
Should rescue ICSI be re-evaluated considering the deferred transfer of cryopreserved embryos in in-vitro fertilization cycles? A systematic review and meta-analysis.Reprod Biol Endocrinol. 2021 Aug 4;19(1):121. doi: 10.1186/s12958-021-00784-3. Reprod Biol Endocrinol. 2021. PMID: 34348713 Free PMC article.
Cited by
-
The Influence of Pre-IVF Day 2 TSH Levels on Treatment Success and Obstetric Outcomes: A Retrospective Single-Center Analysis with Machine Learning-Based Data Evaluation.J Clin Med. 2025 Jun 20;14(13):4407. doi: 10.3390/jcm14134407. J Clin Med. 2025. PMID: 40648778 Free PMC article.
-
The impact of obesity and weight loss treatment on metabolic parameters, cardiovascular autonomic and sensory nerve function and in vitro fertilization outcomes in infertile women: a pilot study.Front Endocrinol (Lausanne). 2025 May 20;16:1548587. doi: 10.3389/fendo.2025.1548587. eCollection 2025. Front Endocrinol (Lausanne). 2025. PMID: 40463745 Free PMC article.
-
Pre- and Procedural Factors Influencing the Success of In Vitro Fertilization: Evaluating Embryo Quality and Clinical Pregnancy in Cases of Tubal Factor Infertility.J Clin Med. 2024 Sep 27;13(19):5754. doi: 10.3390/jcm13195754. J Clin Med. 2024. PMID: 39407814 Free PMC article.
-
Higher oxidative balance score is associated with lower female infertility: a cross-sectional study.Front Nutr. 2024 Dec 4;11:1484756. doi: 10.3389/fnut.2024.1484756. eCollection 2024. Front Nutr. 2024. PMID: 39703331 Free PMC article.
References
-
- Available online at: https://data.worldobesity.org/rankings/?age=a&sex=f.
Publication types
MeSH terms
LinkOut - more resources
Full Text Sources
Miscellaneous