. 2024 Sep 1;36(9):2045-2066.
doi: 10.1162/jocn_a_02188.

Cross-sectional and Longitudinal Age-related Disintegration in Functional Connectivity: Reference Ability Neural Network Cohort

Affiliations

Cross-sectional and Longitudinal Age-related Disintegration in Functional Connectivity: Reference Ability Neural Network Cohort

Georgette Argiris et al. J Cogn Neurosci. .

Abstract

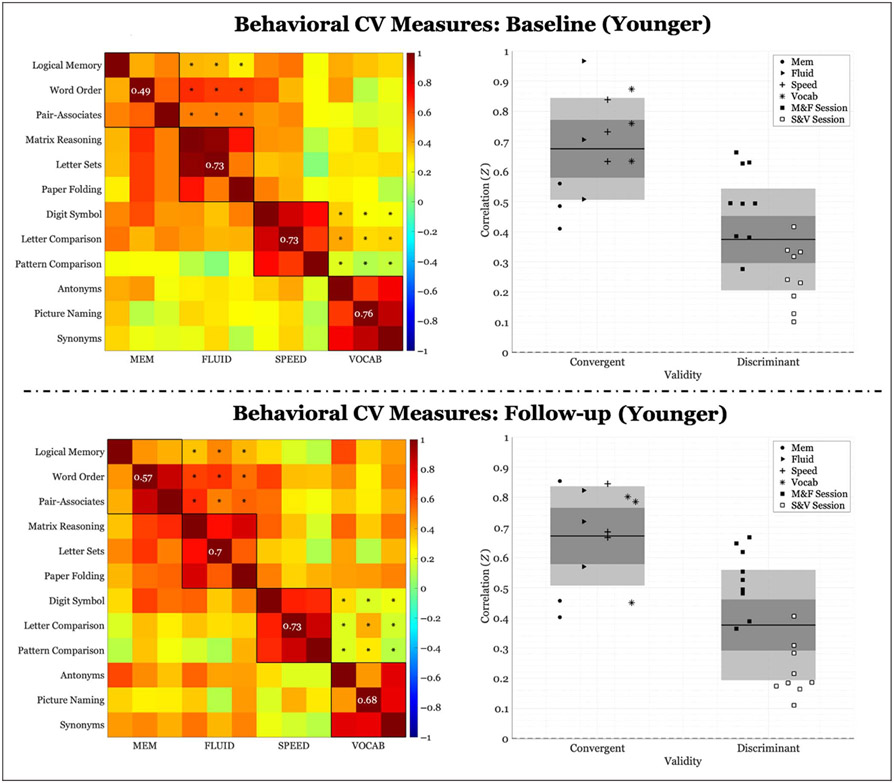
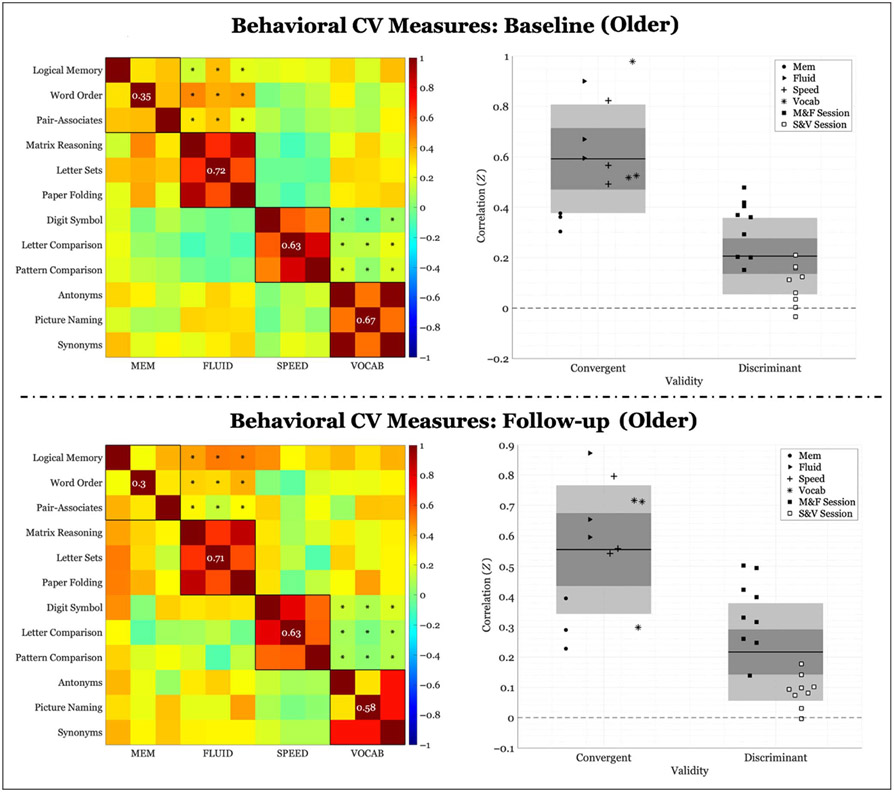
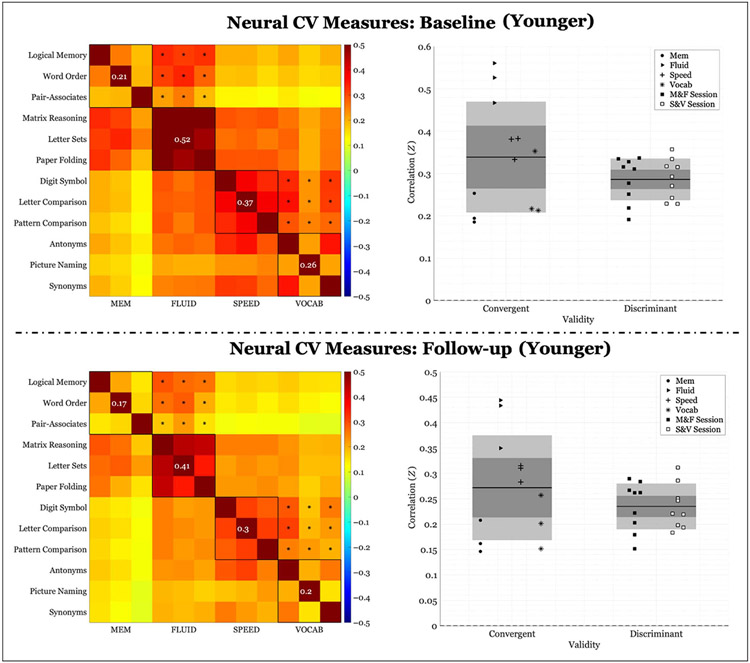
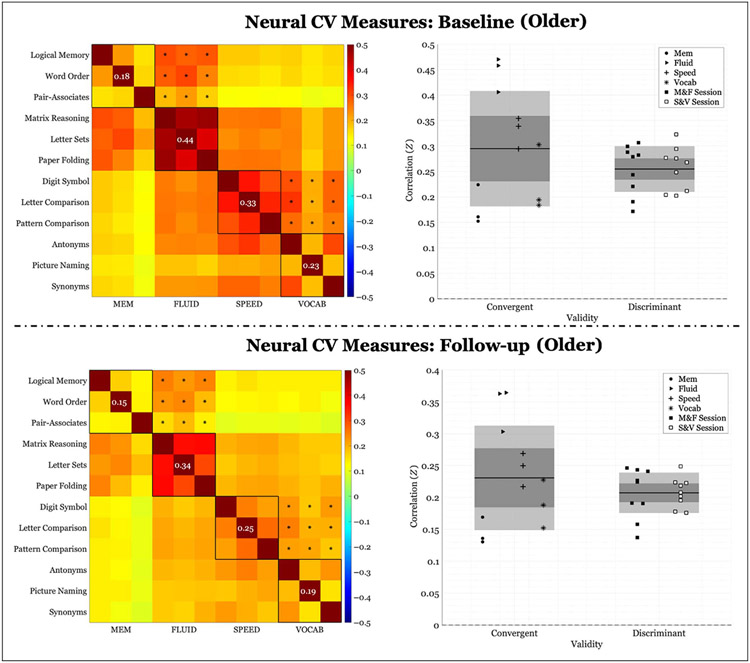
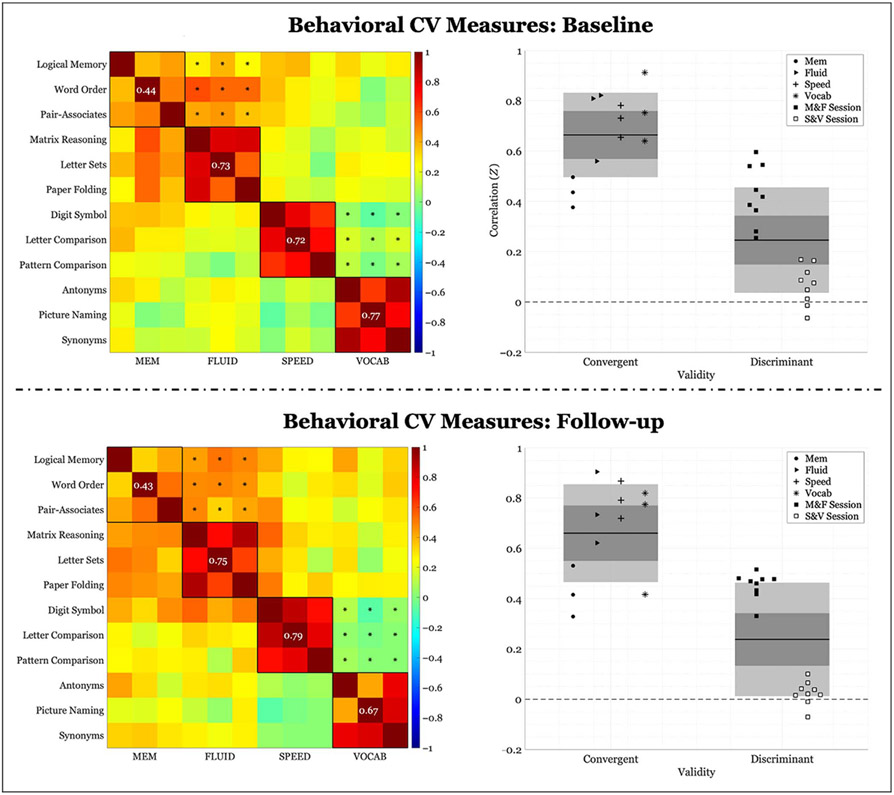
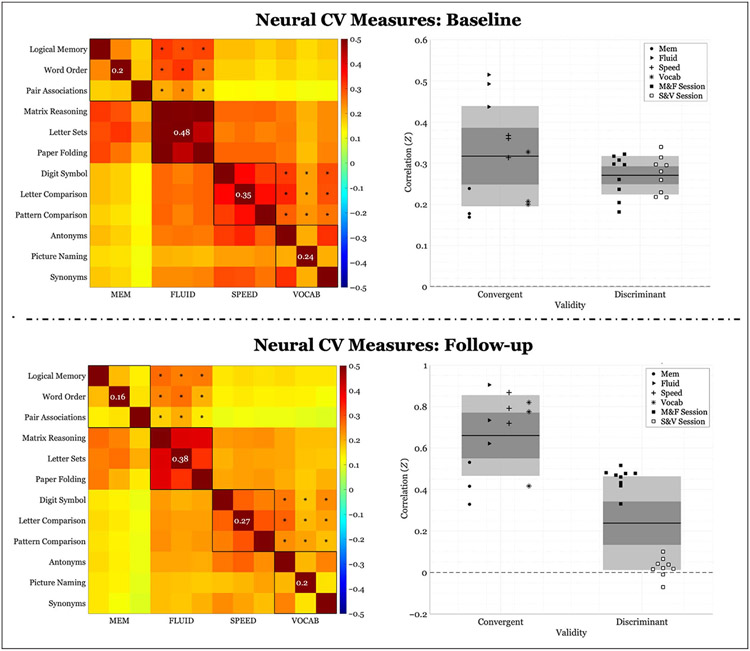
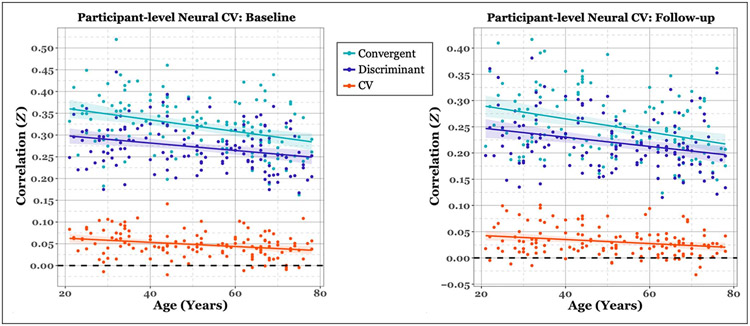
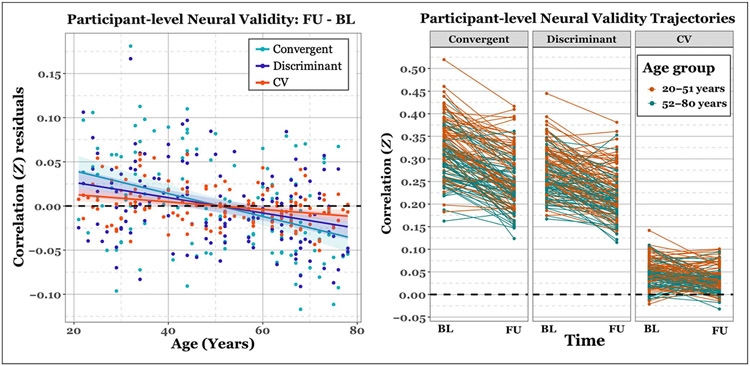
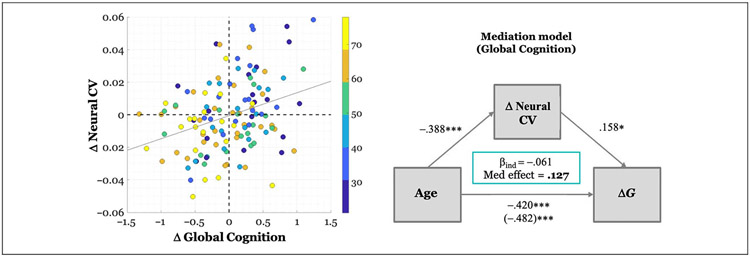
Some theories of aging have linked age-related cognitive decline to a reduction in distinctiveness of neural processing. Observed age-related correlation increases among disparate cognitive tasks have supported the dedifferentiation hypothesis. We previously showed cross-sectional evidence for age-related correlation decreases instead, supporting an alternative disintegration hypothesis. In the current study, we extended our previous research to a longitudinal sample. We tested 135 participants (20-80 years) at two time points-baseline and 5-year follow-up-on a battery of 12 in-scanner tests, each tapping one of four reference abilities. We performed between-tasks correlations within domain (convergent) and between domain (discriminant) at both the behavioral and neural level, calculating a single measure of construct validity (convergent - discriminant). Cross-sectionally, behavioral construct validity was significantly different from chance at each time point, but longitudinal change was not significant. Analysis by median age split revealed that older adults showed higher behavioral validity, driven by higher discriminant validity (lower between-tasks correlations). Participant-level neural validity decreased over time, with convergent validity consistently greater than discriminant validity; this finding was also observed at the cross-sectional level. In addition, a disproportionate decrease in neural validity with age remained significant after controlling for demographic factors. Factors predicting longitudinal changes in global cognition (mean performance across all 12 tasks) included age, change in neural validity, education, and National Adult Reading Test (premorbid intelligence). Change in neural validity partially mediated the effect of age on change in global cognition. Our findings support the theory of age-related disintegration, linking cognitive decline to changes in neural representations over time.


Figures

Figure A1.
Figure A1.
Behavioral correlations of within-domain (convergent) versus between-domains (discriminant) task performance for the younger group (< 52 years). Left panel: Fisher’s Z correlation matrix of all behavioral task pairings. Black outlined boxes indicate within-domain tasks. Centered values within each square indicate the average within-task correlation not considering a task’s perfect correlation with itself. Asterisks represent the between-tasks correlations used to compute discriminant validity. Right panel: scatter plots of Fisher’s Z coefficients divided by task pairing. For convergent validity, correlation coefficients are organized by domain; for discriminant validity, correlation coefficients are organized by session (see legend). “M&F” indicates between-domains correlations for memory and FLUID, and “S&V” indicates between-domains correlations for speed and VOCAB. The expanse of the box represents 1 SD, the shaded middle region represents the SEM for the 95% confidence interval, and the black line represents the mean.
Figure B1.
Figure B1.
Behavioral correlations of within-domain (convergent) versus between-domains (discriminant) task performance for the older group (> = 52 years). Left panel: Fisher’s Z correlation matrix of all behavioral task pairings. Black outlined boxes indicate within-domain tasks. Centered values within each square indicate the average within-task correlation not considering a task’s perfect correlation with itself. Asterisks represent the between-tasks correlations used to compute discriminant validity. Right panel: scatter plots of Fisher’s Z coefficients divided by task pairing. For convergent validity, correlation coefficients are organized by domain; for discriminant validity, correlation coefficients are organized by session (see legend). “M&F” indicates between-domains correlations for memory and FLUID, and “S&V” indicates between-domains correlations for speed and VOCAB. The expanse of the box represents 1 SD, the shaded middle region represents the SEM for the 95% confidence interval, and the black line represents the mean.
Figure C1.
Figure C1.
Neural correlations of within-domain (convergent) versus between-domains (discriminant) task performance averaged across participants belonging to the younger group (< 52 years). Left panel: Fisher’s Z correlation matrix of all task pairings of FC values. Black outlined boxes indicate within-domain tasks. Centered values within each square indicate the average within-task correlation not considering a task’s perfect correlation with itself. Asterisks represent the between-tasks correlations used to compute discriminant validity. Right panel: scatter plots of Fisher’s Z coefficients divided by task pairing. For convergent validity, correlation coefficients are organized by domain; for discriminant validity, correlation coefficients are organized by session (see legend). “M&F” indicates between-domains correlations for memory and FLUID, and “S&V” indicates between-domains correlations for speed and VOCAB. The expanse of the box represents 1 SD, the shaded middle region represents the SEM for the 95% confidence interval, and the black line represents the mean.
Figure D1.
Figure D1.
Neural correlations of within-domain (convergent) versus between-domains (discriminant) task performance averaged across participants belonging to the older group (> = 52 years). Left panel: Fisher’s Z correlation matrix of all task pairings of FC values. Black outlined boxes indicate within-domain tasks. Centered values within each square indicate the average within-task correlation not considering a task’s perfect correlation with itself. Asterisks represent the between-tasks correlations used to compute discriminant validity. Right panel: scatter plots of Fisher’s Z coefficients divided by task pairing. For convergent validity, correlation coefficients are organized by domain; for discriminant validity, correlation coefficients are organized by session (see legend). “M&F” indicates between-domains correlations for memory and FLUID, and “S&V” indicates between-domains correlations for speed and VOCAB. The expanse of the box represents 1 SD, the shaded middle region represents the SEM for the 95% confidence interval, and the black line represents the mean.
Figure 1.
Figure 1.
Behavioral correlations of within-domain (convergent) versus between-domains (discriminant) task performance. Left column: Fisher’s Z correlation matrix of all behavioral task pairings. Black outlined boxes indicate within-domain tasks. Centered values within each square indicate the average within-task correlation not considering a task’s perfect correlation with itself. Asterisks represent the between-tasks correlations used to compute discriminant validity, where only same session tasks were considered. Right column: scatter plots of Fisher’s Z coefficients divided by task pairing. For convergent validity, correlation coefficients are organized by domain; for discriminant validity, correlation coefficients are organized by the session from which they were calculated (see legend). “M&F” indicates between-domains correlations for memory and FLUID, and “S&V” indicates between-domains correlations for speed and VOCAB. The expanse of the box represents 1 SD, the shaded middle region represents the SEM for the 95% confidence interval, and the black line represents the mean.
Figure 2.
Figure 2.
Neural correlations of within-domain (convergent) versus between-domains (discriminant) task performance averaged across participants. Left column: Fisher’s Z correlation matrix of all task pairings of FC values. Black outlined boxes indicate within-domain tasks. Centered values within each square indicate the average within-task correlation not considering a task’s perfect correlation with itself. Asterisks represent the between-tasks correlations used to compute discriminant validity, where only same session tasks were considered. Right column: scatter plots of Fisher’s Z coefficients divided by task pairing. For convergent validity, correlation coefficients are organized by domain; for discriminant validity, correlation coefficients are organized by the session from which they were calculated (see legend). “M&F” indicates between-domains correlations for memory and FLUID, and “S&V” indicates between-domains correlations for speed and VOCAB. The expanse of the box represents 1 SD, the shaded middle region represents the SEM for the 95% confidence interval, and the black line represents the mean.
Figure 3.
Figure 3.
Scatter plot of cross-sectional neural validity measures for each time point. Validity measures are plotted per participant as a function of baseline age. Colored lines represent the least-squares fit per measure. Colored ribbons represent the standard error around the mean. As can be observed, there is a negative relationship between validity measures and age.
Figure 4.
Figure 4.
Plots of longitudinal neural validity measures. Left column: Scatter plot of the difference in validity measures (FU – BL) per participant as a function of baseline age and reflect the residuals after adjusting for baseline values. Colored lines represent the least-squares fit per measure. Colored ribbons represent the standard error around the mean. As can be observed, there is a negative relationship between age and longitudinal change in each validity measure. Right panel: spaghetti plot of participant-level trajectories between each time point. Plots are divided by validity type. Colored lines and dots represent the age group to which each participant belongs based on median age split.
Figure 5.
Figure 5.
Relationship between baseline age, ΔNeural CV, and change in Global Cognition (ΔG). Left column: scatter plot where each dot represents participant’s Δneural CV and ΔG value. The color of the dot depicts the age band to which the participant belongs. ΔG values have been adjusted for baseline behavior, NART, education, and sex and thus represent the raw residuals after this adjustment. Δ neural CV values have been adjusted for baseline CV. The gray line represents the least-squares fit (β = .242). Right column: Mediation model illustrating model parameters. The model has been adjusted for NART, education, and sex. Values along arrows represent standardized beta coefficients for the indirect and direct effects. The total effect of age on ΔG, after covariate adjustment and with or without mediator inclusion, respectively, is represented in parentheses. The beta coefficient for the indirect mediating effect of ΔG (i.e., βind) as well as the proportion of the effect that is mediated is reported in the green box.

Similar articles

References

    1. Akaike H. (1973). Maximum likelihood identification of Gaussian autoregressive moving average models. Biometrika, 60, 255–265. 10.1093/biomet/60.2.255 - DOI
    1. Anstey KJ, Hofer SM, & Luszcz MA (2003). Cross-sectional and longitudinal patterns of dedifferentiation in late-life cognitive and sensory function: The effects of age, ability, attrition, and occasion of measurement. Journal of Experimental Psychology: General, 132, 470–487. 10.1037/0096-3445.1323.470 - DOI - PubMed
    1. Antonenko D, & Flöel A (2013). Healthy aging by staying selectively connected: A mini-review. Gerontology, 60, 3–9. 10.1159/000354376 - DOI - PubMed
    1. Argiris G, Stern Y, & Habeck C (2021). Age-related disintegration in functional connectivity: Evidence from Reference Ability Neural Network (RANN) Cohort. Neuropsychologia, 156, 107856. 10.1016/j.neuropsychologia.2021.107856 - DOI - PMC - PubMed
    1. Baltes PB, & Lindenberger U (1997). Emergence of a powerful connection between sensory and cognitive functions across the adult life span: A new window to the study of cognitive aging? Psychology and Aging, 12, 12–21. 10.1037/0882-7974.12.1.12 - DOI - PubMed

Publication types