. 2024 May 13;15(1):3297.
doi: 10.1038/s41467-024-47516-w.

Platelets favor the outgrowth of established metastases

Affiliations

Platelets favor the outgrowth of established metastases

Maria J Garcia-Leon et al. Nat Commun. .

Abstract

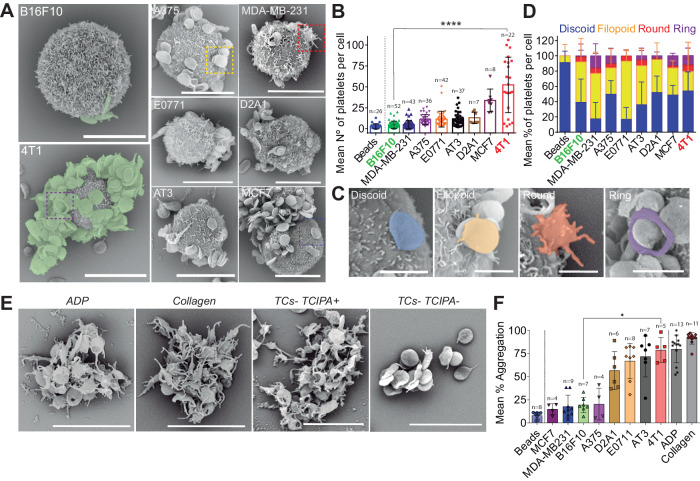
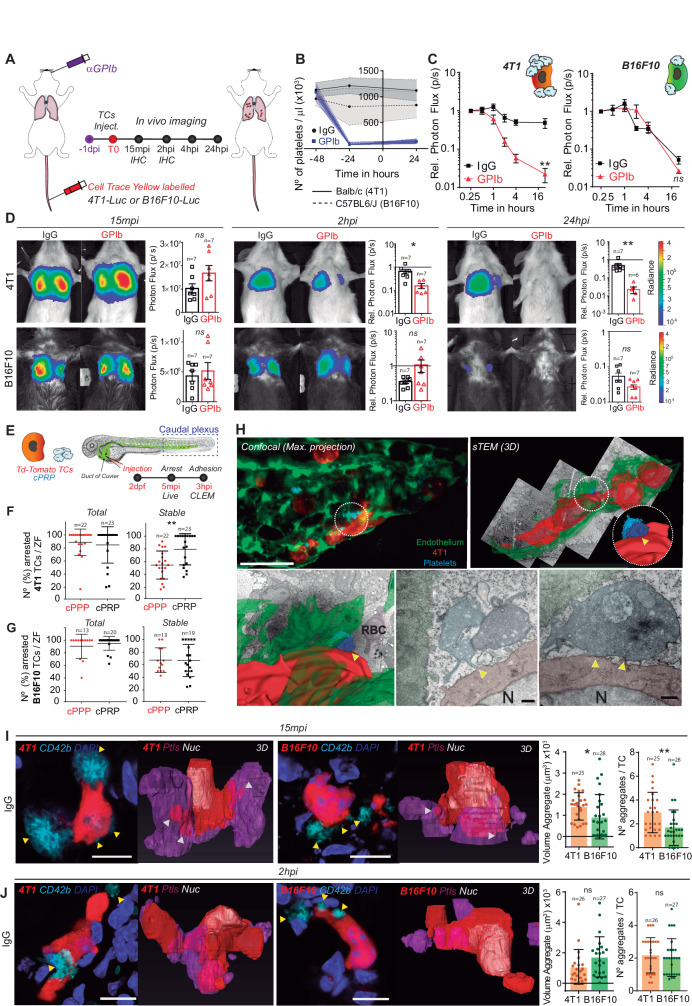
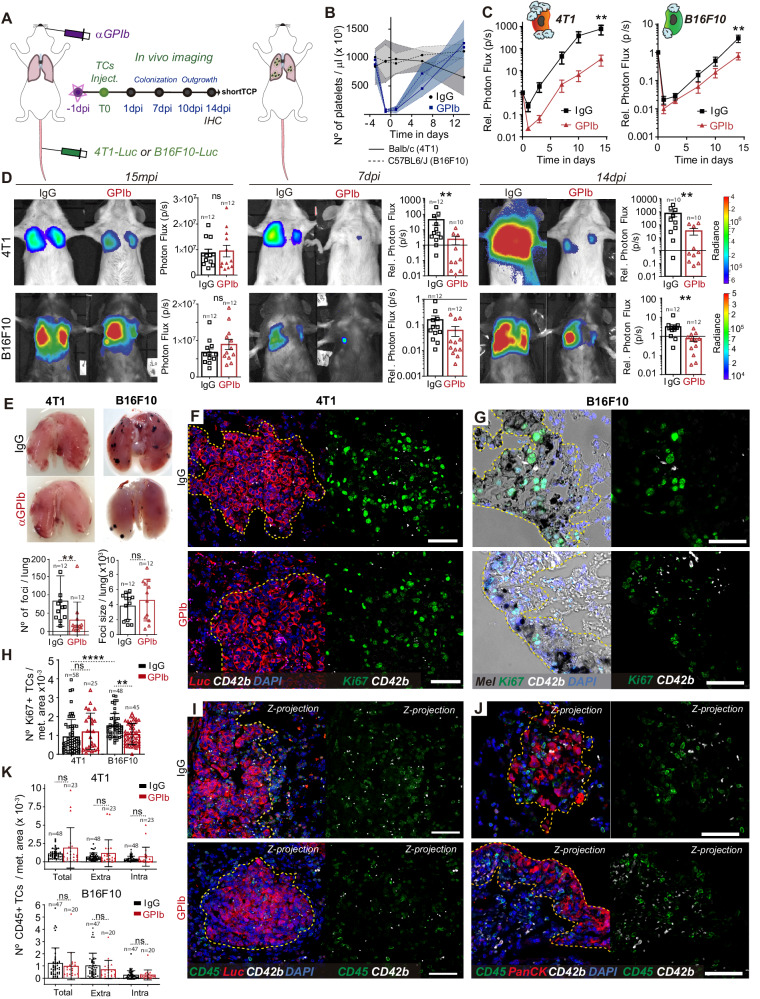
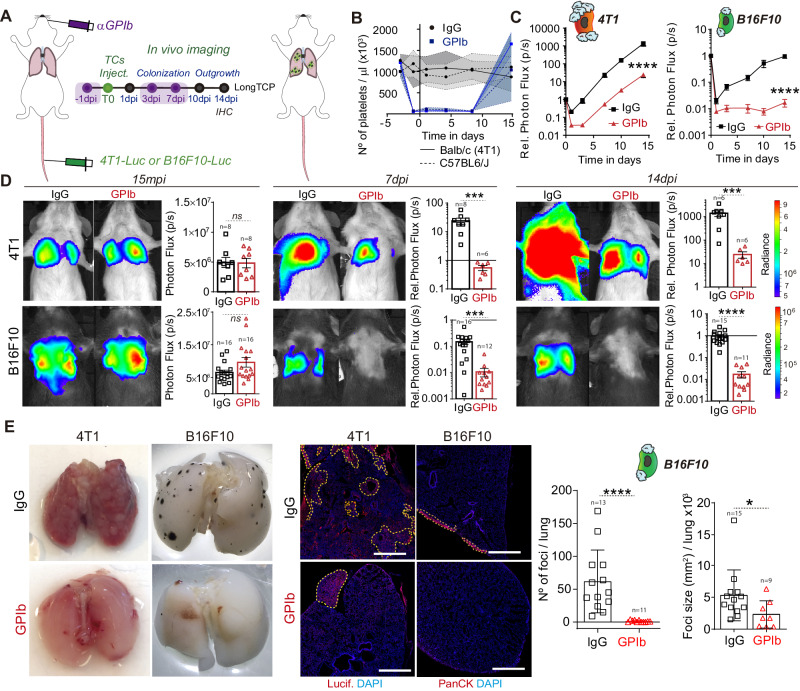
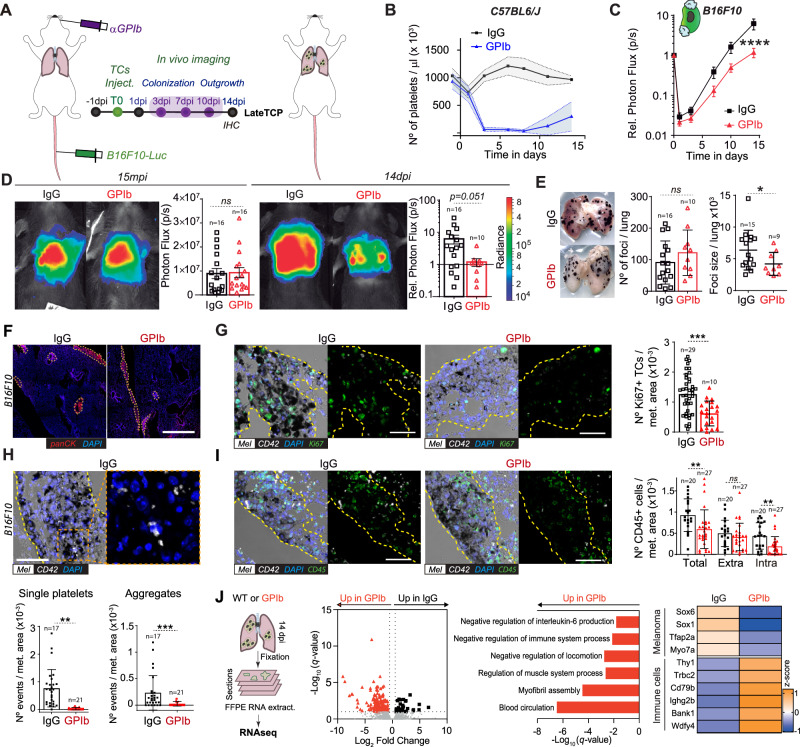
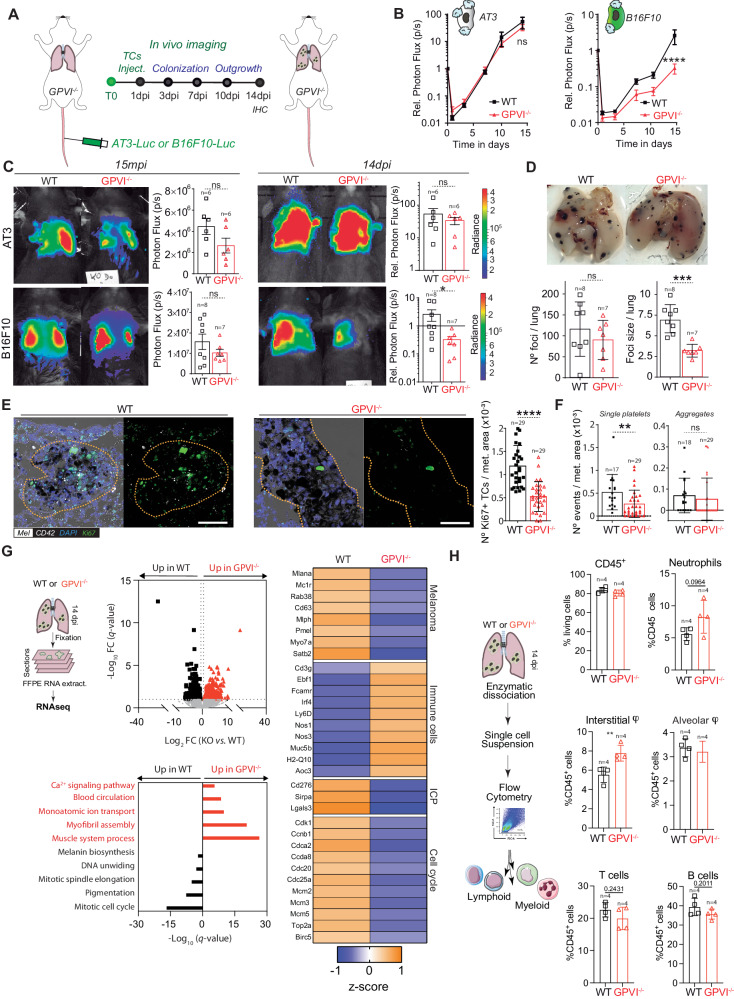
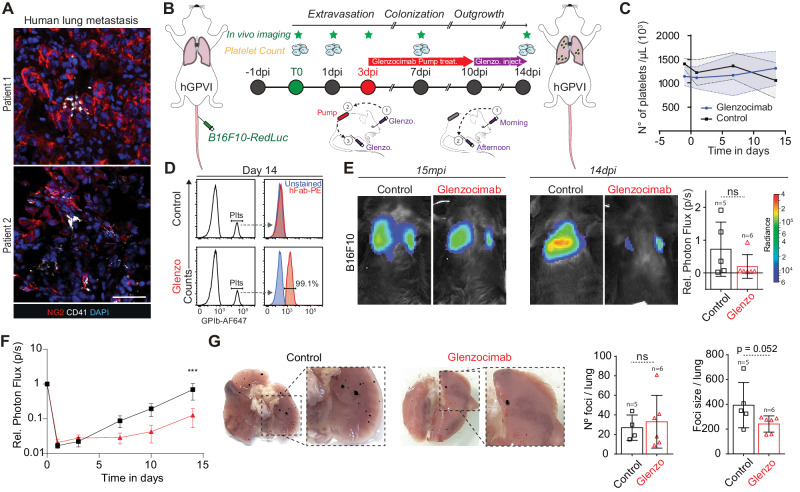
Despite abundant evidence demonstrating that platelets foster metastasis, anti-platelet agents have low therapeutic potential due to the risk of hemorrhages. In addition, whether platelets can regulate metastasis at the late stages of the disease remains unknown. In this study, we subject syngeneic models of metastasis to various thrombocytopenic regimes to show that platelets provide a biphasic contribution to metastasis. While potent intravascular binding of platelets to tumor cells efficiently promotes metastasis, platelets further support the outgrowth of established metastases via immune suppression. Genetic depletion and pharmacological targeting of the glycoprotein VI (GPVI) platelet-specific receptor in humanized mouse models efficiently reduce the growth of established metastases, independently of active platelet binding to tumor cells in the bloodstream. Our study demonstrates therapeutic efficacy when targeting animals bearing growing metastases. It further identifies GPVI as a molecular target whose inhibition can impair metastasis without inducing collateral hemostatic perturbations.


Conflict of interest statement

M.P.J. is a scientific co-founder of Acticor Biotech and a scientific adviser. All other authors declare no competing interests.

Figures

Fig. 1
Fig. 1. TCs bind and aggregate blood platelets with different efficiencies.
A SEM images of TCs interacting with mouse platelets contained within mouse citrated platelet-rich plasma (cPRP). Mouse breast carcinoma (4T1) and mouse melanoma (B16F10) cells are highlighted. Scale bar: 10 μm. B Platelet binding profiles quantification graph of A. Number of platelets per cell for n cells (the number of cells per cell line analyzed are displayed above the histogram) are shown as mean ± SD and analyzed using Kruskal–Wallis with False discovery rate post-test (1 experiment was performed for MDA-MB-231, E0771 and D2A1, 2 for MCF7 and A375, and 3 for AT3 and B16F10), q < 0.0001. C SEM images of TC-bound platelets at different activation states including discoid (resting), filopodia (low activation), round (full activation) and ring-shaped platelets (unknown function). Scale bar: 2 μm. D Platelet shape profiles quantification graph of C. Relative amount platelet shape per TCs for n cells or beads (beads n = 22, B16F10 n = 48, MDA-MB-231 n = 38, A375 n = 36, E0771 n = 42, AT3 n = 37, D2A1 n = 8, MCF7 n = 8, 4T1 n = 21) are shown as mean ± SD (2 and 6 independent experiments were performed for 4T1 and B16F10, respectively); activation stages are color-coded. E SEM images of mouse platelet aggregates after platelet aggregation assay using cPRP with ADP and collagen as classic agonists, and 4T1 and B16F10 TCs TCIPA+ or TCIPA− cells. Scale bar: 8 μm. F Platelet aggregation quantification graph of E. Relative human cPRP platelet aggregation for n aggregation curves (the number of aggregation curves per cell line analyzed are displayed above the histogram) are shown as mean ± SD and analyzed using Kruskal–Wallis with False discovery rate post-test, four independent aggregation experiments were performed, q = 0.014. Source data are provided as a Source Data file.
Fig. 2
Fig. 2. In vivo lung seeding of 4T1 or B16F10 TCs is differentially influenced by platelets.
A Infographics showing the experimental setting. B Graph showing platelet counts on IgG- and GPIb-treated BALB/c and C57BL6/J animals, as mean ± SD (n = 7 mice per group, 2 independent experiments were performed). C Relative bioluminescence kinetics of 4T1-Luc and B16F10-RedLuc TCs lung seeding during 24 hours in normal and TCP mice (n = 7 mice per group) are shown as mean ± SEM and analyzed using two-way ANOVA with False discovery rate post-test (2 independent experiments were performed), q = 0.0028. D Representative images and timepoint comparisons of relative lung bioluminescence in control versus TCP animals in 4T1 (up) and B16F10 (down) TCs models. Lung bioluminescence quantifications of n mice (the number of mice analyzed is displayed above the histogram) are shown as mean ± SEM and analyzed using two-sided Mann–Whitney test (two independent experiments were performed), 4T1 2hpi p = 0.0047, 24hpi p = 0.0012. E Infographics showing the experimental setting to study the early steps of the metastatic cascade in vivo in the ZF embryo. F, G Quantification of total and stable arrest of 4T1 (F) and B16F10 (G) cells in the caudal plexus of the ZF embryo during 5 minutes of live video microscopy. Arrested TCs of n ZF embryos (the number of ZF embryos analyzed are displayed above the dot plots) are shown as mean ± SD and analyzed using two-sided Mann–Whitney test (4 independent experiments were performed), p = 0.0034. H Representative confocal and CLEM images of 4T1 cells arrested intravascularly in the caudal plexus of the ZF embryo after 3hpi. Arrowheads indicate contact between platelets and TCs. Scale: 50 μm (confocal); 500 nm (CLEM). I, J Representative confocal images of single 4T1 or B16F10 cells arrested in mouse lungs at 15mpi (I) and 2hpi (J). Arrowheads show the interaction of single platelets and platelet aggregates with the TCs. Scale bar: 10 μm. On the right, the volume and number of platelet aggregates around the arrested TCs is shown. Platelet and TCs volumes were calculated upon segmentation of TCs (n values are displayed above the histograms) and platelets using the AMIRA software and are shown as mean ± SD and analyzed using two-sided Mann–Whitney test (1 experiment with 3 mice was performed for each timepoint), (I) p = 0.034 and p = 0.002. Source data are provided as a Source Data file.
Fig. 3
Fig. 3. Long-term TCs metastatic potential is defined by the early TC-Platelet interplay.
A Infographics showing the experimental setting. B Graph showing platelet counts on IgG- and α-GPIb-treated BALB/c and C57BL6/J animals shown as mean ± SD. C Relative bioluminescent kinetics of 4T1-Luc and B16F10-RedLuc TCs lung seeding and outgrowth in IgG and shortTCP mice (n = 12 mice per groups) are shown as mean ± SEM and analyzed using two-way ANOVA with False discovery rate post-test (2 independent experiments were performed), 4T1 q = 0.0022, B16F10 q = 0.0041. D Representative images and timepoint (15mpi, 7dpi, and 14dpi) comparisons of total lung bioluminescence in IgG versus shortTCP animals in 4T1 (up) and B16F10 (down) TCs models. Lung bioluminescence quantifications of n mice (the number of mice analyzed is displayed above the histogram) are shown as mean ± SEM and analyzed using two-sided Mann–Whitney test (2 independent experiments were performed), 4T1 7dpi p = 0.0071, 14dpi p = 0.00889, B16F10 14dpi p = 0.0011. E Macroscopic analysis of mice lungs at 14dpi. Images show IgG and α-GPIb-treated lungs with 4T1 or B16F10 metastatic foci. B16F10 foci number (left) and size (right) quantifications of n mice (n = 12 per group, also displayed above the histogram) are shown as mean ± SD and analyzed using two-sided Mann–Whitney test (2 independent experiments were performed), p = 0.0017. F, G Representative images from paraffine-stained IgG and shortTCP BALB/c-4T1 lungs (F) and C57BL6/J-B16F10 (G) at 14dpi probed against the proliferation marker Ki67 (green) and the platelet receptor CD42b (white). Scale bar: 50 μm. H Number of Ki67+ cells (number of images analyzed are displayed above the histogram) per metastatic area defined by α-pan-cytokeratin (4T1, F) staining or intrinsic melanin expression (B16F10, G) are shown as mean ± SD and analyzed using Kruskal–Wallis with False discovery rate post-test (two independent experiments were performed), q = 0.0001 and q = 0.0095. I, J Representative images from paraffin-stained IgG and shortTCP BALB/c-4T1 (I) and C57BL6/J-B16F10 (J) lungs at 14dpi probed against the hematopoietic lineage marker CD45 (green) and the platelet receptor CD42b antibodies (white). Scale bar: 50 μm. K Total, intra-metastatic, and extra-metastatic number of CD45+ cells (number of images analyzed are displayed above the histogram) per metastatic area defined by α-Luc (4T1, I) or α-pan-cytokeratin staining (B16F10, J) are shown as mean ± SD and analyzed using Mann–Whitney test (2 independent experiments were performed). Source data are provided as a Source Data file.
Fig. 4
Fig. 4. Platelets contributes to metastatic outgrowth of already formed 4T1 and B16F10 metastatic foci.
A Infographics showing the experimental setting. B Graph showing platelet counts on IgG- and α-GPIb-treated BALB/c and C57BL6/J animals shown as mean ± SD. C Relative bioluminescence kinetics of 4T1-Luc and B16F10-RedLuc TCs lung seeding and outgrowth in IgG and long TCP mice (n = 8 mice per group for 4T1-Luc experiments, n = 16 per group for B16F10-RedLuc experiments) are shown as mean ± SEM and analyzed using two-way ANOVA with False discovery rate post-test (1 and 2 independent experiments were performed for 4T1 and B16F10 respectively), 4T1 q = 0.0001, B16F10 q = 0.0001. D Representative images and timepoint quantifications (15mpi, 7dpi, and 14dpi) of total lung bioluminescence in control versus long TCP animals in 4T1 (up) and B16F10 (down) TCs models. Lung bioluminescence quantifications of n mice (the number of mice analyzed is displayed above the histograms) are shown as mean ± SEM and analyzed using two-sided Mann–Whitney test (2 independent experiments were performed), 4T1 7dpi p = 0.0007, 14dpi p = 0.0007; B16F10 7dpi p = 0.0001, 14dpi p = 0.0001. E Macroscopic analysis of mice lungs at 14dpi (left) and low magnification confocal images of lung metastases defined by luciferase (4T1) or pan-cytokeratin (B16F10) staining at 14dpi (center). Scale bar: 500 μm. B16F10 foci number and size (number of mice analyzed per group are displayed above the histogram) are shown as mean ± SD (right panel) and analyzed using two-sided Mann–Whitney test (2 independent experiments were performed), foci number p = 0.0001, foci size p = 0.029. Source data are provided as a Source Data file.
Fig. 5
Fig. 5. Platelets significantly influence the late outgrowth of B16F10 metastatic foci but not 4T1 ones.
A Infographics of the experimental scheme. B Graph of platelet counts of IgG- and α-GPIb-treated animals are shown as mean ± SD. C Relative bioluminescence kinetics of B16F10-RedLuc TCs lung seeding and outgrowth in IgG and late TCP mice (n = 16 per group) are shown as mean ± SEM and analyzed using two-way ANOVA with False discovery rate post-test (2 independent experiments were performed), p = 0.0001. D Representative images and timepoint comparisons (15mpi and 14dpi) of total lung bioluminescence in control versus late TCP animals in B16F10 TCs models. Lung bioluminescence quantifications of n mice (the number of mice analyzed is displayed above the histogram) are shown as mean ± SD and analyzed using two-sided Mann–Whitney test (2 independent experiments were performed), 14dpi p = 0.0513. E Macroscopic analysis of mice lungs at 14dpi. Images show IgG- and α-GPIb-treated lungs with B16F10 metastatic foci (number of mice analyzed per group are displayed above the histogram). B16F10 foci number and mean foci size are presented as mean ± SD and analyzed using two-sided Mann–Whitney test (2 independent experiment were performed), foci size p = 0.0401. F Low magnification confocal images of lung metastases defined by pan-cytokeratin staining at day 14 post injection. Scale bar: 500 μm. GI Immunohistochemical analysis of IgG and late TCP mice lungs at 14dpi. G Representative images of lung sections from IgG and late TCP B16F10 probed against the proliferation marker Ki67 (green), the platelet receptor CD42b (white) and intrinsic melanin expression (black). Scale bar: 50 μm. Total number of images analyzed are displayed above the histogram. Number of Ki67+ cells per metastatic area are shown as mean ± SD and analyzed using two-sided Mann–Whitney test (2 independent experiments were performed), p = 0.0097. H Representative images of lung sections from IgG and late TCP B16F10 probed against the platelet receptor CD42b (white). Scale bar: 50 μm. Total number of images analyzed are displayed above the histograms. Single platelet (≤3) and platelet aggregates (>3) per metastatic area are shown as mean ± SD and analyzed using two-sided Mann–Whitney test (2 independent experiments were performed), single p = 0.0065, aggregates p = 0.0002. I Representative images of lung sections from IgG and late TCP B16F10 probed against the hematopoietic lineage marker CD45 (green), the platelet receptor CD42b (white), and intrinsic melanin expression (black). Scale bar: 50 μm. Total number of images analyzed are displayed above the histogram. Total, intra-metastatic, and extra-metastatic number of CD45+ cells per metastatic area defined by melanin are shown as mean ± SD and analyzed using Mann–Whitney analysis (2 independent experiments were performed), total p = 0.0016, intra p = 0.0058. J FFPE-RNASeq analysis. From the left: representative infographics of the experimental scheme; volcano plot of genes differentially regulated in IgG and α-GPIb-treated mice; GO terms assignment of α-GPIb-derived samples upregulated genes; z scoring comparing IgG and α-GPIb samples for selected genes. Data are representative of three mice per group from two independent experiments. Source data are provided as a Source Data file.
Fig. 6
Fig. 6. GPVI receptor-mediated platelets’ metastatic outgrowth effect.
A Infographics showing the experimental setting. B Relative bioluminescence kinetics of AT3-RedFluc-L2 and B16F10-RedLuc TCs lung seeding and outgrowth in WT and GPVI−/− mice (n = 6 mice per group for AT3, n = 7 or 8 respectively for WT or GPVI−/− group for B16F10) are shown as mean ± SEM and analyzed using two-way ANOVA with False discovery rate post-test (1 experiment was performed), B16F10 q = 0.0001. C Representative images and timepoint comparisons (15mpi, left; 14dpi, right) of total lung bioluminescence in WT versus GPVI−/− depleted animals in AT3 (up) and B16F10 (down) TCs models. Lung bioluminescence quantifications of n mice (the number of mice analyzed is displayed above the histogram) are shown as mean ± SD and analyzed using two-sided Mann–Whitney test (1 experiment was performed), B16F10 14dpi p = 0.0289. D Macroscopic analysis of mice lungs injected with B16F10 cells at 14dpi. Pictures of WT (left) and GPVI−/− (right) lungs are show. B16F10 foci number and size are shown as mean ± SD and analyzed using two-sided Mann–Whitney test (1 experiment was performed, number of mice analyzed per group are displayed above the histogram), foci size p = 0.003. E Representative zoomed images of the immunohistochemical analysis of lung tissue sections of WT and GPVI−/− mice probed against the proliferation marker Ki67 (green), the platelet receptor CD42b (white), and intrinsic melanin expression (black). Scale bar: 50 μm. Total number of lung sections analyzed is displayed above the histogram. Number of Ki67+ cells per metastatic area are shown as mean ± SD and analyzed using two-sided Mann–Whitney test (1 experiment was performed), p = 0.0001. F Number of intra-metastatic platelets (from E, total number of lung sections analyzed are displayed above the histogram) per metastatic area in WT and GPVI−/− animals are shown as mean ± SD and analyzed using two-sided Mann–Whitney test (1 experiment was performed), p = 0.0045. G FFPE RNASeq analysis. From the left: representative infographics of the experimental scheme; volcano plot of genes differentially regulated in WT and GPVI−/−; GO terms assignment of WT and GPVI−/− upregulated genes; z-scoring comparing WT and GPVI−/− samples for selected genes. Data are representative of 3 mice per group from 2 independent experiments. H Ex vivo lungs immunophenotyping. Left: Infographics describing the experimental scheme. Right: percentage of relative immune cells populations as assessed by flow cytometry analysis 14dpi. Data are represented as mean ± SD and analyzed using two-sided Student test (n = 4 mice per group, 1 experiment was performed, interstitial macrophage p = 0.0078). Source data are provided as a Source Data file.
Fig. 7
Fig. 7. Therapeutic targeting of the human GPVI receptor impairs metastatic outgrowth of established foci.
A Representative confocal images of human biopsies from melanoma metastases (patient1 and patient2) probed against the melanoma marker NG2 (red) and the platelet marker CD41 (white). Scale bar: 50 μm. B Infographics showing the experimental setting. Glenzocimab administration is performed via subcutaneous osmotic pumps from 3dpi to 10 dpi (red arrow) then continued by morning retro-orbital (1) and afternoon intra-peritoneal (2) injection until 14dpi. C Graph showing platelet counts in control and Glenzocimab-treated animals (n = 5 mice in the control group, n = 6 in the Glenzocimab group) and shown as mean ± SD. D Flow cytometry analysis of mouse platelets labeled ex vivo. Left: electronic gating strategy on platelets labeled with α-GPIb-647. Right: ex vivo platelets staining with anti-human (Fab)–PE-labeled antibody at 14dpi. E Representative images and timepoint (15mpi and 14dpi) comparisons of total lung bioluminescence in control versus Glenzocimab-treated animals. Day 14 lung bioluminescence quantifications of n mice (the number of mice analyzed are displayed above the histogram) are shown as mean ± SD and analyzed using two-sided Mann–Whitney test (2 independent experiments were performed). F Relative bioluminescence kinetics of B16F10-RedLuc TCs lung seeding and outgrowth in isotype or glenzocimab-treated mice (n = 5 mice in the control group, n = 6 in the Glenzocimab group) are shown as mean ± SEM and analyzed using two-way ANOVA with False discovery rate post-test (2 independent experiments were performed), q = 0.0007. G Macroscopic analysis of lungs from mice injected with B16F10 cells at 14dpi. Pictures of control (left) and glenzocimab-treated (right) lungs are shown. B16F10 foci number and size are shown as mean ± SD and analyzed using two-sided Mann–Whitney test (2 independent experiments were performed, number of mice analyzed per group is displayed above the histogram). Source data are provided as a Source Data file.

References

    1. Follain G, et al. Fluids and their mechanics in tumour transit: shaping metastasis. Nat. Rev. Cancer. 2020;20:107–124. doi: 10.1038/s41568-019-0221-x. - DOI - PubMed
    1. Follain G, et al. Hemodynamic forces tune the arrest, adhesion, and extravasation of circulating tumor cells. Dev. Cell. 2018;45:33–52.e12. doi: 10.1016/j.devcel.2018.02.015. - DOI - PubMed
    1. Osmani N, et al. Metastatic tumor cells exploit their adhesion repertoire to counteract shear forces during intravascular arrest. Cell Rep. 2019;28:2491–2500.e5. doi: 10.1016/j.celrep.2019.07.102. - DOI - PubMed
    1. Osmani, N. et al. Probing intravascular adhesion and extravasation of tumor cells with microfluidics. Methods Mol. Biol. 2294, 111–132 (2021). - PubMed
    1. Aceto N, et al. Circulating tumor cell clusters are oligoclonal precursors of breast cancer metastasis. Cell. 2014;158:1110–1122. doi: 10.1016/j.cell.2014.07.013. - DOI - PMC - PubMed

Substances