. 2024 May 13;15(1):3818.
doi: 10.1038/s41467-024-47106-w.

A cell-free nutrient-supplemented perfusate allows four-day ex vivo metabolic preservation of human kidneys

Affiliations

A cell-free nutrient-supplemented perfusate allows four-day ex vivo metabolic preservation of human kidneys

Marlon J A de Haan et al. Nat Commun. .

Abstract

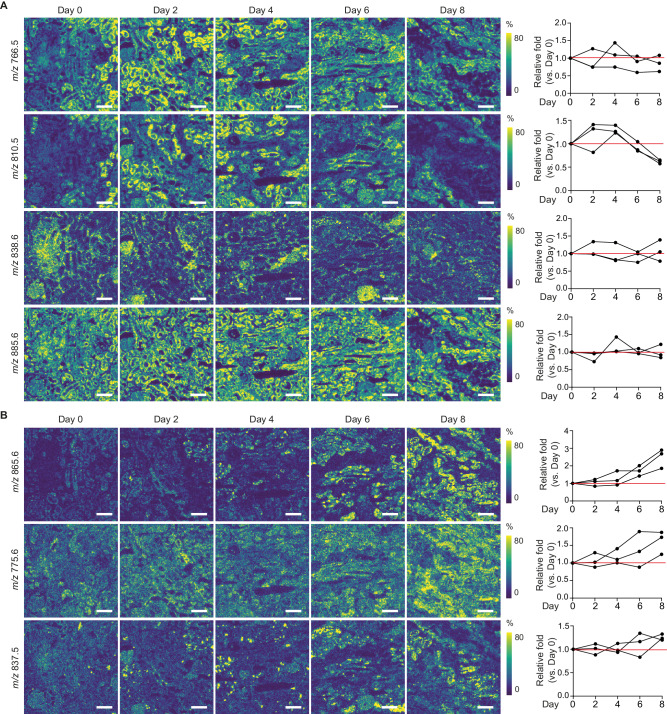
The growing disparity between the demand for transplants and the available donor supply, coupled with an aging donor population and increasing prevalence of chronic diseases, highlights the urgent need for the development of platforms enabling reconditioning, repair, and regeneration of deceased donor organs. This necessitates the ability to preserve metabolically active kidneys ex vivo for days. However, current kidney normothermic machine perfusion (NMP) approaches allow metabolic preservation only for hours. Here we show that human kidneys discarded for transplantation can be preserved in a metabolically active state up to 4 days when perfused with a cell-free perfusate supplemented with TCA cycle intermediates at subnormothermia (25 °C). Using spatially resolved isotope tracing we demonstrate preserved metabolic fluxes in the kidney microenvironment up to Day 4 of perfusion. Beyond Day 4, significant changes were observed in renal cell populations through spatial lipidomics, and increases in injury markers such as LDH, NGAL and oxidized lipids. Finally, we demonstrate that perfused kidneys maintain functional parameters up to Day 4. Collectively, these findings provide evidence that this approach enables metabolic and functional preservation of human kidneys over multiple days, establishing a solid foundation for future clinical investigations.


Conflict of interest statement

The authors declare no competing interests.

Figures

Fig. 1
Fig. 1. Perfusion dynamics during 8-day subnormothermic culture of human kidneys.
Three discarded human kidneys were cultured for an 8-day period. A Schematic overview of organ culture platform. Kidneys were preserved in a custom-designed organ chamber. A pressure controlled centrifugal pump set at 75 mmHg perfused the renal artery with acellular perfusate after it passed through an oxygenator. Perfusion temperature was maintained at subnormothermia (25 °C) throughout the entire culture period. Arterial, venous and ureteral cannulation allowed continuous assessment of perfusion parameters. Urine was recirculated. Continuous hemofiltration allowed removal of small molecular weight waste products and substitution with fresh solution. Renal flow (B) and vascular resistance (C) throughout the 8-day period. DG Metabolic perfusate dynamics throughout the 8-day period. Oxygen delivery as calculated from the pO2 in the arterial inflow and oxygen uptake as calculated from the delta pO2 between the arterial inflow and venous outflow (D). Perfusate pH (E), perfusate lactate (F), and perfusate glucose (G) as measured in the arterial inflow. HK, Perfusate injury markers throughout the 8-day period. Perfusate LDH (H) as marker for general cell damage. Perfusate KIM1 (I) and perfusate NGAL (J) as markers for proximal tubular and distal tubular injury, respectively. Because urine is recirculated tubular injury markers were measured within the perfusate (arterial inflow). Perfusate potassium as marker for general cell damage (K). L Weight gain (%) after the 8-day period. M Macroscopic appearance of discarded human kidneys throughout the 8-day period. One out of three representative kidneys shown. N Representative images of PAS histology on cortex biopsies (n = 3 perfusions with biopsies taken at Day 0, Day 2, Day 4, Day 6 and Day 8 from each kidney). Black arrows highlight areas that demonstrate loss of tubular lumen. Bars represent 100 µm. Source data are provided as a Source Data file.
Fig. 2
Fig. 2. Spatial lipidomics reveals epithelial phenotypic remodeling during 8-day subnormothermic culture of human kidneys.
A Lipid heterogeneity in biopsies taken at different timepoints (Day 0, Day 2, Day 4, Day 6, Day 8) from human kidneys (n = 3) throughout the 8-day culture period allows identification of the main epithelial cell types, visualized in UMAP plot of MALDI-MSI data (5 × 5 µm2 pixel size). Sub clustering of ECAD+ tubular cells (B), podocytes (C), and proximal tubular cells (PT) (D) displays different epithelial phenotypes within each cell type. Dot plots display expression of cluster-specific lipid features. E Percentage of each ECAD+ tubular phenotype in biopsies taken at different timepoints during 8-day culture. F Hierarchical clustering of the percentage of ECAD+ tubular phenotypes in biopsies taken at different timepoints. G Percentage of each podocyte phenotype in biopsies taken at different timepoints during 8-day culture. H Hierarchical clustering of the percentage of podocyte phenotypes in biopsies taken at different timepoints. I Percentage of each tubular PT phenotype in biopsies taken at different timepoints during 8-day culture. J Hierarchical clustering of the percentage of PT tubular phenotypes in biopsies taken at different timepoints. K Immunofluorescence staining on post-MALDI-MSI samples taken at different timepoints during 8-day organ culture (top panel). Spatial segmentation showing distribution of different renal epithelial phenotypes (bottom panel) (n = 3 perfusions with biopsies taken at Day 0, Day 2, Day 4, Day 6 and Day 8 from each kidney). White arrows highlight the area of PT_3. Bars represent 200 μm. Source data are provided as a Source Data file.
Fig. 3
Fig. 3. Spatial lipid species distribution changes during 8-day subnormothermic culture of human kidneys.
A Representative images demonstrate changes in spatial distribution of lipid species characteristic for normal renal cell phenotypes at different timepoints during 8-day organ culture, as recorded by MALDI-MSI (5 × 5 µm2 pixel size) (n = 3 perfusions with biopsies taken at Day 0, Day 2, Day 4, Day 6 and Day 8 from each kidney). Lipid species m/z values are representative for PT_1 and PT_2 (m/z 766.5), PT_1 (m/z 810.5), podocytes (m/z 838.6), and all tubular structures (m/z 885.6). Right panel shows relative fold change compared to baseline (Day 0) for each timepoint during culture. Scale bar = 200 μm. B Representative images demonstrate changes in spatial distribution of lipid species that are characteristic for abnormal PT phenotype (PT_3) at different timepoints during 8-day organ culture, as recorded by MALDI-MSI (5 × 5 µm2 pixel size) (n = 3 perfusions with biopsies taken at Day 0, Day 2, Day 4, Day 6 and Day 8 from each kidney). Right panel shows relative fold change compared to baseline (Day 0) for each timepoint during culture. Bars represent 200 μm. All images generated from same samples as shown in Fig. 2K with IF staining and spatial segmentation. Bars represent 200 μm. Source data are provided as a Source Data file.
Fig. 4
Fig. 4. Oxidative damage during 8-day  subnormothermic culture of human kidneys.
A Perfusate malondialdehyde (MDA) as marker for lipid peroxidation during 8-day perfusion. B Volcano plot demonstrating log2 fold change in lipid species measured in 8-day perfused tissue samples as compared to control kidney tissue (n = 3 human kidneys per group), as identified through untargeted lipidomics. Two-sided t test. C Representative images demonstrate changes in spatial distribution of oxidized phospholipid species (PE 36:2;O) at different timepoints during 8-day perfusion, as recorded by MALDI-MSI (5 × 5 µm2 pixel size) (n = 3 perfusions with biopsies taken at Day 0, Day 2, Day 4, Day 6 and Day 8 from each kidney). Right panel shows relative fold change compared to Day 0. Bars represent 200 μm. Source data are provided as a Source Data file.
Fig. 5
Fig. 5. Spatial dynamic metabolic measurements on biopsies taken at different timepoints during 8-day culture.
A Representative spatial segmentation of proximal tubule phenotypes at different timepoints during 8-day human kidney perfusion (n = 3 perfusions with biopsies taken at Day 0, Day 4 and Day 8 from each kidney). Bars represent 200 μm. BF Images and graphs showing the spatial dynamic metabolic measurements using U-13C6-glucose on biopsies after 2 h’ incubation (n = 3 perfusions with biopsies taken at Day 0, Day 4 and Day 8 from each kidney). Graphs are shown as log2 fold change compared to PT1 at Day 0. Bars represent 200 μm. One way ANOVA test. G Direct carbon contribution of different nutrients to glutamate in proximal tubule cells, as measured from the glutamate isotopologues M + 2, M + 3, and M + 5 (n = 3 perfusions with biopsies taken at Day 0, Day 4 and Day 8 from each kidney). Two-tailed unpaired t test. HN, Images and graphs showing the spatial dynamic metabolic measurements using U-13C5-glutamine on the biopsies obtained at different timepoints during the 8-day organ culture period after 2 h incubation (n = 3 perfusions with biopsies taken at Day 0, Day 4 and Day 8 from each kidney). Graphs are shown as log2 fold change compared to PT1 at Day 0. Bars represent 200 μm. One way ANOVA test (exact p values in figure). Two-tailed paired t test compared to PT1 (#p < 0.05). O Relative flux rate of different TCA cycle steps (n = 3 perfusions with biopsies taken at Day 0, Day 4 and Day 8 from each kidney). One way ANOVA test. Data are represented as mean ± SD. All images generated from same samples as shown in Fig. 2K with IF staining, molecular histology and spatial segmentation. Source data are provided as a Source Data file.
Fig. 6
Fig. 6. Perfusion dynamics and function during 4-day subnormothermic culture of eight human kidneys.
Course of renal flow (A) and vascular resistance (B) during the 4-day perfusion period. CG Metabolic perfusate dynamics. Perfusate pO2 (C) measured in the arterial inflow and venous outflow. Oxygen delivery (D) as calculated from the pO2 in the arterial inflow and oxygen uptake (D) as calculated from the difference in pO2 between the arterial inflow and venous outflow. Perfusate pH (E), perfusate bicarbonate (F), and perfusate lactate (G) as measured in the arterial inflow. HJ, Perfusate injury markers during the 4-day perfusion period. Perfusate LDH (H) as marker for general cell damage. Perfusate KIM1 (I) as marker for proximal tubular cell damage. Perfusate NGAL (J) as marker for distal tubular cell damage. K Tissue histology scoring of the five discarded human kidneys that were cultured for a 4-day period. Day4_1 and Day4_2 are the contralateral kidneys of Control_1 and Control_2, respectively. Representative PAS staining’s can be found in Figure S4. LP, Renal function during 4-day perfusion. L Urine flow. M Assessment of glomerular filtration barrier on Day 1 and Day 3 of perfusion. Low molecular mass 20 kDa fluorescent dextran (FITC-labeled) and high molecular mass 500 kDa fluorescent dextran (TRITC-labeled) were infused with subsequent perfusate and urine collection (n = 5 human kidneys). N Glomerular sieving coefficient for 20 kDa and 500 kDa dextran (n = 5 human kidneys). For M, N fluorescence intensity of dextran in the urine was normalized for fluorescence intensity of dextran in the perfusate. Perfusate and urine concentration differences demonstrates tubular reabsorption of sodium and glucose (O) and secretion of potassium and urea (P) during perfusion at subnormothermia (25 °C). Data are presented as mean ± SEM. Source data are provided as a Source Data file.

References

    1. Jing L, Yao L, Zhao M, Peng LP, Liu M. Organ preservation: from the past to the future. Acta Pharmacol. Sin. 2018;39:845–857. doi: 10.1038/aps.2017.182. - DOI - PMC - PubMed
    1. Moers C, Pirenne J, Paul A, Ploeg RJ. Machine perfusion or cold storage in deceased-donor kidney transplantation. N. Engl. J. Med. 2012;366:770–771. doi: 10.1056/NEJMc1111038. - DOI - PubMed
    1. Moers C, et al. Machine perfusion or cold storage in deceased-donor kidney transplantation. N. Engl. J. Med. 2009;360:7–19. doi: 10.1056/NEJMoa0802289. - DOI - PubMed
    1. Hosgood SA, Saeb-Parsy K, Hamed MO, Nicholson ML. Successful transplantation of human kidneys deemed untransplantable but resuscitated by ex vivo normothermic machine perfusion. Am. J. Transplant. 2016;16:3282–3285. doi: 10.1111/ajt.13906. - DOI - PMC - PubMed
    1. Hosgood SA, Thompson E, Moore T, Wilson CH, Nicholson ML. Normothermic machine perfusion for the assessment and transplantation of declined human kidneys from donation after circulatory death donors. Br. J. Surg. 2018;105:388–394. doi: 10.1002/bjs.10733. - DOI - PMC - PubMed

Substances