. 2024 May 13;14(1):10888.
doi: 10.1038/s41598-024-61459-8.

Hypertonic saline- and detergent-accelerated EDTA-based decalcification better preserves mRNA of bones

Affiliations

Hypertonic saline- and detergent-accelerated EDTA-based decalcification better preserves mRNA of bones

Zhongmin Li et al. Sci Rep. .

Abstract

Ethylenediaminetetraacetic acid (EDTA), a classically used chelating agent of decalcification, maintains good morphological details, but its slow decalcification limits its wider applications. Many procedures have been reported to accelerate EDTA-based decalcification, involving temperature, concentration, sonication, agitation, vacuum, microwave, or combination. However, these procedures, concentrating on purely tissue-outside physical factors to increase the chemical diffusion, do not enable EDTA to exert its full capacity due to tissue intrinsic chemical resistances around the diffusion passage. The resistances, such as tissue inner lipids and electric charges, impede the penetration of EDTA. We hypothesized that delipidation and shielding electric charges would accelerate EDTA-based penetration and the subsequent decalcification. The hypothesis was verified by the observation of speedy penetration of EDTA with additives of detergents and hypertonic saline, testing on tissue-mimicking gels of collagen and adult mouse bones. Using a 26% EDTA mixture with the additives at 45°C, a conventional 7-day decalcification of adult mouse ankle joints could be completed within 24 h while the tissue morphological structure, antigenicity, enzymes, and DNA were well preserved, and mRNA better retained compared to using 15% EDTA at room temperature. The addition of hypertonic saline and detergents to EDTA decalcification is a simple, rapid, and inexpensive method that doesn't disrupt the current histological workflow. This method is equally or even more effective than the currently most used decalcification methods in preserving the morphological details of tissues. It can be highly beneficial for the related community.

Keywords: Bone; Decalcification; Delipidation; EDTA; Histology; Technique.


Conflict of interest statement

The authors are paid employees of Advancecor GmbH of Germany and have read the journal’s policy. There are no patents, products in development, or marketed products associated with this research to declare.

Figures

Figure 1
Figure 1
EDTA penetration in gel at different time points (0–4 h). 26% EDTA penetration in the gelatin gel (A) or in the fat-containing gelatin gel (B) varied with the addition of 5% NaCl (EDTA + sa) or 0.5% Tween/1% triton (EDTA + de), or 5% NaCl and 0.5%Tween/1% triton (EDTA-plus). PBSx1 served as a control. The penetration depth was measured in triplicate at each time point. Comparison of the average values among the experimental groups within the period 15`–4 h, with one-way ANOVA on ranks and Tukey HSD, resulted in a statistically significant difference; *for all, p < 0.002, vs 26% EDTA, 26% EDTA + sa, or 26% EDTA + de; N = 4 (4 average values for 4-time points per group) in the gel without fat (C); **for all, p < 0.001, vs. 26% EDTA, 26% EDTA + sa, or 26% EDTA + de; N = 4 in the fat-containing gel (D). At the first (15 min) and final (4 h) time points after the addition of EDTA, the penetration depths (N = 3 per group) were compared among the experimental groups, with one-way ANOVA and Tukey HSD. The p values of the pairwise comparisons were given in Tables C1 (15 min) and C2 (4 h) for graph C, and Tables D1 (15 min) and D2 (4 h) for graph (D). In the tables statistically significant differences were marked in boldface. Green bars in (A) = 10 mm. Blue bars in (B) = 20 mm.
Figure 1
Figure 1
EDTA penetration in gel at different time points (0–4 h). 26% EDTA penetration in the gelatin gel (A) or in the fat-containing gelatin gel (B) varied with the addition of 5% NaCl (EDTA + sa) or 0.5% Tween/1% triton (EDTA + de), or 5% NaCl and 0.5%Tween/1% triton (EDTA-plus). PBSx1 served as a control. The penetration depth was measured in triplicate at each time point. Comparison of the average values among the experimental groups within the period 15`–4 h, with one-way ANOVA on ranks and Tukey HSD, resulted in a statistically significant difference; *for all, p < 0.002, vs 26% EDTA, 26% EDTA + sa, or 26% EDTA + de; N = 4 (4 average values for 4-time points per group) in the gel without fat (C); **for all, p < 0.001, vs. 26% EDTA, 26% EDTA + sa, or 26% EDTA + de; N = 4 in the fat-containing gel (D). At the first (15 min) and final (4 h) time points after the addition of EDTA, the penetration depths (N = 3 per group) were compared among the experimental groups, with one-way ANOVA and Tukey HSD. The p values of the pairwise comparisons were given in Tables C1 (15 min) and C2 (4 h) for graph C, and Tables D1 (15 min) and D2 (4 h) for graph (D). In the tables statistically significant differences were marked in boldface. Green bars in (A) = 10 mm. Blue bars in (B) = 20 mm.
Figure 2
Figure 2
Mineral retention via EDTA decalcification of different methods in the distal portion of tibia. (A) The macroscopic stain of Alizarin following decalcification of 15% EDTA, 15% EDTA with additive of 5% saline (15% EDTA + sa), 15% EDTA with additive of detergent mixture of 0.5% tween-20 and 1% triton-X100 (15% EDTA + de), and 15% EDTA with additive of both saline and detergents in the same concentration (15% EDTA-plus) at room temperature (RT, 23 °C). A mixture of 0.5% tween-20, 1% triton-X100 and 5% NaCl (saline + deter) served as a control. The red color indicates the presence of calcium. (B) The region of interest (green rectangle) in the distal portion of the tibia was shown as an image (larger green rectangle). (C,D). The mineral loss in the relative area measured in triplicate or quadruplicate was compared among the groups. The comparison of the average values among the experimental groups within the period 6 h—3 days, with one-way ANOVA on ranks and Fisher LSD test, resulted in a statistically significant difference; *for all, p < 0.04, vs. 15% EDTA RT, 15% EDTA + sa RT, 15% EDTA + de RT, 15% EDTA-plus RT, or 15% EDTA 45 °C; N = 3 (3 average values for 3-time points per group) in (C); **for all, p < 0.001, vs 26% EDTA RT, 26% EDTA-plus RT, or 26% EDTA 45 °C; N = 3 in (D). (E) Comparison between the values of 15% EDTA-plus and 26% EDTA-plus at a higher temperature (45°C), measured at 6 h, with Paired Samples T-tests, led to a significant statistical difference; #, p < 0.01 of 2-tailed, N = 4. Green bars in (A) = 1 mm.
Figure 3
Figure 3
HE stained sections of ankle joints via decalcification of 26% EDTA-plus 45 °C and 15% EDTA RT. The regions indicated by blue rectangles in (AC) were magnified in the images of (BD), respectively. In terms of the relative shrinkage cells (%) in (E) and pyknotic nuclei (%) in (F), the comparison between 26% EDTA-plus 45 °C and 15% EDTA RT, with Independent Samples T-test, resulted in statistically non-significant differences (N = 6 per group; p = 0.54 of 2-tailed, for (E); P = 0.83 of 2-tailed, for (F)).
Figure 4
Figure 4
Immunohistochemistry of sections of ankle joints following decalcification of 26% EDTA-plus (45°C) and 15% EDTA (RT). (A) Images of immunohistochemistry of ABC for macrophages, CD3, and CD45 were performed with a counterstain of hematoxylin. The positive cells (indicated by arrows) are colorized dark brown. Bars = 20 µm. (B) The region of interest (green circle) is localized in the pannus formation of arthritis. The thickened synovium and pannus formation is marked with red. (C) Inflammation cell density within the pannus of arthritis via decalcification of 26% EDTA-plus (45 °C) and 15% EDTA (RT) was demonstrated. In terms of the cell density, the comparison between them, with Independent Samples T-test, resulted in statistically non-significant differences (N = 5–6 per group; p = 0.07 of 2-tailed for macrophages; p = 0.13 of 2-tailed for CD3; p = 0.82 of 2-tailed, for CD45).
Figure 5
Figure 5
DAPI staining and in situ hybrid painting for Y chromosome of moue. (A) Images of the staining. The regions indicated by red rectangles in insets were magnified in the corresponding images and the regions of interest (white rectangles) were observed under DAPI and Cy-3 channels. Bar = 50 µm. (B) Y chromosome painting positive rates were calculated and compared in the tissues decalcified with 26% EDTA-plus 45 °C and 15% EDTA RT. The comparison between the two decalcification fashions, with Independent Samples T-test, resulted in a statistically non-significant difference (N = 6 per group, p = 0.33).
Figure 6
Figure 6
Images of RNAscope and DAPI staining in chondrocytes of mice. The region indicated by the red rectangle in (A) was observed in images (B) under DAPI and Cy-3 channels. The regions of interest (white rectangles) in (B) were magnified in the adjacent corresponding images. Mouse ß-actin mRNA expression in chondrocyte (red fluorescence) was calculated in terms of integrated density and compared in the tissues decalcified with 26% EDTA-plus (45°C) and 15% EDTA (RT). The comparison (C) between the two decalcification fashions in the regions limited to the middle portion (100 µm) demarcated as the red rectangle of (B), with Independent Samples T-test, resulted in a statistically significant difference (*vs. 15% EDTA RT, N = 6 per group, p = 0.034).
Figure 7
Figure 7
Accuracy testing on average values of each stain in tissues via decalcifications of 26% EDTA-plus (45 °C) and 15% EDTA (RT). The statistical analysis resulted in a statistically significant correlation (N = 12 pairs, Pearson’s r = 0.967, p < 0.001). V1 indicates the data point of RNAscope analysis.
Figure 8
Figure 8
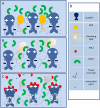
Fundamentals for accelerating diffusion of EDTA in tissue. (A) Proteins are cross-linked by induction of formalin-fixation and charged while contacted with an EDTA solution. Lipid droplets are inset amid the proteins. The charges and lipids impede EDTA penetration into the tissue. (B) EDTA penetration is enhanced after delipidation with detergents. (C) An additive of NaCl in the EDTA solution, shielding the charges around the penetration passages, accelerates further the tissue permeability of EDTA. (D) Symbol identifiers for (AC).

References

    1. Schrijver WA, van der Groep P, Hoefnagel LD, Ter Hoeve ND, Peeters T, Moelans CB, van Diest PJ. Influence of decalcification procedures on immunohistochemistry and molecular pathology in breast cancer. Mod. Pathol. 2016;29(12):1460–1470. doi: 10.1038/modpathol.2016.116. - DOI - PubMed
    1. Alers JC, Krijtenburg PJ, Vissers KJ, van Dekken H. Effect of bone decalcification procedures on DNA in situ hybridization and comparative genomic hybridization. EDTA is highly preferable to a routinely used acid decalcifier. J. Histochem. Cytochem. 1999;47(5):703–10. doi: 10.1177/002215549904700512. - DOI - PubMed
    1. Arber JM, Weiss LM, Chang KL, Battifora H, Arber DA. The effect of decalcification on in situ hybridization. Mod. Pathol. 1997;10(10):1009–1014. - PubMed
    1. Kirita T. Oral Cancer. Springer Science + Business Media; 2015.
    1. An YH, Martin KL. Handbook of Histology Methods for Bone and Cartilage. Humana Press; 2003.