. 2024 May 13;14(1):10868.
doi: 10.1038/s41598-024-61691-2.

Amyloid-beta antibody binding to cerebral amyloid angiopathy fibrils and risk for amyloid-related imaging abnormalities

Affiliations

Amyloid-beta antibody binding to cerebral amyloid angiopathy fibrils and risk for amyloid-related imaging abnormalities

Linda Söderberg et al. Sci Rep. .

Abstract

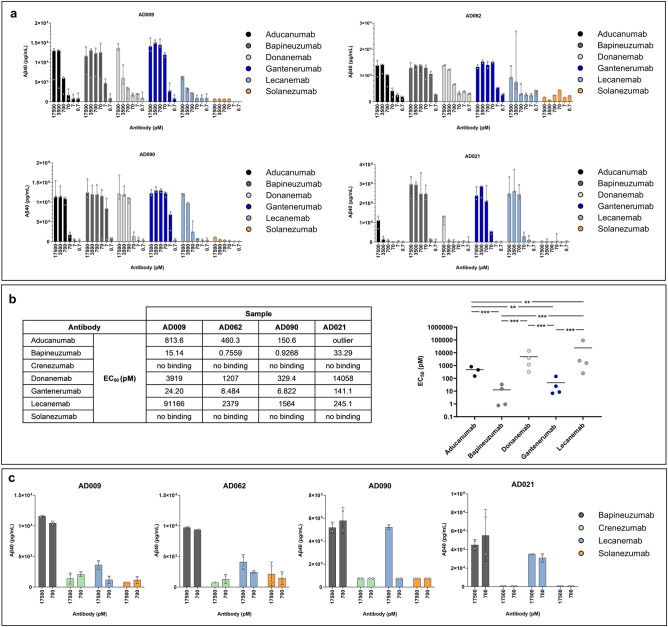
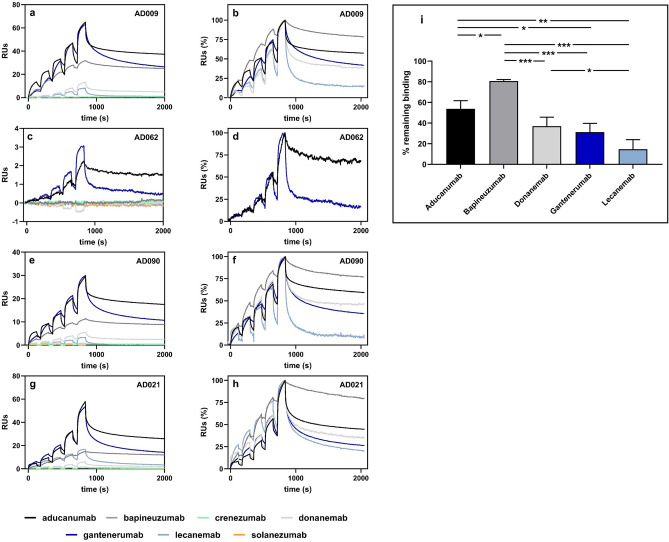
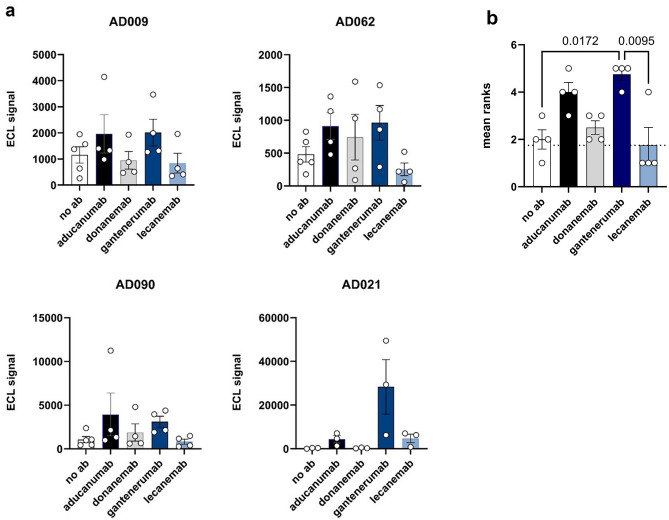
Therapeutic antibodies have been developed to target amyloid-beta (Aβ), and some of these slow the progression of Alzheimer's disease (AD). However, they can also cause adverse events known as amyloid-related imaging abnormalities with edema (ARIA-E). We investigated therapeutic Aβ antibody binding to cerebral amyloid angiopathy (CAA) fibrils isolated from human leptomeningeal tissue to study whether this related to the ARIA-E frequencies previously reported by clinical trials. The binding of Aβ antibodies to CAA Aβ fibrils was evaluated in vitro using immunoprecipitation, surface plasmon resonance, and direct binding assay. Marked differences in Aβ antibody binding to CAA fibrils were observed. Solanezumab and crenezumab showed negligible CAA fibril binding and these antibodies have no reported ARIA-E cases. Lecanemab showed a low binding to CAA fibrils, consistent with its relatively low ARIA-E frequency of 12.6%, while aducanumab, bapineuzumab, and gantenerumab all showed higher binding to CAA fibrils and substantially higher ARIA-E frequencies (25-35%). An ARIA-E frequency of 24% was reported for donanemab, and its binding to CAA fibrils correlated with the amount of pyroglutamate-modified Aβ present. The findings of this study support the proposal that Aβ antibody-CAA interactions may relate to the ARIA-E frequency observed in patients treated with Aβ-based immunotherapies.

Keywords: ARIA; Alzheimer’s disease; Amyloid; CAA; Immunotherapy.


Conflict of interest statement

LS, MJ, EG, PN, NF, OZ, AR, AS, EB, GD, GO, LL, and CM are employees and shareholders of BioArctic. LL is co‐founder and board member of BioArctic.

Figures

Figure 1
Figure 1
Immunohistochemical staining of total Aβ in fresh frozen leptomeningeal tissue sections. A mixture of 4G8 and 6E10 primary antibodies was used, followed by a horseradish peroxidase 3,3ʹ-diaminobenzidine-based detection system. (af) Representative images of six indicated AD subjects, where green arrows indicate small CAA-positive vessels, red arrows indicate medium-sized CAA-positive vessels, and the blue arrow indicates a large CAA-positive vessel. (gk) Representative images of five indicated NDE subjects with no or minimal CAA. Black arrows indicate large CAA-negative vessels. Scale bar = 200 µm.
Figure 2
Figure 2
CLSM images of water-extracted leptomeningeal CAA fibrils co-stained with pFTAA (green) and Alexa Fluor® 647-conjugated 6E10 anti-Aβ antibody (red). Merged pFTAA and 6E10 images are shown (yellow represents colocalized staining) and brightfield (BF) pictures were acquired to assess sample morphology. (a) Extract from an AD subject (AD009), with boxes at the top right corners showing zoomed-in images. (b) Extract from an NDE subject (NDE062). (c) AD extract negative staining control (same extract as shown in a), with no exposure to pFTAA or 6E10. Scale bars = 100 µm or 20 µm as indicated.
Figure 3
Figure 3
Levels of Aβ peptides in leptomeningeal and temporal cortex extracts. Leptomeningeal CAA fibrils were isolated from subjects with AD (n = 6) and NDE controls (n = 5) and disrupted (70% FA) before V-PLEX® Aβ peptide panel 1 (4G8) assay (MSD) or ELISA (IBL). (a) Aβ40 and Aβ42 levels in the indicated subjects; (b) Aβ40/Aβ42 ratios for the indicated AD subjects and (c) AβpE3-40 levels in the indicated subjects. (d) AβpE3-40 level (c) expressed as a percentage of total Aβ40 (a) for the four AD subjects with measurable levels of both peptides. Data from one representative experiment are shown in (a) and (c), analyzed in triplicate and presented as mean ± SEM. Temporal cortex insoluble extract Aβ levels were determined by V-PLEX® Aβ peptide panel 1 (4G8) assay. (e) Aβ40 and Aβ42 levels and (f) Aβ42/Aβ40 ratios in insoluble temporal cortex extracts of the indicated AD subjects.
Figure 4
Figure 4
Representative MALDI mass spectra for water-extracted CAA fibrils from leptomeningeal tissues of the indicated AD subjects. Prior to MALDI, CAA fibrils were immunoprecipitated with Dynabeads M-280 sheep anti-mouse beads coupled to 6E10 or 4G8 antibodies. (a) Mass spectra for the indicated study subjects, showing Aβ-assigned peaks that were analyzed using an in-house script that matched the masses of the observed peaks to those of known Aβ peptides. (b) The relative abundance of Aβ peptides identified in each sample.
Figure 5
Figure 5
IP analysis of CAA Aβ fibrils extracted from AD leptomeningeal tissues. CAA Aβ fibrils were isolated from the indicated four AD subjects and IP was conducted using the indicated antibody concentrations before eluate analysis using the V-PLEX® Aβ peptide panel 1 (4G8) kit. (a) Eluate Aβ40 levels are presented as the median ± range, with each open circle representing an individual experiment. (b) The estimated EC50 values for each individual and antibody (left-hand panel) and comparison of mean EC50 values for the indicated antibodies (right-hand panel). A statistically significant ANOVA (F4.8 = 58.93, p = 0.00001) was followed by Tukey’s unequal N post-hoc testing; **p < 0.01, ***p < 0.001. (c) Eluate Aβ40 levels (mean ± SD), with each open circle representing an individual experiment.
Figure 6
Figure 6
Representative SPR analyses of antibody interactions with CAA Aβ fibrils isolated from the indicated AD subjects. (a,c,e,g) Sensorgrams showing the individual responses to increasing concentrations (6.2, 18.5, 55.6, 167, and 500 nM) of the indicated antibodies. On the y-axes, 1 response unit (RU) indicates a weight change of 1 pg/mm2 on the sensor chip surface. (b,d,f,h) Sensorgrams shown in panels (a,c,e,g) were normalized to the highest response observed for each antibody to highlight the difference in dissociation of the antibodies from the antibody-fibril complex during the 20-min dissociation phase. Antibodies that did not produce a binding response (a,c,e,g) were omitted from (b,d,f,h). (i) Average % of the indicated antibodies that remained bound after the 20-min dissociation phase. One-way repeated ANOVA F4,8 = 32.939, p = 0.00005. Tukey’s unequal N post-hoc test, *p < 0.05, **p < 0.01, ***p < 0.001. Solanezumab and crenezumab were not included in this analysis.
Figure 7
Figure 7
Direct immunoassay of antibody binding to CAA fibrils extracted from AD leptomeninges. (a) The signals observed when MSD® plates were coated with CAA Aβ fibrils prepared from the four indicated AD subjects in the absence of antibody (no ab) or in the presence of the indicated antibody (10,000 ng/mL). Bars represent the mean signal ± SEM of four independent experiments, each indicated by an open circle. (b) The mean ranking ± SEM of the signals observed when each of the indicated antibodies was individually incubated with CAA fibrils prepared from the four individuals shown in panel (a), with individual ranks indicated by open circles. Repeated measures ANOVA, F = 6.60, p = 0.0048. Tukey’s post-hoc test p-values are shown for each statistically significant pairwise comparison.

References

    1. Murphy MP, LeVine H. Alzheimer's disease and the amyloid-beta peptide. J. Alzheimer’s Dis. 2010;19:311–323. doi: 10.3233/JAD-2010-1221. - DOI - PMC - PubMed
    1. Greenberg SM, et al. Cerebral amyloid angiopathy and Alzheimer disease—One peptide, two pathways. Nat. Rev. Neurol. 2020;16:30–42. doi: 10.1038/s41582-019-0281-2. - DOI - PMC - PubMed
    1. Charidimou A, et al. The Boston criteria version 2.0 for cerebral amyloid angiopathy: A multicentre, retrospective, MRI-neuropathology diagnostic accuracy study. Lancet Neurol. 2022;21:714–725. doi: 10.1016/S1474-4422(22)00208-3. - DOI - PMC - PubMed
    1. Charidimou A, et al. Emerging concepts in sporadic cerebral amyloid angiopathy. Brain. 2017;140:1829–1850. doi: 10.1093/brain/awx047. - DOI - PMC - PubMed
    1. Koemans EA, et al. Progression of cerebral amyloid angiopathy: A pathophysiological framework. Lancet Neurol. 2023;22:632–642. doi: 10.1016/S1474-4422(23)00114-X. - DOI - PubMed

MeSH terms