. 2024 Jun;8(6):1136-1149.
doi: 10.1038/s41562-024-01867-y. Epub 2024 May 13.

Representation of internal speech by single neurons in human supramarginal gyrus

Affiliations

Representation of internal speech by single neurons in human supramarginal gyrus

Sarah K Wandelt et al. Nat Hum Behav. 2024 Jun.

Abstract

Speech brain-machine interfaces (BMIs) translate brain signals into words or audio outputs, enabling communication for people having lost their speech abilities due to diseases or injury. While important advances in vocalized, attempted and mimed speech decoding have been achieved, results for internal speech decoding are sparse and have yet to achieve high functionality. Notably, it is still unclear from which brain areas internal speech can be decoded. Here two participants with tetraplegia with implanted microelectrode arrays located in the supramarginal gyrus (SMG) and primary somatosensory cortex (S1) performed internal and vocalized speech of six words and two pseudowords. In both participants, we found significant neural representation of internal and vocalized speech, at the single neuron and population level in the SMG. From recorded population activity in the SMG, the internally spoken and vocalized words were significantly decodable. In an offline analysis, we achieved average decoding accuracies of 55% and 24% for each participant, respectively (chance level 12.5%), and during an online internal speech BMI task, we averaged 79% and 23% accuracy, respectively. Evidence of shared neural representations between internal speech, word reading and vocalized speech processes was found in participant 1. SMG represented words as well as pseudowords, providing evidence for phonetic encoding. Furthermore, our decoder achieved high classification with multiple internal speech strategies (auditory imagination/visual imagination). Activity in S1 was modulated by vocalized but not internal speech in both participants, suggesting no articulator movements of the vocal tract occurred during internal speech production. This work represents a proof-of-concept for a high-performance internal speech BMI.


Conflict of interest statement

The authors declare no competing interests.

Figures

Fig. 1
Fig. 1. Multielectrode implant locations.
a,b, SMG implant locations in participant 1 (1 × 96 multielectrode array) (a) and participant 2 (1 × 64 multielectrode array) (b). c,d, S1 implant locations in participant 1 (2 × 96 multielectrode arrays) (c) and participant 2 (2 × 64 multielectrode arrays) (d).
Fig. 2
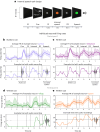
Fig. 2. Neurons in the SMG represent language processes.
a, Written words and sounds were used to cue six words and two pseudowords in a participant with tetraplegia. The ‘audio cue’ task was composed of an ITI, a cue phase during which the sound of one of the words was emitted from a speaker (between 842 and 1,130 ms), a first delay (D1), an internal speech phase, a second delay (D2) and a vocalized speech phase. The ‘written cue’ task was identical to the ‘audio cue’ task, except that written words appeared on the screen for 1.5 s. Eight repetitions of eight words were performed per session day and per task for the first participant. For the second participant, 16 repetitions of eight words were performed for the written cue task. be, Example smoothed firing rates of neurons tuned to four words in the SMG for participant 1 (auditory cue, python (b), and written cue, telephone (c)) and participant 2 (written cue, nifzig (d), and written cue, spoon (e)). Top: the average firing rate over 8 or 16 trials (solid line, mean; shaded area, 95% bootstrapped confidence interval). Bottom: one example trial with associated audio amplitude (grey). Vertically dashed lines indicate the beginning of each phase. Single neurons modulate firing rate during internal speech in the SMG.
Fig. 3
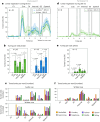
Fig. 3. Neuronal population activity modulates for individual words.
a, The average percentage of tuned neurons to words in 50-ms time bins in the SMG over the trial duration for ‘auditory cue’ (blue) and ‘written cue’ (green) tasks for participant 1 (solid line, mean over ten sessions; shaded area, 95% confidence interval of the mean). During the cue phase of auditory trials, neural data were aligned to audio onset, which occurred within 200–650 ms following initiation of the cue phase. b, The average percentage of tuned neurons computed on firing rates per task phase, with 95% confidence interval over ten sessions. Tuning during action phases (cue, internal and speech) following rest phases (ITI, D1 and D2) was significantly higher (paired two-tailed t-test, d.f. 9, PITI_CueWritten < 0.001, Cohen’s d = 2.31; PITI_CueAuditory = 0.003, Cohen’s d = 1.25; PD1_InternalWritten = 0.008, Cohen’s d = 1.08; PD1_InternalAuditory < 0.001, Cohen’s d = 1.71; PD2_SpeechWritten < 0.001, Cohen’s d = 2.34; PD2_SpeechAuditory < 0.001, Cohen’s d = 3.23). c, The number of neurons tuned to each individual word in each phase for the ‘auditory cue’ and ‘written cue’ tasks. d, The average percentage of tuned neurons to words in 50-ms time bins in the SMG over the trial duration for ‘written cue’ (green) tasks for participant 2 (solid line, mean over nine sessions; shaded area, 95% confidence interval of the mean). Due to a reduced number of tuned units, only the ‘written cue’ task variation was performed. e, The average percentage of tuned neurons computed on firing rates per task phase, with 95% confidence interval over nine sessions. Tuning during cue and internal phases following rest phases ITI and D1 was significantly higher (paired two-tailed t-test, d.f. 8, PITI_CueWritten = 0.003, Cohen’s d = 1.38; PD1_Internal = 0.001, Cohen’s d = 1.67). f, The number of neurons tuned to each individual word in each phase for the ‘written cue’ task. Source data
Fig. 4
Fig. 4. dPCA highlighting SMG’s involvement in language processing.
ae, dPCA was performed to investigate variance within three marginalizations: ‘timing’, ‘cue modality’ and ‘word’ for participant 1 (ac) and ‘timing’ and ‘word’ for participant 2 (d and e). Demixed PCs explaining the highest variance within each marginalization were plotted over time, by projecting the data onto their respective dPCA decoder axis. In a, the ‘timing’ marginalization demonstrates SMG modulation during cue, internal speech and vocalized speech, while S1 only represents vocalized speech. The solid blue lines (8) represent the auditory cue trials, and dashed green lines (8) represent written cue trials. In b, the ‘cue modality’ marginalization suggests that internal and vocalized speech representation in the SMG are not affected by the cue modality. The solid blue lines (8) represent the auditory cue trials, and dashed green lines (8) represent written cue trials. In c, the ‘word’ marginalization shows high variability for different words in the SMG, but near zero for S1. The colours (8) represent individual words. For each colour, solid lines represent auditory trials and dashed lines represent written cue trials. d is the same as a, but for participant 2. The dashed green lines (8) represent written cue trials. e is the same as c, but for participant 2. The colours (8) represent individual words during written cue trials. The variance for different words in the SMG (left) was higher than in S1 (right), but lower in comparison with SMG in participant 1 (c).
Fig. 5
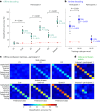
Fig. 5. Words can be significantly decoded during internal speech in the SMG.
a, Offline decoding accuracies: ‘audio cue’ and ‘written cue’ task data were combined for each individual session day, and leave-one-out CV was performed (black dots). PCA was performed on the training data, an LDA model was constructed, and classification accuracies were plotted with 95% confidence intervals, over the session means. The significance of classification accuracies were evaluated by comparing results with a shuffled distribution (averaged shuffle results over 100 repetitions indicated by red dots; P < 0.01 indicates that the average mean is >99.5th percentile of shuffle distribution, n = 10). In participant 1, classification accuracies during action phases (cue, internal and speech) following rest phases (ITI, D1 and D2) were significantly higher (paired two-tailed t-test: n = 10, d.f. 9, for all P < 0.001, Cohen’s d = 6.81, 2.29 and 5.75). b, Online decoding accuracies: classification accuracies for internal speech were evaluated in a closed-loop internal speech BMI application on three different session days for both participants. In participant 1, decoding accuracies were significantly above chance (averaged shuffle results over 1,000 repetitions indicated by red dots; P < 0.001 indicates that the average mean is >99.95th percentile of shuffle distribution) and improved when 16–20 trials per words were used to train the model (two-sample two-tailed t-test, n(8–14) = 8, d.f. 11, n(16–20) = 5, P = 0.029), averaging 79% classification accuracy. In participant 2, online decoding accuracies were significant (averaged shuffle results over 1,000 repetitions indicated by red dots; P < 0.05 indicates that average mean is >97.5th percentile of shuffle distribution, n = 7) and averaged 23%. c, An offline confusion matrix for participant 1: confusion matrices for each of the different task phases were computed on the tested data and averaged over all session days. d, An online confusion matrix: a confusion matrix was computed combining all online runs, leading to a total of 304 trials (38 trials per word) for participant 1 and 448 online trials for participant 2. Participant 1 displayed comparable online decoding accuracies for all words, while participant 2 had preferential decoding for the words ‘swimming’ and ‘spoon’. Source data
Fig. 6
Fig. 6. Shared representations between internal speech, vocalized speech and written word processing.
a, Evaluating the overlap of shared information between different task phases in the ‘auditory cue’ task. For each of the ten session days, cross-phase classification was performed. It consisted in training a model on a subset of data from one phase (for example, cue) and applying it on a subset of data from ITI, cue, internal and speech phases. This analysis was performed separately for each task phase. PCA was performed on the training data, an LDA model was constructed and classification accuracies were plotted with a 95% confidence interval over session means. Significant differences in performance between phases were evaluated between the ten sessions (paired two-tailed t-test, FDR corrected, d.f. 9, P < 0.001 for all, Cohen’s d ≥ 1.89). For easier visibility, significant differences between ITI and other phases were not plotted. b, Same as a for the ‘written cue’ task (paired two-tailed t-test, FDR corrected, d.f. 9, PCue_Internal = 0.028, Cohen’s d > 0.86; PCue_Speech = 0.022, Cohen’s d = 0.95; all others P < 0.001 and Cohen’s d ≥ 1.65). c, The percentage of neurons tuned during the internal speech phase that are also tuned during the vocalized speech phase. Neurons tuned during the internal speech phase were computed as in Fig. 3b separately for each session day. From these, the percentage of neurons that were also tuned during vocalized speech was calculated. More than 80% of neurons during internal speech were also tuned during vocalized speech (82% in the ‘auditory cue’ task, 85% in the ‘written cue’ task). In total, 71% of ‘auditory cue’ and 79% ‘written cue’ neurons also preserved tuning to at least one identical word during internal speech and vocalized speech phases. d, The percentage of neurons tuned during the internal speech phase that were also tuned during the cue phase. Right: 78% of neurons tuned during internal speech were also tuned during the written cue phase. Left: a smaller 47% of neurons tuned during the internal speech phase were also tuned during the auditory cue phase. In total, 71% of neurons preserved tuning between the written cue phase and the internal speech phase, while 42% of neurons preserved tuning between the auditory cue and the internal speech phase. Source data

Similar articles

Cited by

References

    1. Hecht M, et al. Subjective experience and coping in ALS. Amyotroph. Lateral Scler. Other Mot. Neuron Disord. 2002;3:225–231. - PubMed
    1. Aflalo T, et al. Decoding motor imagery from the posterior parietal cortex of a tetraplegic human. Science. 2015;348:906–910. - PMC - PubMed
    1. Andersen, R. A. Machines that translate wants into actions. Scientific Americanhttps://www.scientificamerican.com/article/machines-that-translate-wants... (2019).
    1. Andersen RA, Aflalo T, Kellis S. From thought to action: the brain–machine interface in posterior parietal cortex. Proc. Natl Acad. Sci. USA. 2019;116:26274–26279. - PMC - PubMed
    1. Andersen RA, Kellis S, Klaes C, Aflalo T. Toward more versatile and intuitive cortical brain machine interfaces. Curr. Biol. 2014;24:R885–R897. - PMC - PubMed