. 2024 May;30(5):1384-1394.
doi: 10.1038/s41591-024-02944-5. Epub 2024 May 13.

High-resolution African HLA resource uncovers HLA-DRB1 expression effects underlying vaccine response

Affiliations

High-resolution African HLA resource uncovers HLA-DRB1 expression effects underlying vaccine response

Alexander J Mentzer et al. Nat Med. 2024 May.

Abstract

How human genetic variation contributes to vaccine effectiveness in infants is unclear, and data are limited on these relationships in populations with African ancestries. We undertook genetic analyses of vaccine antibody responses in infants from Uganda (n = 1391), Burkina Faso (n = 353) and South Africa (n = 755), identifying associations between human leukocyte antigen (HLA) and antibody response for five of eight tested antigens spanning pertussis, diphtheria and hepatitis B vaccines. In addition, through HLA typing 1,702 individuals from 11 populations of African ancestry derived predominantly from the 1000 Genomes Project, we constructed an imputation resource, fine-mapping class II HLA-DR and DQ associations explaining up to 10% of antibody response variance in our infant cohorts. We observed differences in the genetic architecture of pertussis antibody response between the cohorts with African ancestries and an independent cohort with European ancestry, but found no in silico evidence of differences in HLA peptide binding affinity or breadth. Using immune cell expression quantitative trait loci datasets derived from African-ancestry samples from the 1000 Genomes Project, we found evidence of differential HLA-DRB1 expression correlating with inferred protection from pertussis following vaccination. This work suggests that HLA-DRB1 expression may play a role in vaccine response and should be considered alongside peptide selection to improve vaccine design.


Conflict of interest statement

The authors declare no competing interests.

Figures
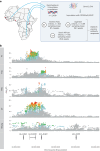
Fig. 1
Fig. 1. HLA associations with diverse vaccine responses in African infants and the diversity of HLA alleles across Africa.
a, Schematic of the experimental design for the VaccGene project. DNA from 2,499 infants across three African sites were genotyped on the Omni 2.5 M array and then imputed to a merged reference panel of 1000 Genomes phase 3 (1000Gp3) combined with the African Genome Variation Project (AGVP). VaccGene population locations are represented with blue points, and African 1000 Genome populations are in red. The resultant genetic data from VaccGene were tested for association with eight vaccine antibody responses. Created using BioRender.com. The maps of Africa in a and Supplementary Fig. 2a were generated using the R packages maps and mapdata (https://CRAN.R-project.org/package=mapdata/) and using data available through the CIA World Data Bank II (2017) release. b, Regional association plots of the genetic association statistics from imputed and directly genotyped variants tested for association with five vaccine antigen responses. In each track representing the statistics from a single tested vaccine antibody response, the y axis represents the –log10(P value) of the linear mixed-model genetic association statistics pooled across the three populations, and the x axis is the position along chromosome 6 with the units in base-pair coordinates from build 37. The lowest track represents the location of four class II HLA genes. No adjustments were made for multiple testing. The bulk of associations can be observed to occur across the HLA-DRB1 and HLA-DQB1 regions. Points are colored by LD (r2) with the index variant in each analysis across all three populations: red (0.8–1), orange (0.6–0.8), green (0.4–0.6), blue (0.2–0.4) and gray (<0.2).
Fig. 2
Fig. 2. Imputing HLA alleles in African populations using a continental reference panel.
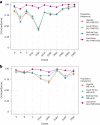
a, HLA imputation performance (measured as locus-specific concordance between alleles called to two-field (four-digit) resolution) in the VaccGene populations using the traditional method and reference set (HLA*IMP:02) clustering by locus and population. Results were compared to the performance of our enhanced high-resolution algorithm and reference dataset (HLA*IMP:02G) using the same individuals divided into validation and test groups using a fivefold cross-validation approach. b, HLA imputation performance comparing results from the ME-HLA panel to those from HLA*IMP:02G called to six-digit ‘G’ resolution. Means of performance are plotted as points for each comparison in both plots. Full statistics are available in Supplementary Tables 8–10. A total of 167 individuals with both genotype and HLA data were available from Burkina Faso, 396 from South Africa and 320 from Uganda; 883 individuals were included for the VaccGene comparison.
Fig. 3
Fig. 3. HLA associations with vaccine responses fine-mapped to HLA variants.
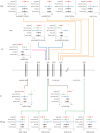
Forest plots of beta effect estimates from linear mixed-model association tests (center points) for fine-mapped variants for each trait colored by population (Uganda, red; South Africa, green; Burkina Faso, blue) with 95% confidence intervals (bars), followed by corresponding distributions for the pooled linear mixed-model (‘pooled’, solid black horizontal line) and fixed-effects meta-analyses including all cohorts (‘fixed meta’). Variants were identified to be independently associated with each trait using combined manual and automated regression approaches. Dashed vertical black lines represent no effect (beta = 0), and solid vertical red lines cross the beta estimate of the ‘pooled’ model as a reference. The originating locus of association is represented by solid arrowed lines colored by trait indicating the relevant region of association on chromosome 6. Associations demonstrating significant evidence (PQ ≤ 1 × 103) of heterogeneity using Cochran’s Q test are highlighted with a red asterisk. No adjustments were made for multiple testing. Exact P values for the association tests are provided in Supplementary Table 12. PRN was not administered to South African infants; hence, there are no measured effects for this population. Data from 1,320 Ugandan individuals, 716 individuals from South Africa and 309 individuals from Burkina Faso, restricted by relatedness were included in the analysis.
Fig. 4
Fig. 4. Assessing the impact of genetics and other exposures on magnitude of vaccine response in VaccGene.
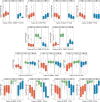
a, The proportion of variance explained (r2) by genetic variants (those fine-mapped to be most relevant as in Fig. 3 for each antibody trait), time in weeks between last vaccine and sampling for antibody assay, sex (male versus female), HIV status and weight-for-length z-score at birth, were available in each tested cohort. Data from 1,391 Ugandan (UG), 755 South African (SA) and 355 Burkinabe (BF) individuals were included in the analysis. b, Distributions of antibody responses stratified by HIV status (uninfected (U), exposed (E) or infected (I) at birth) at birth in Ugandan and South African individuals with differences tested between strata using the two-tailed Wilcoxon rank test. The exact P values for differences between ‘E’ and ‘I’ groups in Uganda for each vaccine are 1.0 × 104 (PT), 0.7 (FHA), 1.3 × 105 (PRN), 8.4 × 108 (DT), 8.5 × 105 (TT), 8.1 × 103 (Hib), 0.01 (Measles) and 1.2 × 104 (HBsAg). Numbers of individuals per group and log-transformed data distributions are available in Supplementary Table 14. No adjustment for multiple testing was applied to any of the reported statistical associations. In the box plots, the center line represents the median, the box limits denote the upper and lower quartiles, and the whiskers are 1.5 times the interquartile range. *P < 0.05, **P < 0.01, ***P < 0.001.
Fig. 5
Fig. 5. Mechanisms associated with HLA-mediated responses and vaccine failure.
a, The beta effect estimates for association between HLA amino acid residues and PT antibody response in the 2,499 VaccGene infants plotted against the equivalent estimates from a meta-analysis of two case–control association studies including 5,066 individuals with records of self-reported pertussis that leads to whooping cough. WC, whooping cough. b, Distributions of Pearson’s r coefficient following 100,000 permutations to measure the significance of correlation between effect estimates of HLA amino acids pruned by LD comparing responses against PT and against the pertussis GWAS. Pearson correlation coefficients were calculated after relabeling of the pertussis GWAS variants generating the null distribution. The correlation coefficients determined using the true datasets are represented with a vertical arrow. c, Ratio of circulating PT:TT-specific TFH cells in donors of known HLA-DRB1 type divided into HLA-DRB1 variant associated with PT antibody response and pertussis self-report, DRB1-233Arg n = 15, and DRB1-233Thr n = 14. Antigen-specific TFH cells are represented as a proportion of all cells categorized as antigen inducible marker (AIM+) cells. A one-tailed Mann–Whitney test was used to test for a statistical difference between groups; P = 0.007. d, Predicted affinities for top PT-derived peptides predicted to bind to alleles with those containing a threonine at position 233 of HLA-DRB1 (‘DRB1-233Thr’, n = 11) compared to those with an arginine (‘DRB1-233Arg’, n = 101) calculated from the Immune Epitope Database (IEDB), with a difference tested using a two-tailed Mann–Whitney test. In the box plot, the center line represents the median, the box limits denote the upper and lower quartiles, and the whiskers are 1.5 times interquartile range. **P < 0.01; NS, not significant.
Fig. 6
Fig. 6. Mapping cis-eQTL across the HLA in diverse immune cells.
a, Effect of the index variant (rs34951355) associated with differential DT response in African infants on normalized HLA-DRB1 expression in immortalized LCLs from individuals from four African populations (99 individuals from ESN, 112 from GWD, 97 from LWK and 166 from MKK). Only those with more than a single observation in each genotype category are shown. A plot of the data from the pooled set of four populations is also shown. The x-axes numbers refer to the number of copies of the C allele compared to the A allele in each group of individuals per population. Differences between allele copies within the final pooled set were calculated using unadjusted linear regression, P = 4.7 × 105. b, The effect of the same variant on normalized HLA-DRB4 expression in the same individuals as detailed in a, P = 1.6 × 10215. c, The effect of rs545690952 (a variant in LD with rs34951355) on HLA-DRB1 expression in circulating monocytes, naive B cells, naive CD4+ and CD8+ T cells and natural killer (NK) cells from 80 individuals with expression and HLA allele data available from the DICE study demonstrating a consistent direction of reduced HLA-DRB1 expression in monocytes with significance tested using linear regression. Monocytes, P = 8.6 × 10−3. d, The effect of alternate T alleles of rs72851029 on PT antibody response in the African infant GWAS, n = 2,499 with significance tested in a recessive model using linear regression, P = 6.9 × 10−29. e, The effect of rs72851029 on HLA-DRB1 expression in monocytes from 80 individuals from DICE with significance tested using a recessive model using linear regression, P = 0.001. f, The effect of rs72851029 on HLA-DQB1 expression in monocytes from the same 80 individuals with significance tested between groups using an additive model with linear regression and testing only the difference between individuals carrying one or two T alleles of the variant, P = 0.05. In the box plots, the center line represents the median, the box limits denote the upper and lower quartiles, and the whiskers are 1.5 times the interquartile range. *P ≤ 0.05, ***P ≤ 0.001.
Extended Data Fig. 1
Extended Data Fig. 1. Distributions of vaccine antibody responses in each African population.
Distributions of vaccine responses in individual VaccGene cohorts (Uganda n = 1391, South Africa n = 753, Burkina Faso n = 355) following transformation using two methods. Distributions of each vaccine response following either logarithmic (log) or inverse normal transformations (INT; used in the GWAS analyses) are shown for each population separated by colour. Individuals in South Africa (SA) did not receive pertussis pertactin or measles vaccine prior to the antibody assays being performed. Differences in log-transformed distributions are most likely due to differences in timing of sampling as highlighted in Supplementary Table 1.
Extended Data Fig. 2
Extended Data Fig. 2. Genetic association plots for each measured antibody and cohort.
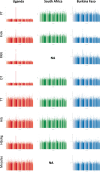
Manhattan plots of genetic association signals using linear mixed model regression with eight tested vaccine traits in three African populations (Uganda n = 1391, South Africa n = 753, Burkina Faso n = 355). For each plot the x-axis represents the position along the genome from chromosome 1 to 22 and the X chromosome. Each point represents a single variant with the y-axis being –log10(P-value).
Extended Data Fig. 3
Extended Data Fig. 3. Estimated inflation of association plots excluding the MHC region.
QQ plots of the variants tested for association using linear mixed model regression in each individual population and tested antibody response, with the extended MHC region excluded (chromosome 6, 25.5-34 Mb, build 37). The x-axis is the expected P-value and the y-axis is the observed with all points representing the tested genetic variants.
Extended Data Fig. 4
Extended Data Fig. 4. Locus-specific estimates of differentiation between pairs of African populations.
Measures of differentiation between African populations for three class I and five class II HLA genes, determined by defining the HLA alleles at 6-digit (3-field) resolution. Estimates, in GST, are between pairs of populations with the first population represented as the colour of each point, and the second as a shape of the point allowing a determination of the combination of populations through colour and shape. Admixed American populations include ACB: African Caribbean in Barbados (n = 79) and ASW: African Ancestry in Southwest USA (n = 62); BF: Burkina Faso (n = 167); ESN: Esan in Nigeria (n = 99); GWD: Gambian in Western Division, The Gambia – Mandinka (n = 112); LWK: Luhya in Webuye, Kenya (n = 97); MKK: Maasai in Kinyawa, Kenya (n = 166); MSL: Mende in Sierra Leone (n = 84); SA: South Africa (n = 396); UG: Uganda (n = 330); YRI: Yoruba in Ibadan, Nigeria (n = 110).
Extended Data Fig. 5
Extended Data Fig. 5. Merging genotyped and sequenced variants across the HLA region for an imputation panel.
The first stage in building an imputation panel involved merging variant calls defined through genotyping arrays or next-generation sequencing (NGS). To determine whether imputation calls would differ based on the origin of variant calls we compared imputation performance (using the original HLA*IMP:02 algorithm) in individuals from four African populations with variant data called by array genotyping (Array) or next-generation sequence data (NGS). Points are concordance estimates between imputed and MiSeq called HLA alleles for each gene locus. The box plot centre line represents the median; the box limits, the upper and lower quartiles; and the whiskers are the 1.5x interquartile range. ACB: African Caribbean in Barbados (n = 76); ASW: African Ancestry in Southwest USA (n = 59); LWK: Luhya in Webuye, Kenya (n = 97); YRI: Yoruba in Ibadan, Nigeria (n = 108).
Extended Data Fig. 6
Extended Data Fig. 6. Distributions of antibody responses for 13 genetic associations with vaccine response stratified by variant dosage and population.
Distributions of log10 transformed antibody levels against five vaccine antigens are shown for 2345 individuals from Africa stratified by population and dosage of genetic variant detected as most significant using the combined manual and automated regression approach described in the main text, Methods and Fig. 3. The box plot centre line represents the median; the box limits, the upper and lower quartiles; and the whiskers are the 1.5x interquartile range. Associations with significant evidence (PQ ≤ 1×10⁻³) of heterogeneity tested for using the Cochran’s Q test are highlighted with a red asterisk (*), with exact P-values provided in Supplementary Table 12. PT: pertussis toxin; FHA: pertussis filamentous hemagglutinin; DT: diphtheria toxin; HBsAg: hepatitis B surface antigen.
Extended Data Fig. 7
Extended Data Fig. 7. Assessment of other exposures on magnitude of vaccine response in VaccGene.
(a) The proportion of variance explained (r2) by variables including self-reported maternal ethnicity (including only groups containing 20 or more individuals), number of diarrhoeal episodes reported between birth and blood sampling for vaccine response measurement, number of lower respiratory tract infections, number of upper respiratory tract infections, number of episodes of malaria, presence of asymptomatic parasitaemia at the point of blood sampling and whether or not the infant was breast fed before sampling. The cohorts in which the variables were available are listed in the legend. (b) Distributions of antibody responses against DT stratified by number of diarrhoeal episodes between birth and sampling in Ugandan (UG) and South African (SA) individuals with test of significance calculated using linear regression, P in SA 0.02. (c) Distributions of antibody responses against FHA stratified by breast feeding status before blood sampling in UG individuals with test of significance performed using linear regression, P = 0.01. (d) Distributions of antibody responses against DT and HBsAg stratified by presence of asymptomatic parasitaemia at point of sampling for vaccine response in Ugandan (UG) and Burkinabe (BF) individuals with test of significance undertaken using linear regression. The P-value in BF individuals testing for HBsAg is 0.03. The box plot centre line represents the median; the box limits, the upper and lower quartiles; and the whiskers are the 1.5x interquartile range. All plots include data from 1391 Ugandan, 755 South African and 355 Burkinabe individuals. Differences in (b) to (d) tested using a 2-tailed Wilcoxon rank test. No adjustment for multiple testing was applied to any of the reported statistical associations. * P < 0.05; ** P < 0.01.
Extended Data Fig. 8
Extended Data Fig. 8. Correlating signals of HLA association with pertussis vaccine response and infection.
(a - c) Correlation of SNV beta effect estimates derived from GWAS of self-reported pertussis (causing whooping cough) and GWAS of antibody responses measured in African infants against PT (a), FHA (b) and PRN (c). Estimates were not available for pertussis GWAS for SNPs with P > 1×10⁻⁵. Two-tailed Pearson’s r coefficients of correlation were determined to be -0.86 (a), 0.19 (b) and 0.38 (c). (d-g) Correlation of HLA amino acid residue beta effect estimates derived from GWAS of self-reported whooping cough and GWAS of antibody responses against FHA (d) and PRN (f). Residues are coloured by HLA gene. The distributions of measured Pearson r following 100,000 permutations to measure the significance of correlation between effect estimates of HLA amino acids pruned by LD (r2 < 0.35) comparing responses against FHA (e) and PRN (g) are also shown. (h) The beta effect estimates for association between HLA amino acid residues and PT antibody response in the VaccGene infants are plotted against the equivalent estimates from a whooping cough GWAS following pruning of the residues by LD (r2 < 0.35). Residues are coloured by HLA gene. WC, whooping cough.
Extended Data Fig. 9
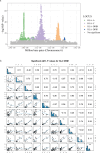
Extended Data Fig. 9. Correlating HLA gene cis-eQTL effects between peripheral immune cell types.
(a) Variants with evidence of being cis-expression quantitative trait modulators are plotted by position across the HLA against evidence of significance of impacting expression of four HLA transcripts. Only variants with significant evidence (P < 5 ×10⁻⁸) of association from the meta-analysis of estimates derived from linear regression performed in each population group are coloured by gene, with the remainder of variants coloured in grey. RNA sequence data from lymphoblastoid cell lines from 655 individuals were mapped to personalised HLA gene sequences derived from high-resolution typing. (b) The correlation in P-value estimates for variants predicted to be cis-eQTL variants in different cell types from 80 individuals included in the DICE dataset. 10 of 13 cell types are presented with scatter plots in the lower half of the table and two-tailed Spearman rho estimates in the upper half. Included cells are naïve B-cells, naïve and stimulated (STIM) CD4, and CD8 T-cells, monocytes, natural killer (NK), and follicular helper (TFH), helper-1, and helper-2 T-cells.
Extended Data Fig. 10
Extended Data Fig. 10. Effects of variants on HLA gene expression.
(a) Effect of the index variant (rs34951355) associated with differential DT response in African infants on normalised HLA-DQB1 expression in immortalised lymphoblastoid cell lines from individuals from four African populations (99 individuals from ESN, 112 from GWD, 97 from LWK, and 166 from MKK). Only those populations with more than a single observation in each of the three genotype categories are shown. A plot of the data from the pooled set of four populations is also shown. The x-axes numbers refer to the number of copies of the C allele compared to the A allele in each population. The significance of association in the Pooled set was tested using linear regression, P = 5.2×10⁻¹⁵. (b) The distribution of measured HLA-DRB4 expression in the same number of lymphoblastoid cells lines given the number of carried haplotypes where HLA-DRB4 is predicted to be absent (that is traditionally not carrying HLA-DRB1*04, *07 or *09 alleles), with significance in the pooled set tested using linear regression, P = 1.7×10-211. The box plot centre line represents the median; the box limits, the upper and lower quartiles; and the whiskers are the 1.5x interquartile range. * P < 0.05, ** P < 0.01, *** P < 0.001, NS: not significant.

References

    1. Ozawa, S. et al. Return on investment from childhood immunization in low- and middle-income countries, 2011–20. Health Aff.10.1377/hlthaff.2015.1086 (2017). - PubMed
    1. Pollard AJ, Bijker EM. A guide to vaccinology: from basic principles to new developments. Nat. Rev. Immunol. 2020;21:83–100. doi: 10.1038/s41577-020-00479-7. - DOI - PMC - PubMed
    1. Cherry JD. Epidemic pertussis in 2012–the resurgence of a vaccine-preventable disease. N. Engl. J. Med. 2012;367:785–787. doi: 10.1056/NEJMp1209051. - DOI - PubMed
    1. Cherry JD. The 112-year odyssey of pertussis and pertussis vaccines–mistakes made and implications for the future. J. Pediatr. Infect. Dis. Soc. 2019;8:334–341. doi: 10.1093/jpids/piz005. - DOI - PubMed
    1. Schrager LK, Vekemens J, Drager N, Lewinsohn DM, Olesen OF. The status of tuberculosis vaccine development. Lancet Infect. Dis. 2020;20:e28–e37. doi: 10.1016/S1473-3099(19)30625-5. - DOI - PubMed

MeSH terms