

doi: 10.1038/s41593-024-01638-y.
Epub 2024 May 13.
Brain clearance is reduced during sleep and anesthesia
Affiliations
- PMID: 38741022
- PMCID: PMC11156584
- DOI: 10.1038/s41593-024-01638-y
Item in Clipboard
Brain clearance is reduced during sleep and anesthesia
Nat Neurosci.
2024 Jun.
Erratum in
-
Author Correction: Brain clearance is reduced during sleep and anesthesia.Nat Neurosci. 2024 Jul;27(7):1425. doi: 10.1038/s41593-024-01698-0. Nat Neurosci. 2024. PMID: 38877307 Free PMC article. No abstract available.
Abstract
It has been suggested that the function of sleep is to actively clear metabolites and toxins from the brain. Enhanced clearance is also said to occur during anesthesia. Here, we measure clearance and movement of fluorescent molecules in the brains of male mice and show that movement is, in fact, independent of sleep and wake or anesthesia. Moreover, we show that brain clearance is markedly reduced, not increased, during sleep and anesthesia.
© 2024. The Author(s).
Conflict of interest statement
The authors declare no competing interests.
Figures
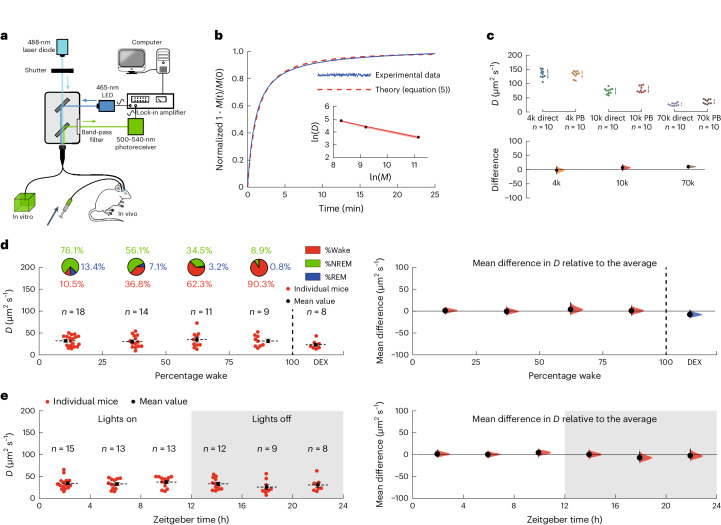
a, The experimental setup. Light from a 488-nm laser diode was passed through a 200-μm optical fiber into either an agarose gel brain phantom in vitro or the frontal cortex of a mouse in vivo. For the in vitro experiments, the agarose gel contained 4 kDa FITC-dextran while, for the in vivo experiments, the brain had been injected with 4 kDa FITC-dextran some hours earlier. b, A typical recording of photobleaching in an agarose gel brain phantom, fitted by least-squares to equation (5), to give (for this example) a value of D = 136 μm2 s−1. The inset shows that the diffusion coefficient follows a power law, with D ∝ M−0.44. The red shading in the inset shows the s.e.m. c, A comparison between the diffusion coefficients determined directly (direct) (Methods and Extended Data Fig. 3) and those determined using the photobleaching method (PB) was not significantly different (two-way ANOVA P = 0.10). Top, the individual data points. Bottom, the differences in the diffusion coefficients determined using the two methods. The agreement between the methods was excellent at 4 kDa FITC-dextran and this was used for the in vivo measurements. d, Left, the diffusion coefficients of 4 kDa FITC-dextran as a function of the percentage of wake (state) during the hour the diffusion coefficient was being measured (the distribution of vigilance states is shown in the pie charts above). Each point represents the average of typically four measurements for an individual mouse and the number of mice, n, is shown above. The last group of data on the right-hand side were recorded during dexmedetomidine (DEX) sedation. Right, the mean differences relative to the average diffusion coefficient across all vigilance states. A one-way ANOVA gave F(4,55) = 0.90; P = 0.47. (A difference of ~35% in D would have been detected.) e, Left, the diffusion coefficients as a function of zeitgeber time. Right, the mean differences relative to the average diffusion coefficient recorded over the circadian cycle. A one-way ANOVA gave F(5,64) = 0.88; P = 0.50. In c–e, the vertical solid lines show the 95% confidence intervals; the shaded areas show the distributions of likelihood. In d and e, the horizontal solid and dashed lines show the s.e.m. and the mean, respectively. Source data
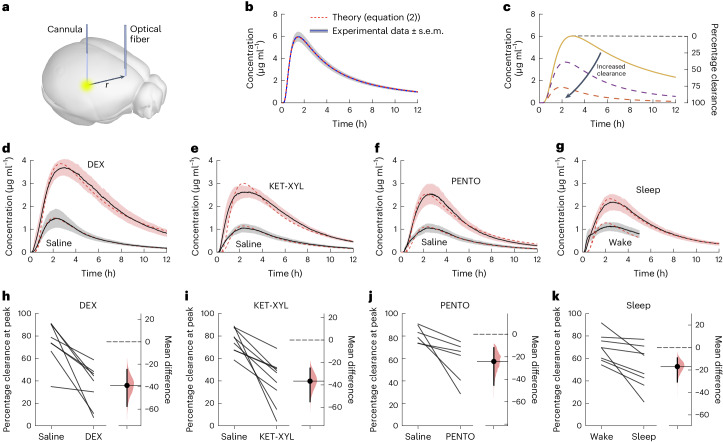
a, A fluorescent dye (AF488) was injected into the CPu and the fluorescence monitored over time in the frontal cortex. b, The spread of the dye could be accurately predicted by equation (2) in an agarose gel with a diffusion coefficient of 295 μm2 s−1, where there was zero clearance. The error envelope represents the s.e.m. c, If brain clearance of the dye is assumed to increase with time as described by equation (9), then the concentration in the frontal cortex is predicted to follow the time course given by equation (8) and is shown by the dashed lines. Knowing the concentration that should have arrived at the cortex had there been no clearance (solid line), the percentage clearance can be calculated at any time. d–g, Observed concentration curves recorded following either saline injection or DEX anesthesia (d), KET-XYL anesthesia (e), PENTO anesthesia (f) and during the waking state or during sleep (g). The observed concentrations were significantly lower (two-way ANOVA with Bonferroni–Holm multiple comparisons correction) in the waking state compared to DEX (P < 10−6), ketamine-xylazine (KET-XYL) (P < 10−6) or pentobarbital (PENTO) (P < 10−6) anesthesia or during sleep (P < 10−6). The error envelopes represent the s.e.m. h–k, Peak clearance observed following either saline injection or DEX anesthesia (h), KET-XYL anesthesia (i), PENTO anesthesia (j) and during the waking state or during sleep (k). For both anesthesia and sleep, the percentage of brain clearance was significantly reduced (two-tailed paired t-test): DEX (P = 0.0029), KET-XYL (P = 0.0015) or PENTO (P = 0.037) anesthesia or during sleep (P = 0.016). The vertical bars represent 95% confidence intervals about the mean (horizontal solid lines) and the shaded areas are the distributions of likelihood. Source data
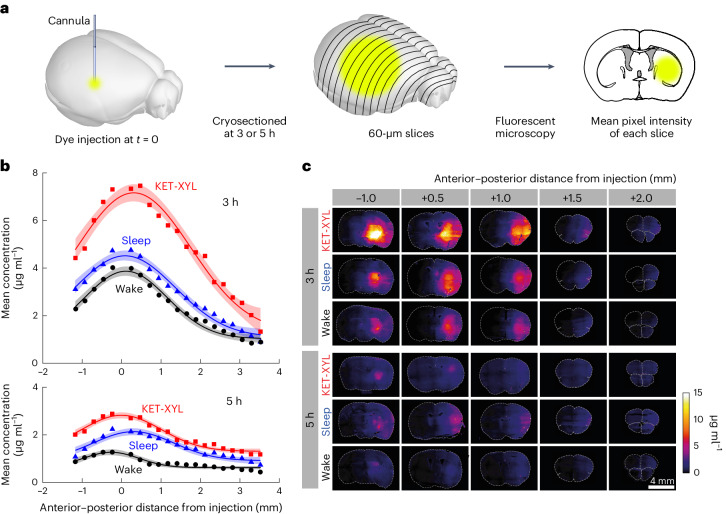
a, At either 3 or 5 h following injection of AF488 into the CPu, the brain was frozen and cryosectioned at 60 μm. The average fluorescent intensity across each slice was obtained by fluorescent microscopy; then the mean intensities across groups of four slices were averaged. b, The mean fluorescence intensity was converted to a concentration using the calibration data in Supplementary Fig. 1 plotted against the anterior–posterior distance from the point of injection for wake (black), sleep (blue) and KET-XYL (red) anesthesia. Top, the data after 3 h. Bottom, the data after 5 h. The lines are Gaussian fits to the data and the error envelopes show the 95% confidence intervals. At both 3 and 5 h, the concentrations during KET-XYL (P < 10−6 at 3 h; P < 10−6 at 5 h) and sleep (P = 0.0016 at 3 h; P < 10−4 at 5 h) were significantly larger than wake (two-way ANOVA with Bonferroni–Holm multiple comparisons correction). c, Representative images of the brain slices across the brain (anterior–posterior distance from the site of AF488 injection) at both 3 h (top three rows) and 5 h (bottom three rows). Each row represents data for the three vigilance states (wake, sleep and KET-XYL anesthesia). The color scale on the right shows the concentrations, determined using the calibration data in Supplementary Fig. 1. Source data
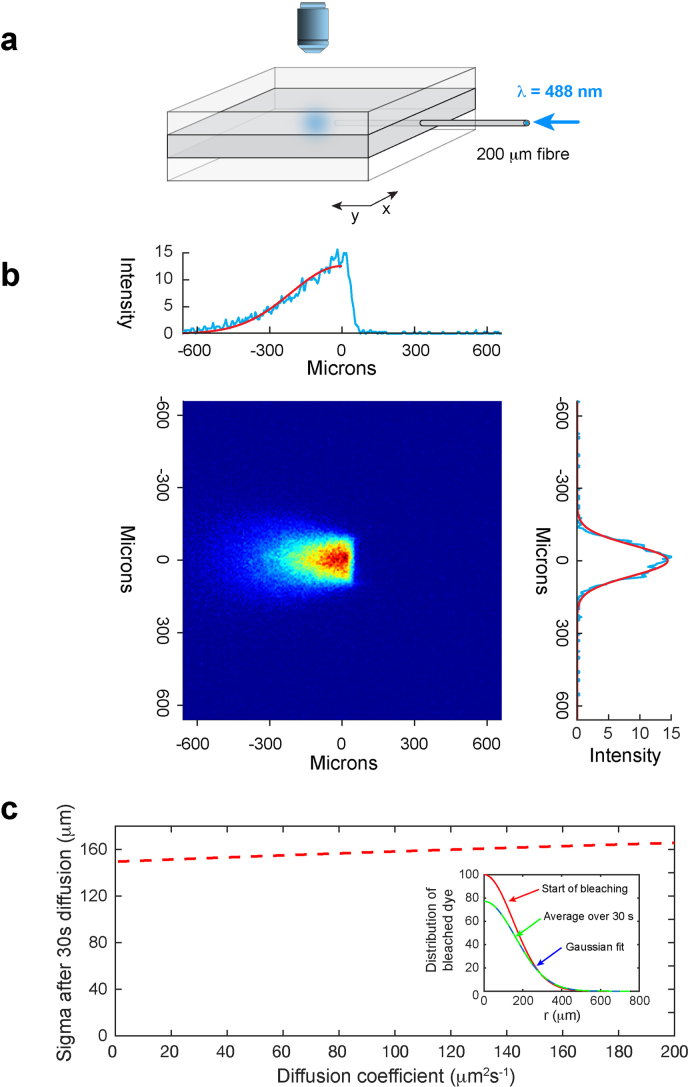
a, A thin brain slice or sheet of an agarose gel brain phantom containing FITC-dextran was sandwiched between two blocks of clear agarose (Methods). An optical fiber (core diameter 200 μm) was inserted into the brain slice or central gel and an image taken of the light distribution of a 488 nm-laser diode. b, The intensity distribution from a digitized image (blue lines) was then fit to a hemispherical Gaussian distribution (red solid lines). The average value for the standard deviations of the Gaussian fits was σ = 149.5 μm (CI [140.7, 162.6]; n = 8 independent experiments). c, There is a small change in this standard deviation due to diffusion during the 30 s of bleaching (red dashed line), which differs for each molecular weight due to the different diffusion coefficients. This was estimated by averaging the dye distribution (equation [2]) over 30 s and then fitting this to a Gaussian. Inset: An example of how the dye distribution changes during bleaching for 4 kDa FITC-dextran, D = 133.9 μm2 s−1. The red curve is the Gaussian distribution at the start of bleaching (σ = 149.5 μm), the green curve is the average distribution over 30 s, fitted to a Gaussian (blue dashed line) which gives (σ = 161.0 μm).). The values of σ that were used for the diffusion measurements in agarose gel for 4 kDa, 10 kDa and 70 kDa FITC-dextran were 152.1 μm, (CI [143.3, 165.0]; n = 8 independent experiments), 156.2 μm, (CI [147.7, 169.0]; n = 8 independent experiments) and 161.0 μm, (CI [152.6, 173.2]; n = 8 independent experiments), respectively. Source data
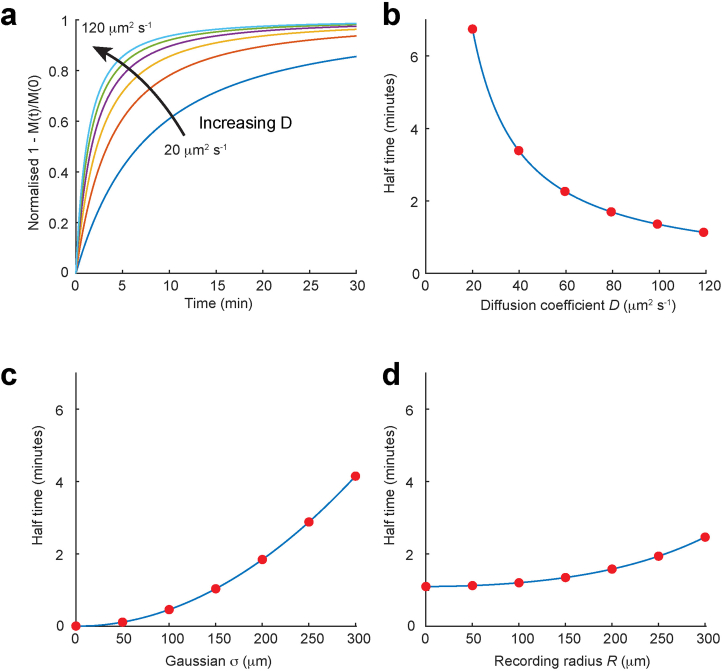
a, The time course of M(t)/M(0) for values of D from 20–120 μm2 s−1. b, Corresponding half times of M(t)/M(0) over the same range of D showing that the half times change greatly with D. c, Corresponding half times of M(t)/M(0) over the same range of D showing that the half times change greatly with σ. d, Corresponding half times of M(t)/M(0) over the same range of D showing that the half times change little with R. Derivation of equation [5]. The total number of mols M(t) of fluorescent dye in a hemisphere of radius R, is given by equation [2] multiplied by the area of a hemisphere (2πr2), integrated from 0→R (because we have assumed that the volume being recorded from is a hemisphere of radius R): This can be written as: , where and Integrating by parts gives: Using the standard integral: , we have so, finally, substituting in a and b we have Equation [5]: .
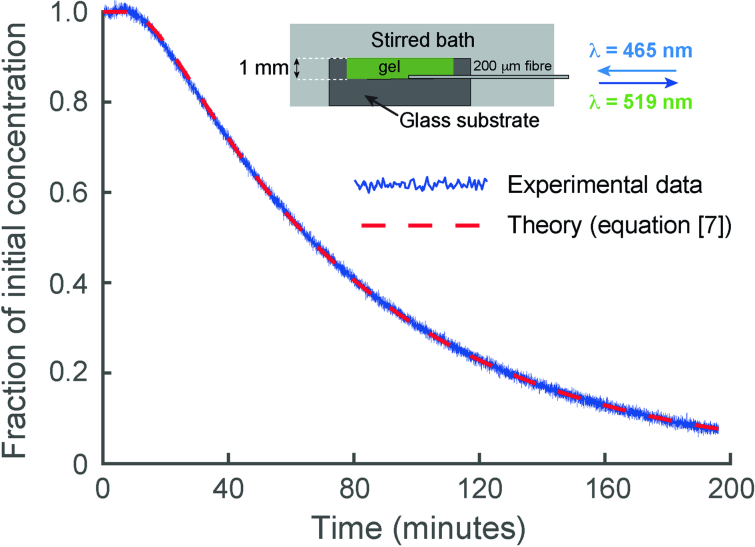
The diffusion coefficients of the FITC–dextrans in the brain phantom agarose gel were determined directly by measuring the time course of diffusion of FITC-dextran from a 1-mm thick sheet of gel, into an effectively infinite stirred water bath containing all the components of the brain phantom (except the agarose and FITC-dextran). By recording the reduction in the fluorescent signal close to the impermeable glass surface on which the gel was set, as a function of time, the diffusion coefficient could be directly determined using equation [7] (ref. ). The figure shows data from a typical experiment using 4 kDa FITC-dextran (blue trace) and the red dashed line shows the change predicted by equation [7]. Source data
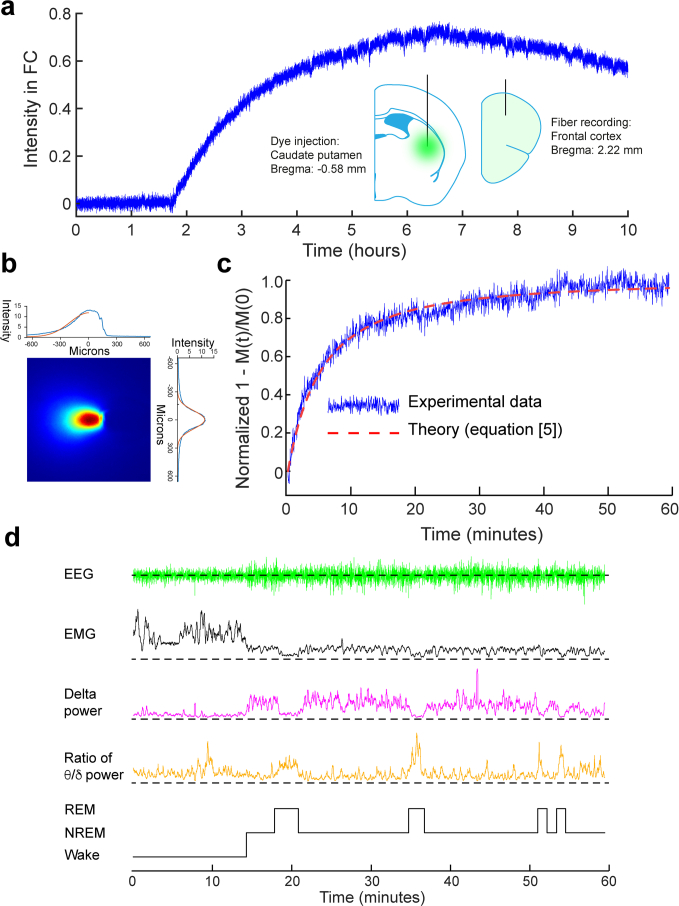
a, Fluorescent intensity measured in the frontal cortex following injection of 4 kDa FITC-dextran into the CPu (at t = 0). After a delay, fluorescent intensity rises to a maximum and then slowly decays. b, As with the experiments in gels, the spread of light in the brain had to be established. This was done using brain slices (Methods) and this figure shows a typical image obtained from a brain slice, which provided a measure of the standard deviation of the hemispherical gaussian σ. c, A typical recording in vivo of the recovery of fluorescence after photobleaching. A value for D was derived from the theoretical fit (red dashed line) to Eq. 5, as described in Methods. d, Throughout the experiment, the EEG and EMG signals were recorded and the power in the delta band (1–4 Hz) and theta band (5–10 Hz) derived, so that the vigilance state (WAKE, NREM or REM) could be determined (Methods). Source data
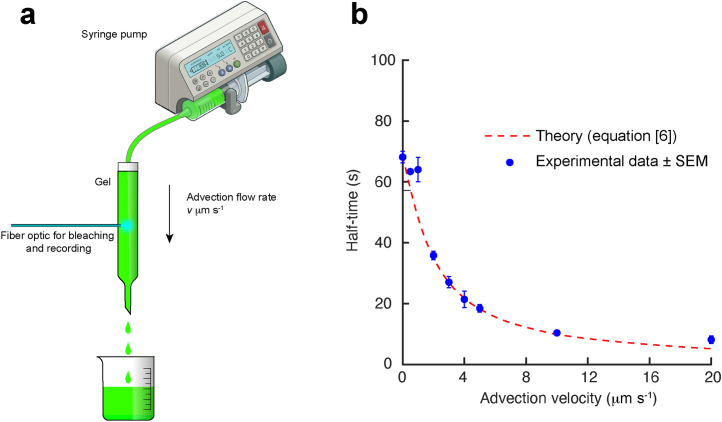
This was assessed in an in vitro experiment illustrated in a. A solution of 4 kDa FITC-dextran was passed through a gel (Methods) at a constant flow rate and the time course for the recovery of photobleaching recorded using an optical fiber, exactly as used in the experiments described in the text in vitro and in vivo. b, The observed half times were accurately predicted from equation [6] and reduced rapidly with increasing advective velocity. From the precision with which we could record changes in diffusion coefficients in vivo (Fig. 1d,e right panels) and their corresponding half times, we estimate that we would have been able to detect a change in advective flow of about 0.5 μm/s, or greater. Where error bars (SEM; n = 5 independent experiments) are not shown they were smaller than the size of the symbol. Source data
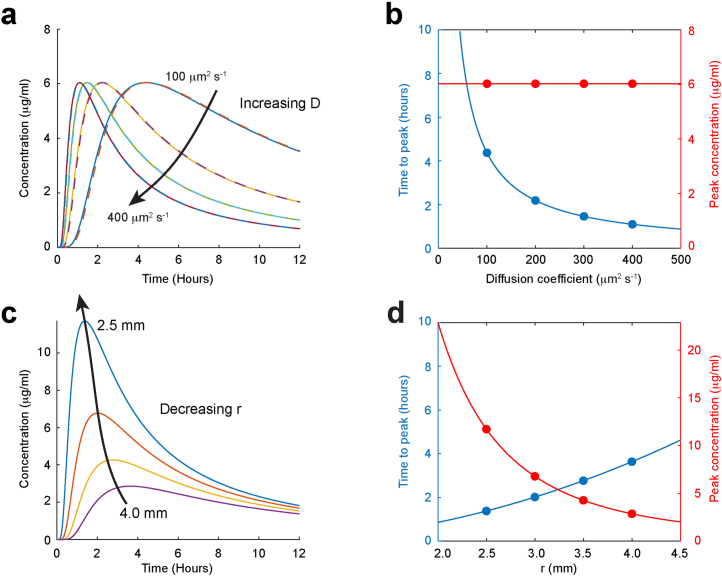
a, b According to equation [2], the concentration at a fixed distance, r, from a Gaussian source (solid lines) reaches a peak with time that depends only on the diffusion coefficient D, while the peak concentration does not change. Almost identical concentrations are predicted if the source is a sphere, rather than a Gaussian, containing the same number of moles (dashed lines). (The equation for the concentration as a function of time from a spherical source has been solved by Crank.) c,d, The peak concentration with time for a fixed diffusion coefficient, decreases with increasing distance r, with relatively small changes in the time to peak.
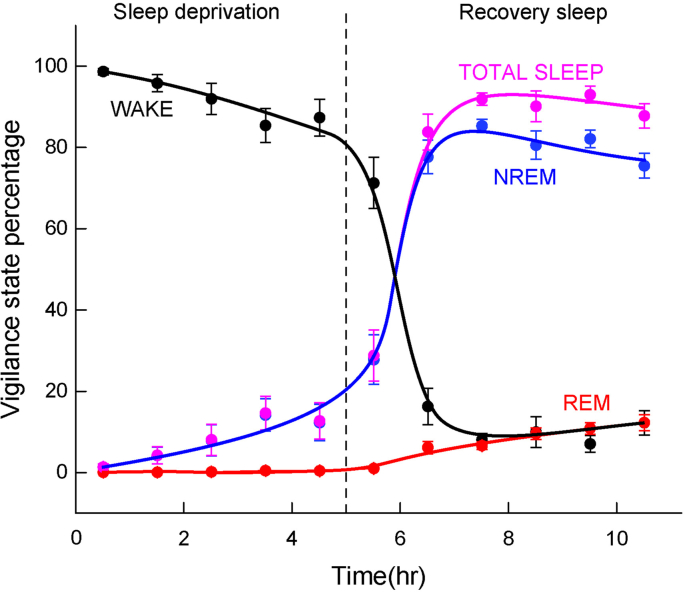
During the sleep experiments, mice were first sleep deprived by placing novel objects in their cage and after 5 hours were then allowed to sleep. The photometry measurements during the WAKE state were carried out during the five hours of sleep deprivation, where the WAKE state occurred, on average, 92% of the time (8% NREM and 0% REM). The photometry measurements during the SLEEP state were carried out after the first sleep episode following sleep deprivation. During the first five hours the vigilance state percentages were: WAKE 9.3% (n = 11 mice), NREM 80.8% (n = 13 mice), REM 9.9% (n = 13 mice), TOTAL SLEEP 90.7% (n = 13 mice). Sleep scoring of vigilance states was carried out as described in Methods. The errors bars represent SEMs. Source data
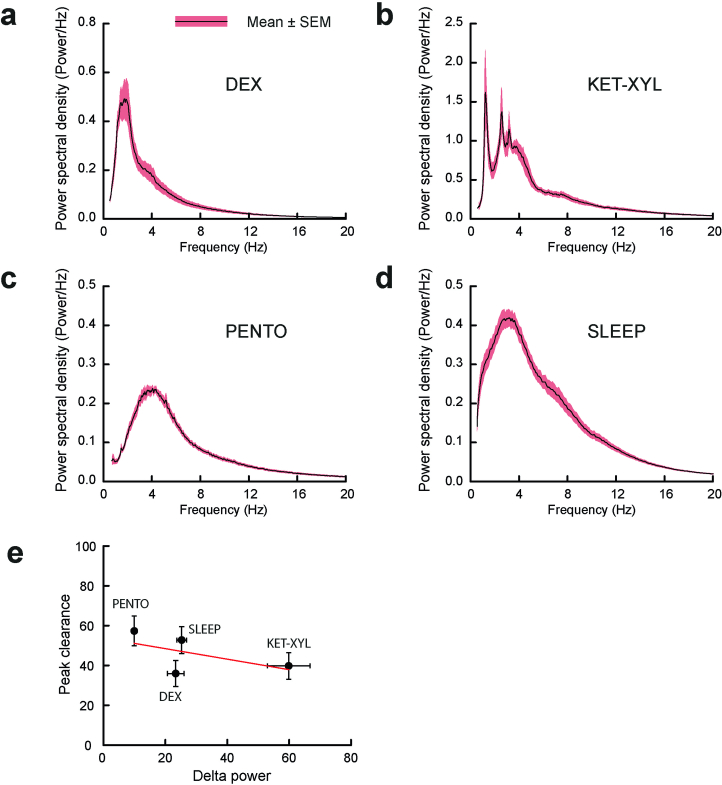
Power spectral density plots during anesthesia were calculated for the three anesthetics a-c and d, during recovery sleep. For the anesthetics, the power spectra were carried out using the EEG recorded during the first 2 hours of anesthesia (excluding the first ten minutes following injection). For sleep, the power spectra were calculated during 2 hours of recovery sleep, which included some time in WAKE (9.3%) and REM (9.9%) states. e, There was a weak negative correlation (Pearson’s correlation coefficient −0.58) between delta (0.5–4.0 Hz) power and peak clearance (see Fig. 2d–g and Extended Data Table 1). PENTO (n = 10 mice), DEX (n = 9 mice), SLEEP (n = 9 mice) and KET/XYL (n = 9 mice). The errors bars represent SEMs and where they are not shown they were smaller than the size of the symbol. Source data
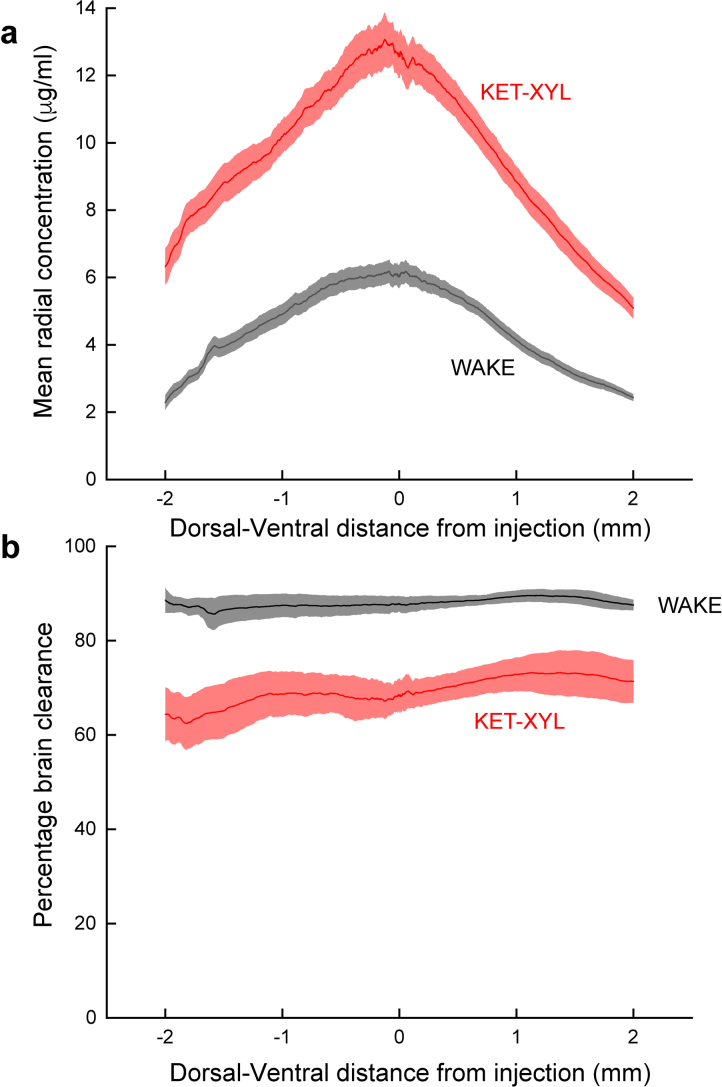
The concentration of AF488 dye 3 hours after injection into the CPu was measured at an anterior-posterior coordinate 1 mm from the site of injection. a, The concentration of dye was then calculated as a function of radial distance from the peak concentration in both the dorsal and ventral directions. As predicted by equation [8], this results in a Gaussian curve. b, Using these data (predicted by equation [8]) together with equation [2], the percentage clearance can be calculated in the dorsal and ventral directions. Two-way ANOVA shows that there is no significant change in brain clearance across the brain (p = 0.99) for both WAKE animals and those anesthetized by ketamine-xylazine. In contrast, the inhibition of clearance by ketamine-xylazine is highly significant (p < 10−6). For both panels the means are for n = 3 animals and the error envelope shows the SEMs. Source data
Comment in
-
Brain clearance not increased during sleep.Nat Rev Neurol. 2024 Jul;20(7):379. doi: 10.1038/s41582-024-00983-7. Nat Rev Neurol. 2024. PMID: 38831098 No abstract available.
References
MeSH terms
Grants and funding
LinkOut - more resources
Full Text Sources
Medical
