Brain complexity in stroke recovery after bihemispheric transcranial direct current stimulation in mice
- PMID: 38741663
- PMCID: PMC11089417
- DOI: 10.1093/braincomms/fcae137
Brain complexity in stroke recovery after bihemispheric transcranial direct current stimulation in mice
Abstract
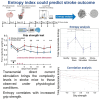
Stroke is one of the leading causes of disability worldwide. There are many different rehabilitation approaches aimed at improving clinical outcomes for stroke survivors. One of the latest therapeutic techniques is the non-invasive brain stimulation. Among non-invasive brain stimulation, transcranial direct current stimulation has shown promising results in enhancing motor and cognitive recovery both in animal models of stroke and stroke survivors. In this framework, one of the most innovative methods is the bihemispheric transcranial direct current stimulation that simultaneously increases excitability in one hemisphere and decreases excitability in the contralateral one. As bihemispheric transcranial direct current stimulation can create a more balanced modulation of brain activity, this approach may be particularly useful in counteracting imbalanced brain activity, such as in stroke. Given these premises, the aim of the current study has been to explore the recovery after stroke in mice that underwent a bihemispheric transcranial direct current stimulation treatment, by recording their electric brain activity with local field potential and by measuring behavioural outcomes of Grip Strength test. An innovative parameter that explores the complexity of signals, namely the Entropy, recently adopted to describe brain activity in physiopathological states, was evaluated to analyse local field potential data. Results showed that stroke mice had higher values of Entropy compared to healthy mice, indicating an increase in brain complexity and signal disorder due to the stroke. Additionally, the bihemispheric transcranial direct current stimulation reduced Entropy in both healthy and stroke mice compared to sham stimulated mice, with a greater effect in stroke mice. Moreover, correlation analysis showed a negative correlation between Entropy and Grip Strength values, indicating that higher Entropy values resulted in lower Grip Strength engagement. Concluding, the current evidence suggests that the Entropy index of brain complexity characterizes stroke pathology and recovery. Together with this, bihemispheric transcranial direct current stimulation can modulate brain rhythms in animal models of stroke, providing potentially new avenues for rehabilitation in humans.
Keywords: entropy; local field potential; stroke; tDCS.
© The Author(s) 2024. Published by Oxford University Press on behalf of the Guarantors of Brain.
Conflict of interest statement
The authors report no competing interests.
Figures


References
-
- O'Donnell MJ, Chin SL, Rangarajan S, et al. Global and regional effects of potentially modifiable risk factors associated with acute stroke in 32 countries (INTERSTROKE): A case-control study. Lancet. 2016;388(10046):761–775. - PubMed
-
- Vecchio F, Caliandro P, Reale G, et al. Acute cerebellar stroke and middle cerebral artery stroke exert distinctive modifications on functional cortical connectivity: A comparative study via EEG graph theory. Clin Neurophysiol. 2019;130(6):997–1007. - PubMed
-
- Bernhardt J, Godecke E, Johnson L, Langhorne P. Early rehabilitation after stroke. Curr Opin Neurol. 2017;30(1):48–54. - PubMed
LinkOut - more resources
Full Text Sources
Research Materials
