. 2024 Apr 23;27(5):109800.
doi: 10.1016/j.isci.2024.109800. eCollection 2024 May 17.

ALK inhibitors suppress HCC and synergize with anti-PD-1 therapy and ABT-263 in preclinical models

Affiliations

ALK inhibitors suppress HCC and synergize with anti-PD-1 therapy and ABT-263 in preclinical models

Suresh Bugide et al. iScience. .

Abstract

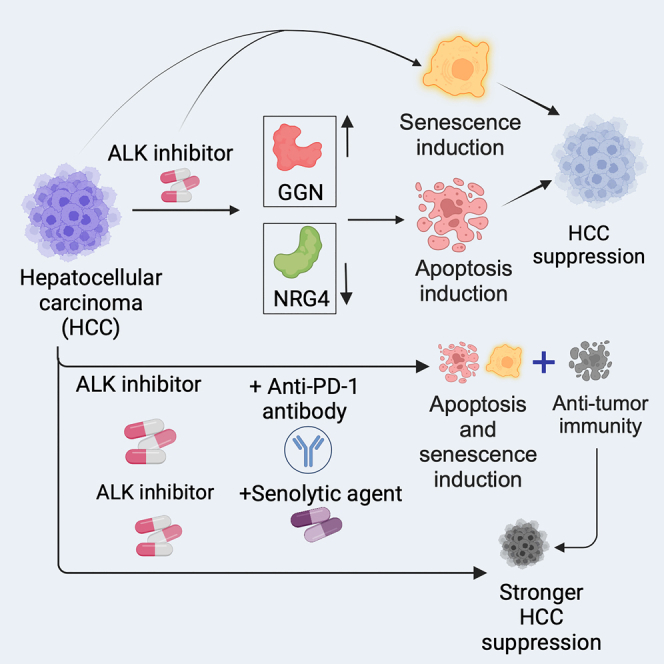
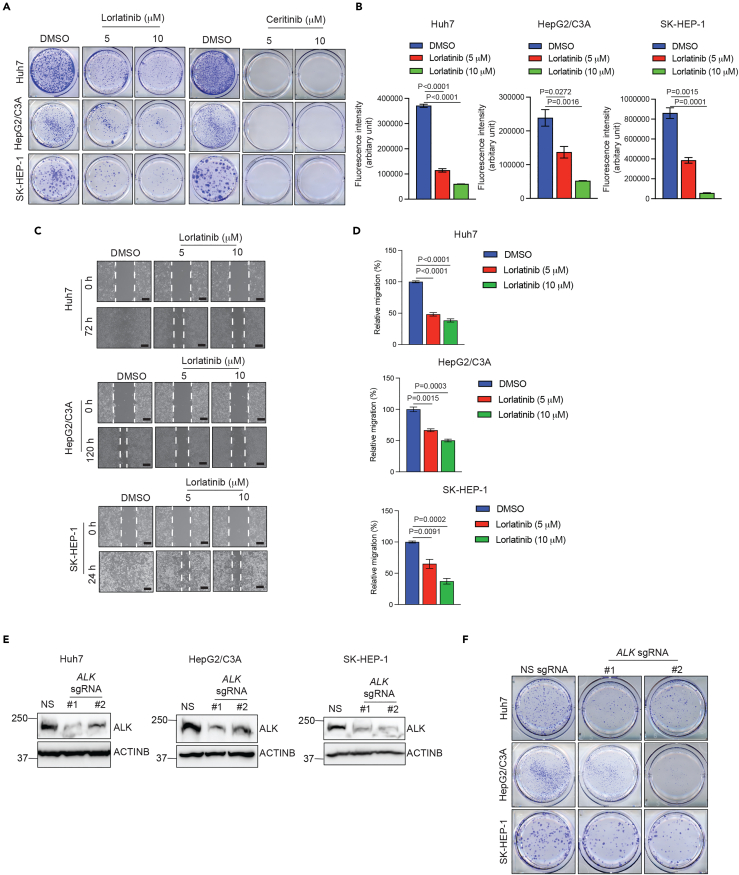
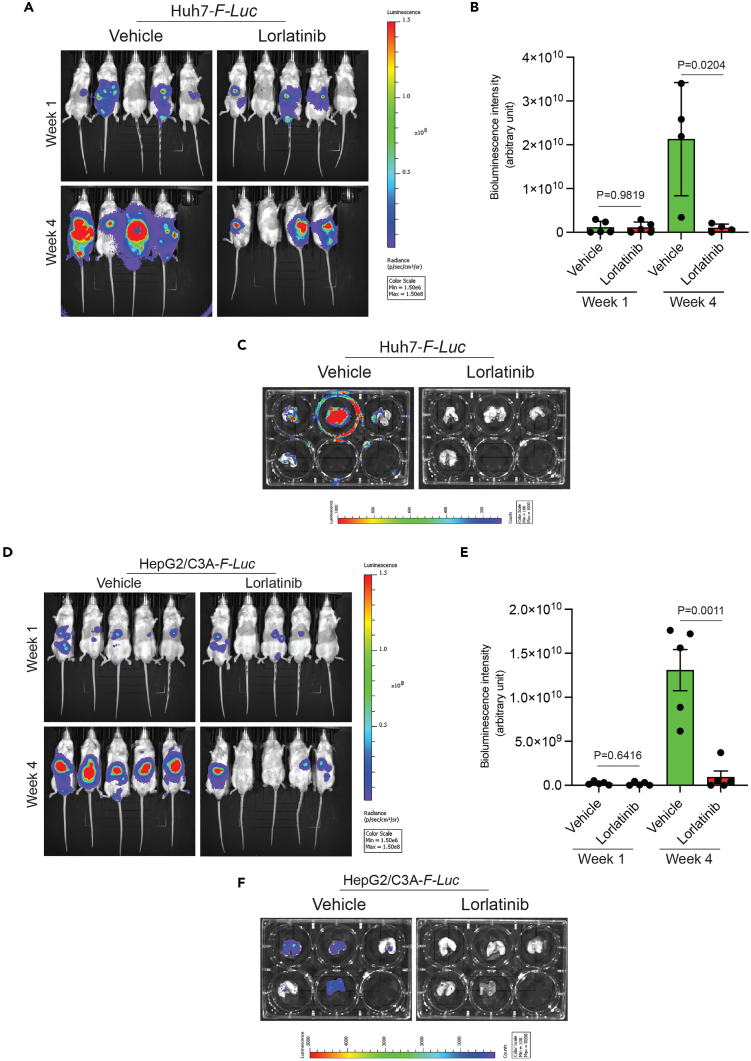
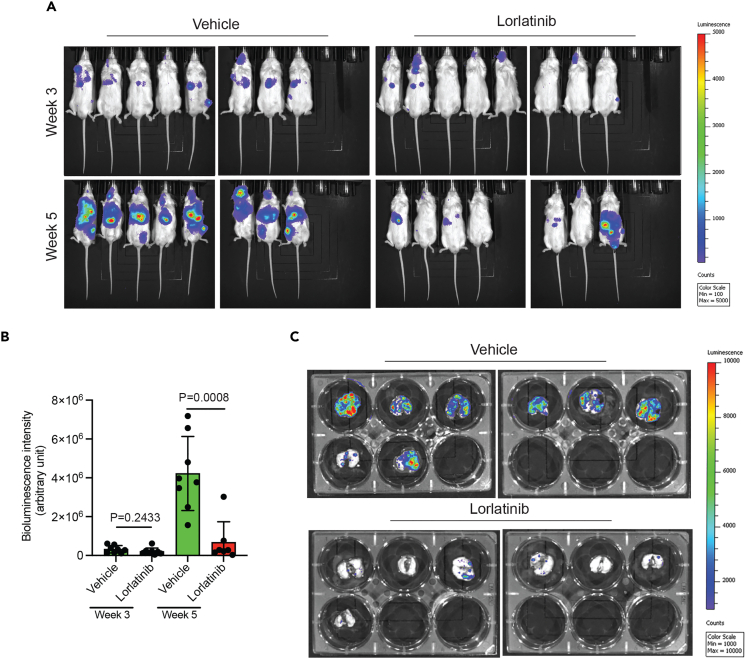
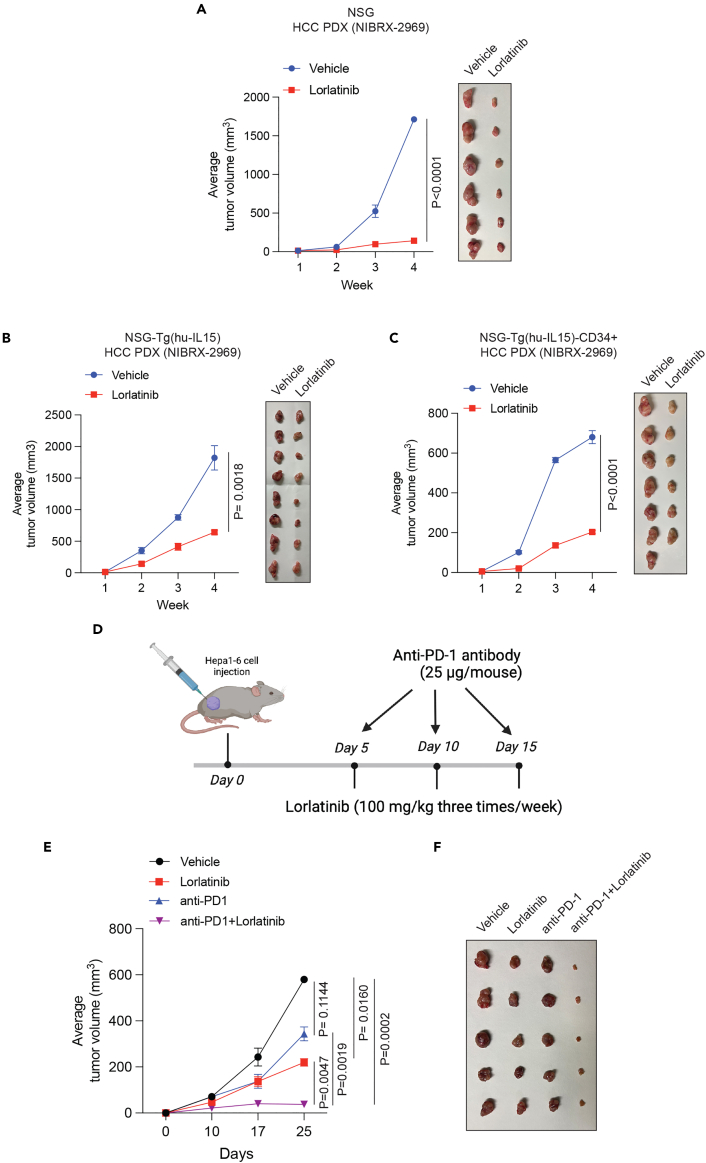
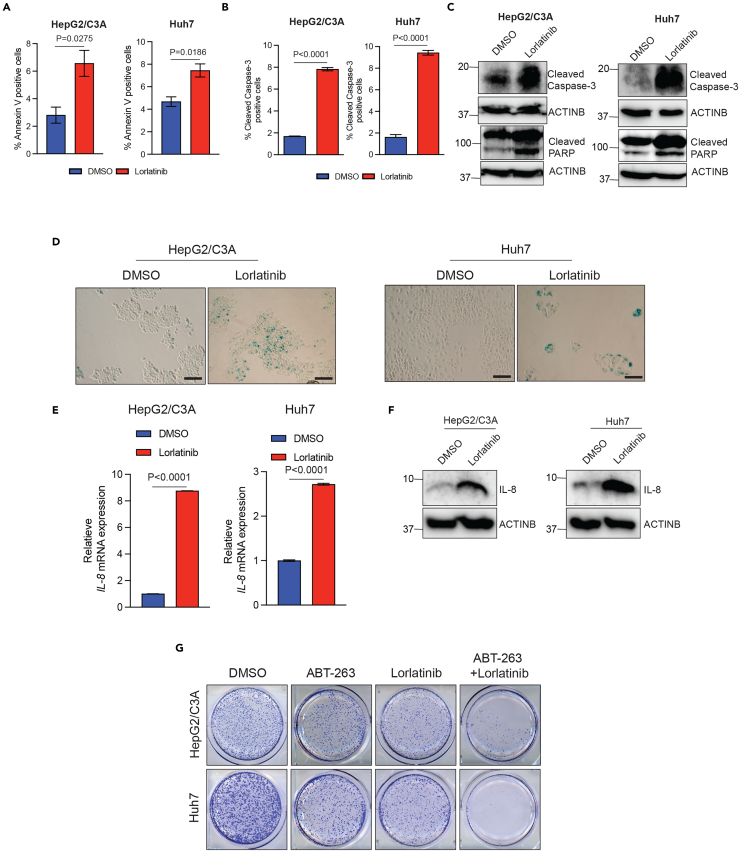
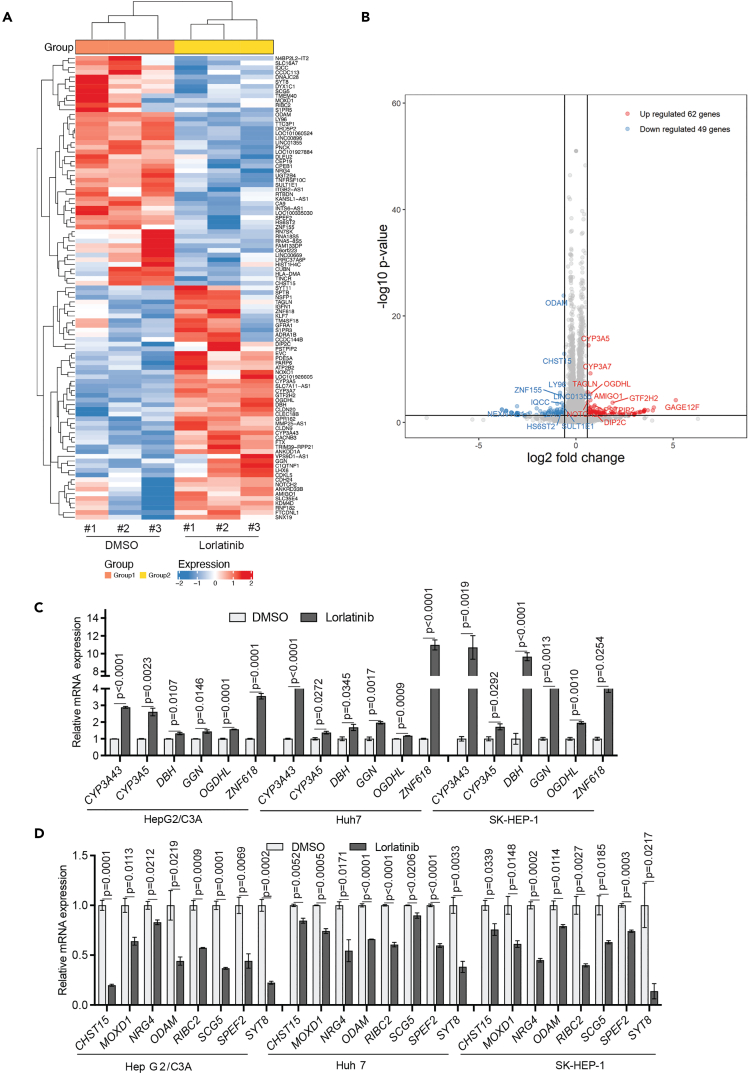
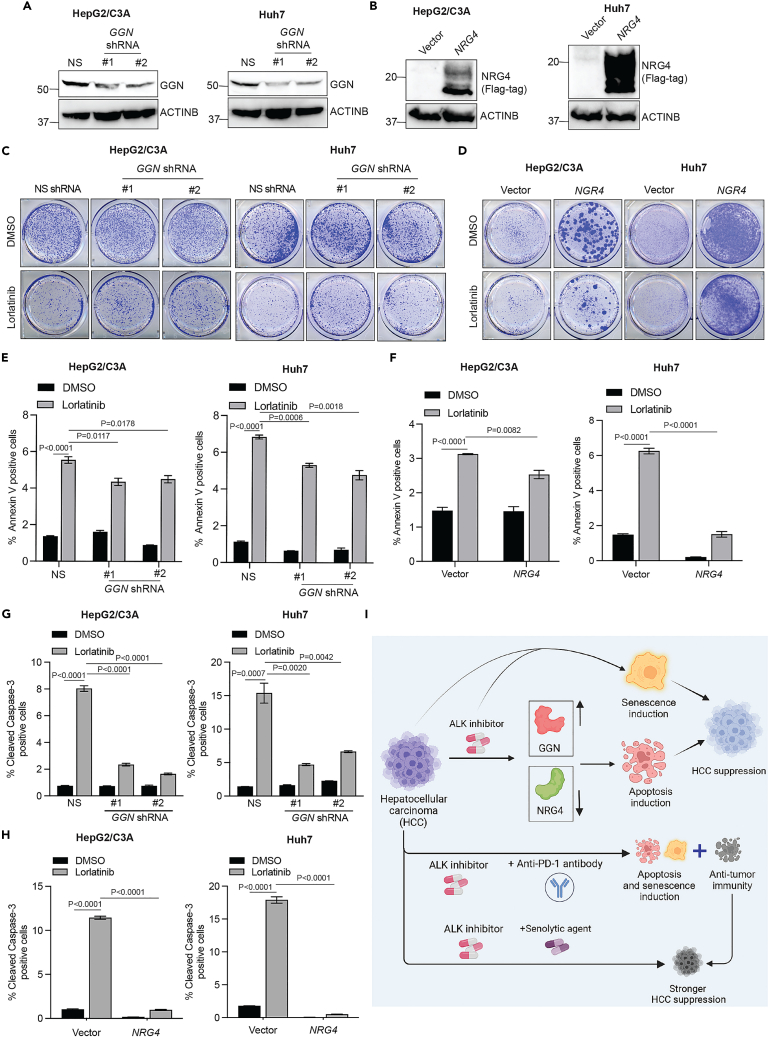
Hepatocellular carcinoma (HCC) currently lacks effective therapies, leaving a critical need for new treatment options. A previous study identified the anaplastic lymphoma kinase (ALK) amplification in HCC patients, raising the question of whether ALK inhibitors could be a viable treatment. Here, we showed that both ALK inhibitors and ALK knockout effectively halted HCC growth in cell cultures. Lorlatinib, a potent ALK inhibitor, suppressed HCC tumor growth and metastasis across various mouse models. Additionally, in an advanced immunocompetent humanized mouse model, when combined with an anti-PD-1 antibody, lorlatinib more potently suppressed HCC tumor growth, surpassing individual drug efficacy. Lorlatinib induced apoptosis and senescence in HCC cells, and the senolytic agent ABT-263 enhanced the efficacy of lorlatinib. Additional studies identified that the apoptosis-inducing effect of lorlatinib was mediated via GGN and NRG4. These findings establish ALK inhibitors as promising HCC treatments, either alone or in combination with immunotherapies or senolytic agents.

Keywords: Biological sciences; Cancer; Cancer systems biology; Natural sciences; Pharmacology; Systems biology.


Conflict of interest statement

The authors declare no competing interests.

Figures

None
Graphical abstract
Figure 1
Figure 1
ALK inhibition suppresses HCC growth and metastatic attributes in cell culture models (A) Indicated HCC cell lines were treated with DMSO or indicated concentrations of lorlatinib or ceritinib and analyzed by clonogenic assay. Representative wells for the indicated HCC cell lines under the indicated treatment conditions are shown. (B) Indicated HCC cell lines were treated with DMSO or indicated concentrations of lorlatinib and analyzed by quantitative soft agar assay. Fluorescence intensities (Arbitrary units) are plotted. For Huh7, p < 0.0001 (DMSO versus Lorlatinib 5 μM (n = 3 each)), t = 28.01, df = 4, and p < 0.0001 (DMSO versus Lorlatinib 10 μM (n = 3 each). t = 50.03, df = 4. For HepG2/C3A, p = 0.0272 (DMSO versus Lorlatinib 5 μM (n = 3 each), t = 3.402, df = 4), and p = 0.0016 (DMSO versus Lorlatinib 10 μM (n = 3 each)), t = 7.615, df = 4. For SK-HEP-1, p = 0.0015 (DMSO versus Lorlatinib 5 μM (n = 3 each)), t = 7.799, df = 4, and for p = 0.0001 (DMSO versus Lorlatinib 10 μM (n = 3 each)), t = 14.93, df = 4. p values were calculated using a two-tailed, unpaired Student’s t test. (C) Indicated HCC cell lines were treated with DMSO or indicated concentrations of lorlatinib, and cell migration was analyzed using a wound healing assay. Representative images under indicated treatment conditions for indicated HCC cell lines are shown. Scale bar, 200 μm. (D) Bar diagrams are presented to show relative migration (%) from the experiment presented in (C). For Huh7, p < 0.0001 (DMSO versus Lorlatinib 5 μM (n = 3 each), t = 16.11, df = 4, and for p < 0.0001 (DMSO versus Lorlatinib 10 μM (n = 3 each). t = 20.53, df = 4. For HepG2/C3A, p = 0.0015 (DMSO versus Lorlatinib 5 μM (n = 3 each)), t = 7.729, df = 4), and p = 0.0003 (DMSO versus Lorlatinib 10 μM (n = 3 each)), t = 11.77, df = 4. For SK-HEP-1, p = 0.0091 (DMSO versus Lorlatinib 5 μM (n = 3 each)), t = 4.736, df = 4, and for p = 0.0002 (DMSO versus Lorlatinib 10 μM (n = 3 each)), t = 13.01, df = 4. p values were calculated using a two-tailed, unpaired Student’s t test. (E) Indicated HCC cell lines expressing either non-specific sgRNA or ALK-specific sgRNAs were analyzed for ALK protein expression using immunoblotting. ACTINB was used as a loading control. (F) Indicated HCC cell lines expressing either non-specific sgRNA or ALK-specific sgRNAs were analyzed for colony formation using clonogenic assays. Representative wells for the indicated HCC cell lines under indicated conditions are shown. Data are presented as the mean ± SEM; See also, Figures S1 and S2.
Figure 2
Figure 2
Lorlatinib inhibits tumor growth and metastatic progression in the orthotopic mouse model of human HCC xenograft (A) Firefly luciferase (F-Luc)-labeled Huh7 cells (Huh7-F-Luc) were orthotopically injected into the liver of NSG mice (n = 5) followed by treatment with lorlatinib (100 mg/kg) or vehicle (10% DMSO, 40% PEG 300, 5% Tween-80, and 45% saline) after 1 week of injecting the cells. Tumor growth was monitored using F-Luc-based bioluminescence imaging. Mouse bioluminescence images at the indicated time points are shown. (B) Bioluminescent intensities (arbitrary units) for the mice are shown in (A) is plotted. For p = 0.9819 (Week 1, Vehicle versus Lorlatinib (n = 5 each)), t = 0.02344, df = 8, and p = 0.0204 (Week 4, Vehicle versus Lorlatinib (n = 4 each)), t = 11.77, df = 6. p values were calculated using a two-tailed, unpaired Student’s t test. (C) Bioluminescence images of the lungs of mice isolated at the end of the experiment from the mice shown in (A). (D) Firefly luciferase-labeled HepG2/C3A (HepG2/C3A-F-Luc) cells were orthotopically injected into the liver of NSG mice (n = 5) followed by treatment with lorlatinib (100 mg/kg) or vehicle (10% DMSO, 40% PEG 300, 5% Tween-80, and 45% saline) after 1 week of injecting the cells. Tumor growth was monitored using F-Luc-based bioluminescence imaging. Mouse bioluminescence images at the indicated time points are shown. (E) Bioluminescent intensities (arbitrary units) for the mice shown in (D) are plotted. For p = 0.6416 (week 1, vehicle versus lorlatinib (n = 5 each)), t = 0.4837, df = 8), and p = 0.0011 (week 4, vehicle versus lorlatinib (n = 5 each)), t = 4.973.77, df = 8. p values were calculated using a two-tailed, unpaired Student’s t test. (F) Bioluminescence images of the lungs of mice isolated at the end of the experiment from the mice shown in (D). Data are presented as the mean ± SEM.
Figure 3
Figure 3
Lorlatinib inhibits the lung metastatic growth of HCC in mice (A) Firefly luciferase-labeled SK-HEP-1 (SK-HEP-1-F-Luc) cells were injected into NSG mice (n = 8) to achieve lung metastasis, followed by treatment with lorlatinib (100 mg/kg) or vehicle (10% DMSO, 40% PEG 300, 5% Tween-80, and 45% saline) after 1 week of injecting the cells. Metastatic growth of SK-HEP-1-F-Luc cells was monitored using F-Luc-based bioluminescence imaging. Mouse bioluminescence images at the indicated time points are shown. (B) Bioluminescent intensities (arbitrary units) for the mice shown in (A) are plotted. For p = 0.2433 (week 1, vehicle versus lorlatinib (n = 8 each)), t = 1.218, df = 14, and p = 0.0008 (week 3, vehicle (n = 8) versus lorlatinib (n = 7)), t = 4.356, df = 13. p values were calculated using a two-tailed, unpaired Student’s t test. (C) Bioluminescence images of the lungs of mice isolated at the end of the experiment from the mice shown in (A). Data are presented as the mean ± SEM.
Figure 4
Figure 4
Lorlatinib blocks HCC PDX tumor growth and enhances the anti-tumor effect of the anti-PD-1 antibody (A) HCC PDX (NIBRX-2969) was injected subcutaneously into NSG mice (n = 6). When the tumor volumes reached approximately 100 mm3, HCC PDX-bearing mice were treated with lorlatinib (100 mg/kg) or vehicle. Tumor volumes were measured at indicated weeks. Average tumor volumes are plotted on the left and tumor pictures are shown on the right. p < 0.0001 for vehicle versus lorlatinib (n = 6 each)), t = 8.189, df = 10. Statistical assessments were performed by first calculating the area under the curve (AUC), which was then used for p value calculations using a two-tailed, unpaired Student’s t test. (B) HCC PDX (NIBRX-2969) was subcutaneously injected into the flanks of immunodeficient NSG-Tg(hu-L15) mice. When the tumor volumes reached approximately 100 mm3, HCC PDX-bearing mice were treated with lorlatinib (100 mg/kg) or vehicle. Tumor volumes were measured at indicated weeks. Average tumor volumes are plotted on the left, and tumor pictures are shown on the right. p = 0.0018 for vehicle versus lorlatinib (n = 8 each), t = 3.827, df = 14. Statistical assessments were performed by first calculating the area under the curve (AUC), which was then used for p value calculations using a two-tailed, unpaired Student’s t test. (C) HCC PDX (NIBRX-2969) was injected subcutaneously into immunocompetent NSG-Tg(hu-L15)-CD34 mice. When the tumor volumes reached approximately 100 mm3, HCC PDX-bearing mice were treated with lorlatinib (100 mg/kg) or vehicle. Tumor volumes were measured at indicated weeks. Average tumor volumes are plotted on the left and tumor pictures are shown on the right. p < 0.0001 for Vehicle (n = 7) versus Lorlatinib (n = 6), t = 12.25, df = 11. Statistical assessments were performed by first calculating the area under the curve (AUC), which was then used for p value calculations using a two-tailed, unpaired Student’s t test. (D) Schematic showing the experimental design for lorlatinib and anti-PD-1 antibody therapy in Hepa1-6-derived tumor-bearing C57BL/6 mice. (E) Hepa1-6 cells were injected subcutaneously into the flank of C57BL/6 mice. When the tumor volumes reached approximately 100 mm3, HCC PDX-bearing mice were treated with vehicle, lorlatinib (100 mg/kg), anti-PD-1 mAb (25 μg/mice), or combination of lorlatinib and anti-PD-1. Tumor volumes were measured at indicated time points. The average tumor volumes for indicated treatment conditions are shown. p = 0.0160 for vehicle (n = 12) versus lorlatinib (n = 11), t = 2.620, df = 21. p = 0.1144 for vehicle (n = 12) versus anti-PD-1 (n = 9), t = 1.655, df = 19. p = 0.0002 for vehicle (n = 12) versus anti-PD-1+lorlatinib (n = 10), t = 4.638, df = 20. p = 0.0047 for lorlatinib (n = 11) versus anti-PD-1+ lorlatinib (n = 10), t = 3.197, df = 19. p = 0.0019 for anti-PD-1 (n = 9) versus anti-PD-1+lorlatinib (n = 10), t = 3.669, df = 17. Statistical assessments were performed by first calculating the area under the curve (AUC), which was then used for p value calculations using a two-tailed, unpaired Student’s t test. (F) Representative tumors (n = 5) under the indicated conditions are shown. Data are presented as the mean ± SEM.
Figure 5
Figure 5
Lorlatinib-mediated ALK pathway inhibition results in apoptosis and senescence induction, and the senolytic agent ABT-263 enhance the efficacy of lorlatinib against HCC cells (A) HepG2/C3A and Huh7 cells were treated with lorlatinib (10 μM) or DMSO for 96 h and then analyzed by fluorescence-activated cell sorting (FACS)-based annexin V-PE staining to analyze the apoptotic rates. For HepG2/C3A, p = 0.0275 (DMSO versus lorlatinib (n = 3 each)), t = 3.391837, df = 4. For Huh7, p = 0.0186 (DMSO versus lorlatinib (n = 3 each)), t = 3.830, df = 4. p values were calculated using a two-tailed, unpaired Student’s t test. (B) HepG2/C3A and Huh7 cells were treated with lorlatinib (10 μM) or DMSO for 96 h and then analyzed by fluorescence-activated cell sorting (FACS)-based cleaved caspase-3 staining. For HepG2/C3A, p < 0.0001 (DMSO versus lorlatinib (n = 3 each)), t = 39.89, df = 4. For Huh7, p < 0.0001 (DMSO versus lorlatinib (n = 3 each)), t = 24.36, df = 4. p values were calculated using a two-tailed, unpaired Student’s t test. (C) HepG2/C3A and Huh7 cells were treated with lorlatinib or DMSO for 96 h and then analyzed for cleaved-caspase3 and cleaved PARP. ACTINB was used as a loading control. (D) HepG2/C3A and Huh7 cells were treated with lorlatinib or DMSO for 96 h and then analyzed for senescence-associated β-galactosidase assay (SA β-gal). Representative images for HepG2/C3A and Huh7 cells treated with either lorlatinib or DMSO. Scale bar, 100 μm. (E) HepG2/C3A, Huh7 cells treated with lorlatinib (10 μM) or DMSO and IL-8 gene expression was analyzed using RT-qPCR. ACTINB mRNA expression was used as an internal normalization control. Relative IL-8 mRNA expression is plotted. For HepG2/C3A, p < 0.0001 (DMSO versus lorlatinib (n = 3 each)), t = 974.0, df = 4. For Huh7, p < 0.0001 (DMSO versus lorlatinib (n = 3 each)), t = 67.71, df = 4. p values were calculated using a two-tailed, unpaired Student’s t test. (F) HepG2/C3A, Huh7cells treated with lorlatinib (10 μM) or DMSO and IL-8 protein expression was analyzed using immunoblotting. ACTINB was used as a loading control. (G) HepG2/C3A and Huh7 cells were treated with DMSO, lorlatinib, ABT-263, or both lorlatinib and ABT-263, and clonogenic assay was performed. Representative wells for the HepG2/C3A and Huh7 cells under the indicated treatment conditions are shown. All quantitative data represent the mean ± SEM.
Figure 6
Figure 6
Transcriptome-wide mRNA expression profiling identifies Lorlatinib-responsive gene signature in HCC cells (A and B) HepG2/C3A cells were treated with either DMSO, or 1 μM lorlatinib for 24 h, after which RNA sequencing was performed. Heatmap (A) showing the top 100 most differentially regulated genes in lorlatinib treatment compared to DMSO treatment is shown. Volcano plot (B) showing differentially expressed genes in lorlatinib compared to DMSO-treated HepG2/C3A cells. (C) mRNA expression for indicated genes that were identified to be upregulated from RNA-seq measured by RT-qPCR in HepG2/C3A, Huh7, and SK-HEP-1 cells after treatment with lorlatinib compared to cells treated with DMSO. ACTINB mRNA expression was used as an internal normalization control. Relative mRNA expression (n = 3 each) for indicated genes is plotted. For HepG2/C3A for CYP3A43 gene p < 0.0001, t = 36.71, df = 4, CYP3A5 gene p = 0.0023, t = 6.907, df = 4, DBH gene p = 0.0107, t = 4.516, df = 4, GGN gene p = 0.0146, t = 4.120, df = 4, OGDHL gene p = 0.0001, t = 14.57, df = 4, ZNF618 gene p = 0.0001, t = 15.25, df = 4. For Huh7 for CYP3A43 gene p < 0.0001, t = 18.40, df = 4, CYP3A5 gene p = 0.0272, t = 3.403, df = 4, DBH gene p = 0.0345, t = 3.150, df = 4, GGN gene p = 0.0017, t = 7.508, df = 4, OGDHL gene p = 0.0009, t = 8.744, df = 4, ZNF618 gene p < 0.0001, t = 17.81, df = 4. For SK-HEP-1 for CYP3A43 gene p = 0.0019, t = 7.315, df = 4, CYP3A5 gene p = 0.0292, t = 3.328, df = 4, DBH gene p < 0.0001, t = 15.66, df = 4, GGN gene p = 0.0013, t = 8.063, df = 4, OGDHL gene p = 0.0010, t = 8.518, df = 4, ZNF618 gene p = 0.0254, t = 3.477, df = 4. p values were calculated using a two-tailed, unpaired Student’s t test. (D) mRNA expression for indicated genes that were identified to be downregulated from RNA-seq measured by RT-qPCR in HepG2/C3A, Huh7, and SK-HEP-1 cells after treatment with lorlatinib compared to cells treated with DMSO. ACTINB mRNA expression was used as an internal normalization control. Relative mRNA expression (n = 3 each) for indicated genes is plotted. For HepG2/C3A for CHST15 gene p = 0.0001, t = 15.54, df = 4, MOXD1 gene p = 0.0113, t = 4.448, df = 4, NRG4 gene p = 0.0212, t = 3.683, df = 4, ODAM gene p = 0.0219, t = 3.646, df = 4, RIBC2 gene p = 0.0009, t = 8.759, df = 4, SCG5 gene p = 0.0001, t = 14.89, df = 4, SPEF2 gene p = 0.0069, t = 5.120, df = 4, SYT8 gene p = 0.0002, t = 12.73, df = 4. For Huh7 for CHST15 gene p = 0.0052, t = 5.548, df = 4, MOXD1 gene p = 0.0005, t = 10.59, df = 4, NRG4 gene p = 0.0171, t = 3.930, df = 4, ODAM gene p < 0.0001, t = 22.11, df = 4, RIBC2 gene p < 0001, t = 16.45, df = 4, SCG5 gene p = 0.0206, t = 3.711, df = 4, SPEF2 gene p < 0.0001, t = 17.52, df = 4, SYT8 gene p = 0.0033, t = 6.274, df = 4. For SK-HEP-1 for CHST15 gene p = 0.0339, t = 3.167, df = 4, MOXD1 gene p = 0.0148, t = 4.103, df = 4, NRG4 gene p = 0.0002, t = 13.78, df = 4, ODAM gene p = 0.0114, t = 4.438, df = 4, RIBC2 gene p = 0.0027, t = 6.639, df = 4, SCG5 gene p = 0.0185, t = 3.838, df = 4, SPEF2 gene p = 0.0003, t = 11.80, df = 4, SYT8 gene p = 0.0217, t = 3.654, df = 4. p values were calculated using a two-tailed, unpaired Student’s t test. All quantitative data represent the mean ± SEM; see also, Figures S3 and S4 and Table S1.
Figure 7
Figure 7
GGN upregulation and NRG4 downregulation following ALK inhibition in part mediated the HCC-suppressive effects of lorlatinib (A) Indicated HCC cell lines expressing either non-specific shRNA or GGN-specific shRNAs were analyzed for GGN protein expression using immunoblotting. ACTINB was used as a loading control. (B) Indicated HCC cell lines expressing either empty vector or NRG4 ORF were analyzed for NRG4 protein expression using immunoblotting. ACTINB was used as a loading control. (C) HepG2/C3A and Huh7 cells expressing an NS or GGN shRNAs were treated with lorlatinib (10 μM) or DMSO, and survival was measured in clonogenic assays. Representative wells for cells grown under the indicated conditions are shown. (D) HepG2/C3A and Huh7 cells expressing empty vector or NRG4 ORFs were treated with lorlatinib (10 μM) or DMSO, and survival was measured in clonogenic assays. Representative wells for cells grown under the indicated conditions are shown. (E) HepG2/C3A or Huh7 cells expressing either NS- or GGN-specific shRNAs were treated with lorlatinib (10 μM) or DMSO for 96 h and then analyzed by fluorescence-activated cell sorting (FACS)-based annexin V-PE staining and analyzed apoptotic rates. For HepG2/C3A cells, p < 0.0001 (DMSO versus lorlatinib for Non-specific (NS) shRNA expressing cells (n = 3 each), t = 23.02, df = 4, p = 0.0117 (lorlatinib/NS shRNA versus lorlatinib/GGN shRNA#1 (n = 3 each)), t = 4.396, df = 4 and p = 0.0178 (lorlatinib/NS shRNA versus lorlatinib/GGN shRNA#2 (n = 3 each)), t = 3.3884, df = 4. For Huh7 cells, p < 0.0001 (DMSO versus lorlatinib for NS shRNA expressing cells (n = 3 each), t = 46.98.02, df = 4, p = 0.0006 (lorlatinib/NS shRNA versus lorlatinib/GGN shRNA#1 (n = 3 each)), t = 9.986, df = 4 and p = 0.0018 (lorlatinib/NS shRNA versus lorlatinib/GGN shRNA#2 (n = 3 each)), t = 7.402, df = 4. p values were calculated using a two-tailed, unpaired Student’s t test. (F) HepG2/C3A or Huh7 cells expressing either empty vector or NRG4 ORF were treated with lorlatinib (10 μM) or DMSO for 96 h and then analyzed by fluorescence-activated cell sorting (FACS)-based annexin V-PE staining and analyzed apoptotic rates. For HepG2/C3A cells, p < 0.0001 (DMSO versus lorlatinib for vector expressing cells (n = 3 each), t = 17.11, df = 4 and p = 0.0082 (lorlatinib/vector versus lorlatinib/NRG4 expressing cells (n = 3 each)), t = 4.870, df = 4. For Huh7 cells, p < 0.0001 (DMSO versus lorlatinib for vector expressing cells (n = 3 each)), t = 28.29, df = 4 and p < 0.0001 (lorlatinib/vector versus lorlatinib/NRG4 expressing cells (n = 3 each), t = 20.95, df = 4. p values were calculated using a two-tailed, unpaired Student’s t test. (G) HepG2/C3A and Huh7 cells expressing either NS- or GGN-specific shRNAs were treated with lorlatinib (10 μM) or DMSO for 96 h and then analyzed by fluorescence-activated cell sorting (FACS)-based cleaved caspase-3 staining. For HepG2/C3A cells, p < 0.0001 (DMSO versus Lorlatinib for NS shRNA expressing cells (n = 3 each), t = 34.99, df = 4, p < 0.0001 (lorlatinib/NS shRNA versus lorlatinib/GGN shRNA#1 (n = 3 each), t = 24.80, df = 4 and p < 0.0001 (lorlatinib/NS shRNA versus lorlatinib/GGN shRNA#2 (n = 3 each), t = 29.88, df = 4. For Huh7 cells, p = 0.007 (DMSO versus lorlatinib for NS shRNA expressing cells (n = 3 each), t = 9.402.02, df = 4, p = 0.0020 (lorlatinib/NS shRNA versus lorlatinib/GGN shRNA#1 (n = 3 each), t = 7.162, df = 4 and p = 0.0042 (lorlatinib/NS shRNA versus lorlatinib/GGN shRNA#2 (n = 3 each), t = 5.870, df = 4. p values were calculated using a two-tailed, unpaired Student’s t test. (H) HepG2/C3A and Huh7 cells expressing either empty vector or NRG4 ORF were treated with lorlatinib (10 μM) or DMSO for 96 h and then analyzed by fluorescence-activated cell sorting (FACS)-based cleaved caspase-3 staining. For HepG2/C3A cells, p < 0.0001 (DMSO versus lorlatinib for vector expressing cells (n = 3 each), t = 55.14, df = 4 and p < 0.0001 (lorlatinib/vector versus lorlatinib/NRG4 expressing cells (n = 3 each), t = 56.39, df = 4. For Huh7 cells, p < 0.0001 (DMSO versus lorlatinib for vector expressing cells (n = 3 each), t = 32.60, df = 4 and p < 0.0001 (lorlatinib/vector versus lorlatinib/NRG4 expressing cells (n = 3 each), t = 35.22, df = 4. p values were calculated using a two-tailed, unpaired Student’s t test. (I) Model (generated using BioRender): Our results demonstrate that ALK inhibition blocks HCC tumor growth and progression by inducing apoptosis and senescence and apoptosis-inducing effect of ALK inhibition is in part mediated through GGN and NRG4. Lorlatinib also enhance the therapeutic benefits of anti-PD-1 antibody and senolytic agents resulting in more potent inhibition of HCC. All quantitative data represent the mean ± SEM. See also, Figures S5–S10.

Similar articles

References

    1. Llovet J.M., Kelley R.K., Villanueva A., Singal A.G., Pikarsky E., Roayaie S., Lencioni R., Koike K., Zucman-Rossi J., Finn R.S. Hepatocellular carcinoma. Nat. Rev. Dis. Prim. 2021;7:6. doi: 10.1038/s41572-020-00240-3. - DOI - PubMed
    1. Yang J.D., Hainaut P., Gores G.J., Amadou A., Plymoth A., Roberts L.R. A global view of hepatocellular carcinoma: trends, risk, prevention and management. Nat. Rev. Gastroenterol. Hepatol. 2019;16:589–604. doi: 10.1038/s41575-019-0186-y. - DOI - PMC - PubMed
    1. Villanueva A. Hepatocellular Carcinoma. N. Engl. J. Med. 2019;380:1450–1462. doi: 10.1056/NEJMra1713263. - DOI - PubMed
    1. Brar G., Kesselman A., Malhotra A., Shah M.A. Redefining Intermediate-Stage HCC Treatment in the Era of Immune Therapies. JCO Oncol. Pract. 2022;18:35–41. doi: 10.1200/OP.21.00227. - DOI - PubMed
    1. Bartz C., Maloney J.P. Burnout among intensive care nurses. Res. Nurs. Health. 1986;9:147–153. doi: 10.1002/nur.4770090210. - DOI - PubMed