. 2024 Apr 24;27(5):109808.
doi: 10.1016/j.isci.2024.109808. eCollection 2024 May 17.

Mitochondrial F0F1-ATP synthase governs the induction of mitochondrial fission

Affiliations

Mitochondrial F0F1-ATP synthase governs the induction of mitochondrial fission

Charlène Lhuissier et al. iScience. .

Abstract

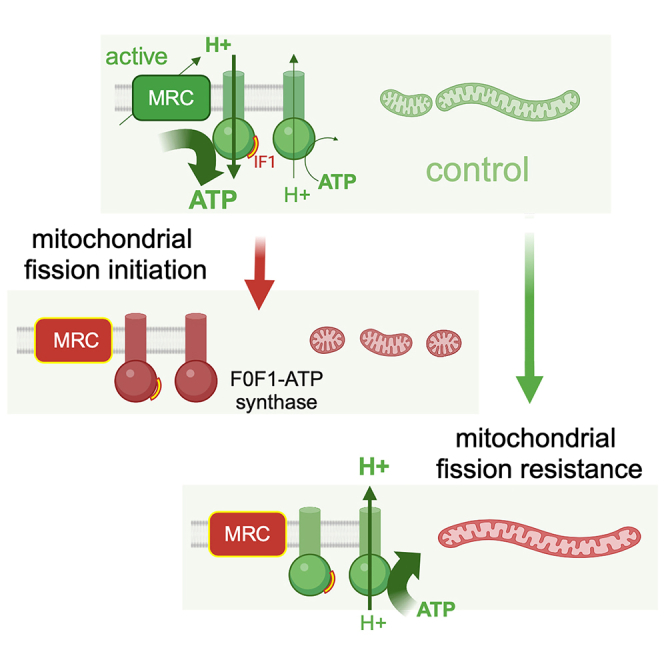
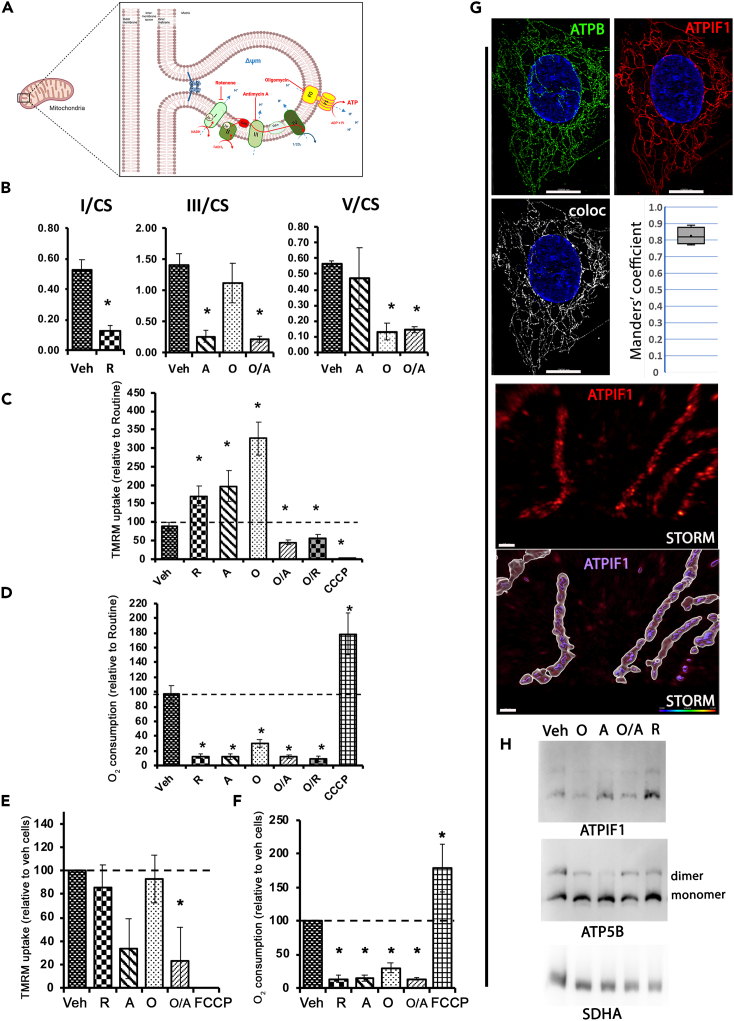
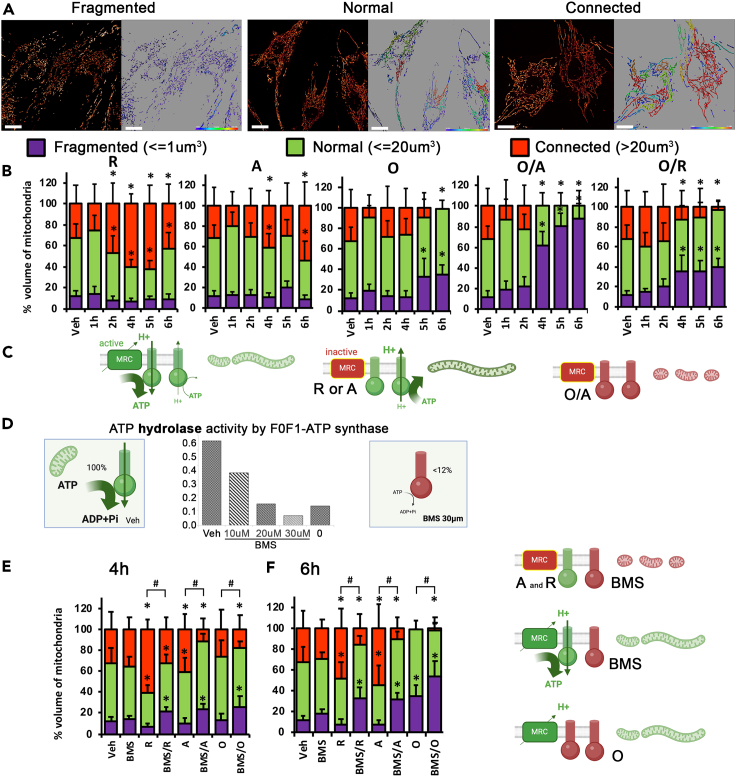
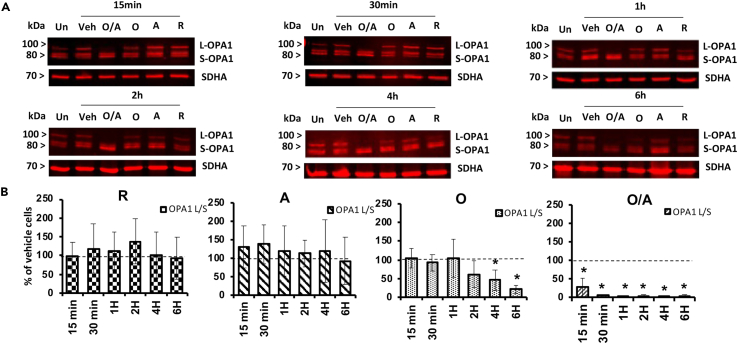
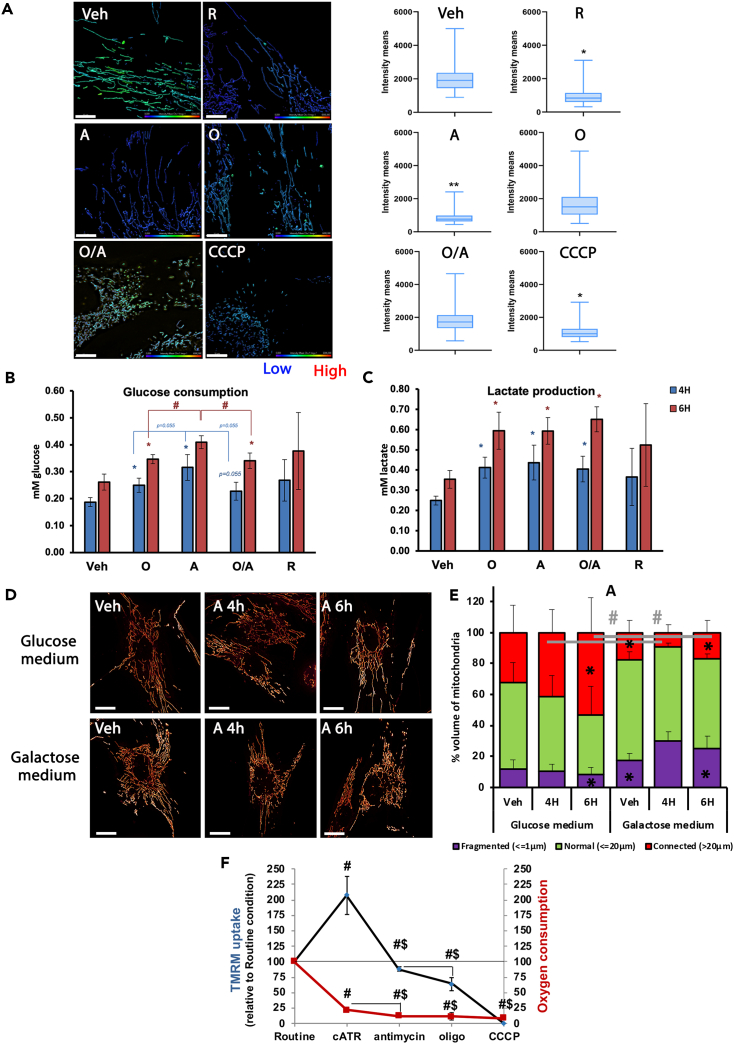
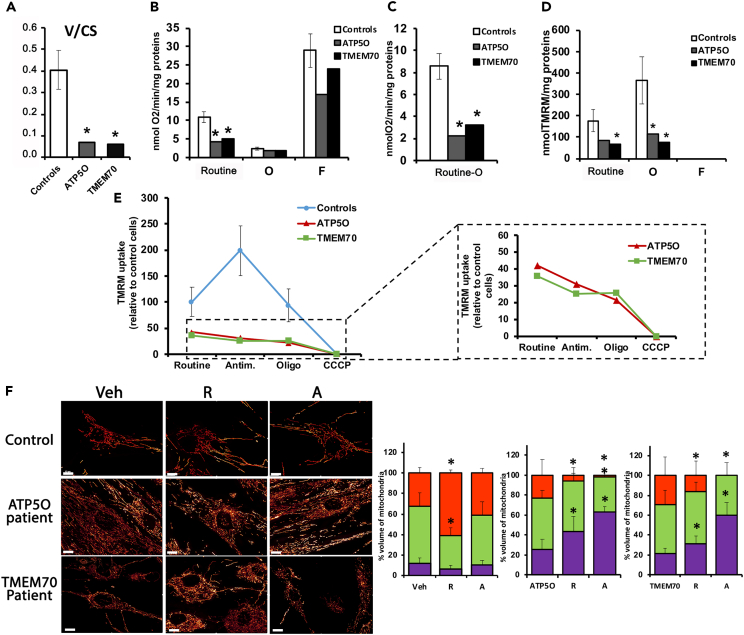
Mitochondrial dynamics is a process that balances fusion and fission events, the latter providing a mechanism for segregating dysfunctional mitochondria. Fission is controlled by the mitochondrial membrane potential (ΔΨm), optic atrophy 1 (OPA1) cleavage, and DRP1 recruitment. It is thought that this process is closely linked to the activity of the mitochondrial respiratory chain (MRC). However, we report here that MRC inhibition does not decrease ΔΨm nor increase fission, as evidenced by hyperconnected mitochondria. Conversely, blocking F0F1-ATP synthase activity induces fragmentation. We show that the F0F1-ATP synthase is sensing the inhibition of MRC activity by immediately promoting its reverse mode of action to hydrolyze matrix ATP and restoring ΔΨm, thus preventing fission. While this reverse mode is expected to be inhibited by the ATPase inhibitor ATPIF1, we show that this sensing is independent of this factor. We have unraveled an unexpected role of F0F1-ATP synthase in controlling the induction of fission by sensing and maintaining ΔΨm.

Keywords: Biochemistry; Cell biology; Functional aspects of cell biology.


Conflict of interest statement

The authors declare no competing interests.

Figures

None
Graphical abstract
Figure 1
Figure 1
ATP hydrolysis by F0F1-ATP synthase maintains the mitochondrial membrane potential following mitochondrial respiratory chain inhibition (A) OXPHOS complexes within mitochondrial cristae. CI, CIII, and F0F1-ATP synthase are specifically inhibited by rotenone, R, antimycin, A, and oligomycin, O, respectively. (B) Enzymatic activity of OXPHOS complexes following drug application. Control fibroblasts were treated in culture conditions during 1 h, either with vehicle (Ethanol, 1/2000), R (2.5 μM), A (2 μg/mL), O (4 μg/mL), and O combined to A. CI, CIII, and ATP synthase activities were normalized to citrate synthase (CS). n = 4 different control cell lines, each measured in duplicates. Results are presented as means ± SEM. ∗indicates significant difference from vehicle conditions. (C and D) Combined measurement of mitochondrial membrane potential and O2 consumption in intact cells. Monitoring of TMRM fluorescence (C) coupled to oxygraphy (D) after a 30 min inhibition with either vehicle (Ethanol, 1/2000), R (2.5 μM), A (2 μg/mL), O (4 μg/mL), O combine to R and O combined to A. The CCCP (10 μM) uncoupler was used as positive controls for mitochondrial depolarization, n = 4–6 different control cells, each in duplicate. Results are expressed relative to cellular routine respiration (C) or TMRM uptake (D), i.e., delta fluorescence (see Figure S3 for detailed analysis) and presented as means ± SEM. ∗indicates significant difference (p < 0.05) from vehicle conditions, Mann-Whitney U test. Measurement of mitochondrial membrane potential (E) and O2 consumption on permeabilized cells (F). TMRM uptake was measured on cells treated for 30 min with the different inhibitors, n = 4, each in duplicate. The FCCP (10 μM) uncoupler was used as positive controls for mitochondrial depolarization. Results are presented as means ± SEM. ∗p < 0.05, Mann-Whitney U test. (G and H) ATPIF1 interacts with F0F1-ATP synthase and shows normal distribution within the mitochondria from human skin fibroblasts. The mitochondrial network was revealed by immunostaining of anti-ATPIF1 antibodies (Red) and anti-ATP5B (Green). The colocalization channels are shown in white produced by the IMARIS software colocalization tool with corresponding Manders colocalization coefficient. Super-resolution STORM imaging of ATPIF1 and the corresponding representation with the intramitochondrial localization of ATPIF1 in violet, using Imaris Iso-surface rendering. Blue native PAGE followed by western-blot analysis (H). Membranes were sequentially hybridized with monoclonal antibodies targeting ATPIF1 and ATP synthase subunit ATP5B, and SDHA as a control loading.
Figure 2
Figure 2
The hydrolase activity of F0F1-ATP synthase compensates for the dysfunction of respiratory chain and prevents mitochondrial fission (A) Mitochondrial network observed with MitoTracker Green by fluorescence microscopy. Left panel: representative images showing the different morphologies of the mitochondrial network. Right panel: Colorimetric representation of the mitochondrial network according to mitochondrial volume Imaris iso-surface rendering. (B) Quantification of mitochondrial volume following OXPHOS inhibition. 3D images analyses were performed using Imaris software (Bitplane). The iso-surface module quantifies the volume of mitochondria in μm3. Corresponding percentage of mitochondrial volume of ≤1 μm3 (fragmented, in violet), ≤20 μm3 (Normal, in green) and >20 μm3 (connected, in red). n = 3, analyses were performed on 12 images on three independent biological replicates. Results are presented as means ± SEM. ∗ indicates significant difference from control conditions (Vehicle, Veh). (C) Diagram summary under normal conditions reveal that F0F1-ATP synthase and hydrolase activities work simultaneously in mitochondria with a high proportion of forward action. Schematic representations of the changes in the activity of the complexes and shape of mitochondria following the presence of inhibitors. (D) BMS inhibition of F0F1-ATPase on human fibroblasts. Panels: schematic representation of ATP hydrolase activity following drug application. Activity of mitochondrial F0F1-ATPase (V) normalized to citrate synthase (CS). Fibroblasts were treated in culture conditions 4 h with oligomycin or different concentrations of BMS in order to define the effective BMS concentration that inhibits F0F1-ATPase activity. n = 2, each in duplicate. (E and F) Mitochondrial network following BMS treatments observed using MitoTracker Green by fluorescence microscopy in human control cells, treated for 4 h (E) or 6 h (F) with BMS (30 μM), BMS + R, BMS + A, or BMS + O or Veh. n = 5, analyses were performed on 12 images on four independent biological replicates. Results are presented as means ± SEM.∗p < 0.05, Mann-Whitney U test. Schematic representations of the changes in the activity of the complexes and shape of mitochondria following the presence of inhibitors with BMS or O.
Figure 3
Figure 3
Effect of OXPHOS inhibition on OPA1 protein cleavage (A) OPA1 isoforms’ expression profile: Representative images of Western-blots of OPA1 long (L) and short (S) isoforms and SDHA (mitochondrial loading reference) performed on protein extracts from treated cells. (B) Quantification of the OPA1 L/S ratio relatively to the vehicle. n = 5, in five independent biological replicates. Results are presented as means ± SEM. ∗ Indicates significant difference from control conditions (Veh).
Figure 4
Figure 4
Glycolytic metabolism supports the resistance to fission in response to respiratory chain dysfunction (A) Measurement of mitochondrial ATP using the ATP Red probe by fluorescence microscopy in control fibroblasts after 4 h inhibition of MRC (antimycin, A or rotenone, R), F0F1-ATP synthase inhibition (oligomycin, O) or both (oligomycin/antimycin, O/A) or uncoupler CCCP. n = 3, in duplicates. (B and C) Measurement of the cellular glycolytic metabolism. Cellular glucose consumption and lactate production were measured in vehicle-treated cells, or after MRC inhibition (antimycin, A or rotenone, R), F0F1-ATP synthase inhibition (oligomycin, O) or both (oligomycin/antimycin, O/A). Results are presented in mM glucose per 4 h and mM Lactate per 4 h in blue, in mM glucose per 6 h and mM lactate per 6 h in red. n = 4, in duplicates. Results are presented as means ± SEM.∗ Indicates significant difference from vehicle conditions, # indicates significant difference among inhibitors, using the Mann-Whitney U test. (D) Mitochondrial network observed using MitoTracker Green by fluorescence microscopy in control fibroblasts treated 4 h and 6 h with Antimycin (2 μg/ml) in DMEM F12 medium or in galactose medium. (E) Quantification of mitochondrial volume following CIII inhibition in galactose medium. The percentage of mitochondria length represents the percentage of ≤1 μm (fragmented, violet), ≤20 μm (normal, green) and >20 μm (connected, red) mitochondria, n = 3, in three replicate. Results are presented as means ± SEM.∗ indicates significant difference from vehicle conditions, # indicates significant difference among media, using the Mann-Whitney U test. (F) Modulation of the mitochondrial membrane potential and respiration rates over time in intact cells after adenine nucleotide transporter (ANT) inhibition. TMRM uptake (black trace) as well as the corresponding routine respiration rate (O2 flux, red trace) were first recorded for 2–3 min in routine condition using Oroboros technology. ANT was then inhibited using 30 μM carboxyatractyloside (cATR), followed by antimycin injection. TMRM uptake and respiration rate were recorded again after each inhibitor addition. CCCP was used to fully depolarize mitochondria. Results are presented as means ± SEM (n = 3). # indicates significant difference from routine conditions, $ indicates significant difference between inhibitors, using the Wilcoxon test for paired data.
Figure 5
Figure 5
Genetic deficiency of the F0F1-ATP synthase sensitizes cells to mitochondrial fission (A) Activity of F1-ATPase (V), normalized to citrate synthase (CS), measured in controls and in mutant cell lines. (B–D) Combined measurement of mitochondrial membrane potential and O2 consumption on intact control and patient cells. (B) Measurement of respiration rates using Oroboros technology. Routine respiration measured on intact cells in culture medium and corresponding to oxidative metabolism. Non-phosphorylating respiration rate (O), measured after inhibition of ATP synthesis through addition of oligomycin (4 μg/mL). Maximal oxidation capacity (F), determined after progressive uncoupling through FCCP titration (for detailed analysis and injection sequence, see Figure S6). (C) Phosphorylating respiration rate, Routine-O: routine minus oligomycin respirations, i.e., respiration dedicated to ATP synthesis. (D) Mitochondrial membrane potential in intact patient cells. TMRM uptake was measured on control and patient intact cells in routine condition and in non-phosphorylating condition after F0F1-ATP synthase inhibition by oligomycin (O) in the same sample as in (B). Oxygen consumption rates and TMRM uptake were normalized to cellular protein concentration. Control cells: n = 6, Results are presented as means ± S.D. ATP5O and TMEM70-mutated cells: 3 independents replicates (inter-assay C.V. for ATP5O: Routine, 7.4 and 10.6%; Oligo, 6.5 and 20.8%, FCCP: 9.9 and 0% for respiration rates and TMRM measurements, respectively. TMEM70: Routine, 14.4 and 29.1%; Oligo, 27.1 and 17.8%, FCCP: 21.0 and 0% for respiration rates and TMRM measurements, respectively). ∗ Indicates significant difference from control conditions (value beyond 2 S.D. from controls). (E) Modulation of the mitochondrial membrane potential in controls and F0F1-deficient cells. TMRM fluorescence was first measured in routine condition, then 30 min after injecting antimycin (A: 2 μg/ml), and then after adding oligomycin (O: 4 μg/ml; ATP synthase inhibitor). CCCP was used as a control to fully depolarize mitochondria. Control cells: n = 5, ATP5O and TMEM70-mutated cells: 3 independents replicates. Results are presented as mean ± SD. The selection of patient curves allows a change of scale (Right panel). (F) Mitochondrial network observed with MitoTracker Green by fluorescence microscopy. Left panel: representative images of the different morphologies of the mitochondrial network observed following MRC inhibition in patient fibroblast cells. Controls and ATP5O and TMEM70 patient fibroblasts were treated 4 h with rotenone (R: 2.5 μM) or with Antimycin (A: 2 μg/mL). Right panel: corresponding quantification, the percentage of mitochondria volume represents the percentage of ≤1 μm (fragmented, violet), ≤20 μm (normal, green) and >20 μm (connected, red) mitochondria. Controls, n = 3, patient cells: analyses were performed on 12 images on triplicates. Results are presented as mean from each patient relative to control cells. ∗ Indicates significant difference from Ctrl (value beyond 2 S.D. from controls).

Similar articles

Cited by

References

    1. Archer S.L. Mitochondrial dynamics--mitochondrial fission and fusion in human diseases. N. Engl. J. Med. 2013;369:2236–2251. doi: 10.1056/NEJMra1215233. - DOI - PubMed
    1. Gao S., Hu J. Mitochondrial Fusion: The Machineries In and Out. Trends Cell Biol. 2021;31:62–74. doi: 10.1016/j.tcb.2020.09.008. - DOI - PubMed
    1. Smirnova E., Griparic L., Shurland D.L., van der Bliek A.M. Dynamin-related protein Drp1 is required for mitochondrial division in mammalian cells. Mol. Biol. Cell. 2001;12:2245–2256. doi: 10.1091/mbc.12.8.2245. - DOI - PMC - PubMed
    1. Rojo M., Legros F., Chateau D., Lombès A. Membrane topology and mitochondrial targeting of mitofusins, ubiquitous mammalian homologs of the transmembrane GTPase Fzo. J. Cell Sci. 2002;115:1663–1674. - PubMed
    1. Delettre C., Lenaers G., Griffoin J.M., Gigarel N., Lorenzo C., Belenguer P., Pelloquin L., Grosgeorge J., Turc-Carel C., Perret E., et al. Nuclear gene OPA1, encoding a mitochondrial dynamin-related protein, is mutated in dominant optic atrophy. Nat. Genet. 2000;26:207–210. doi: 10.1038/79936. - DOI - PubMed

LinkOut - more resources