

Comprehensive analysis of human monocyte subsets using full-spectrum flow cytometry and hierarchical marker clustering
- PMID: 38742110
- PMCID: PMC11089106
- DOI: 10.3389/fimmu.2024.1405249
Comprehensive analysis of human monocyte subsets using full-spectrum flow cytometry and hierarchical marker clustering
Abstract
Introduction: Exploring monocytes' roles within the tumor microenvironment is crucial for crafting targeted cancer treatments.
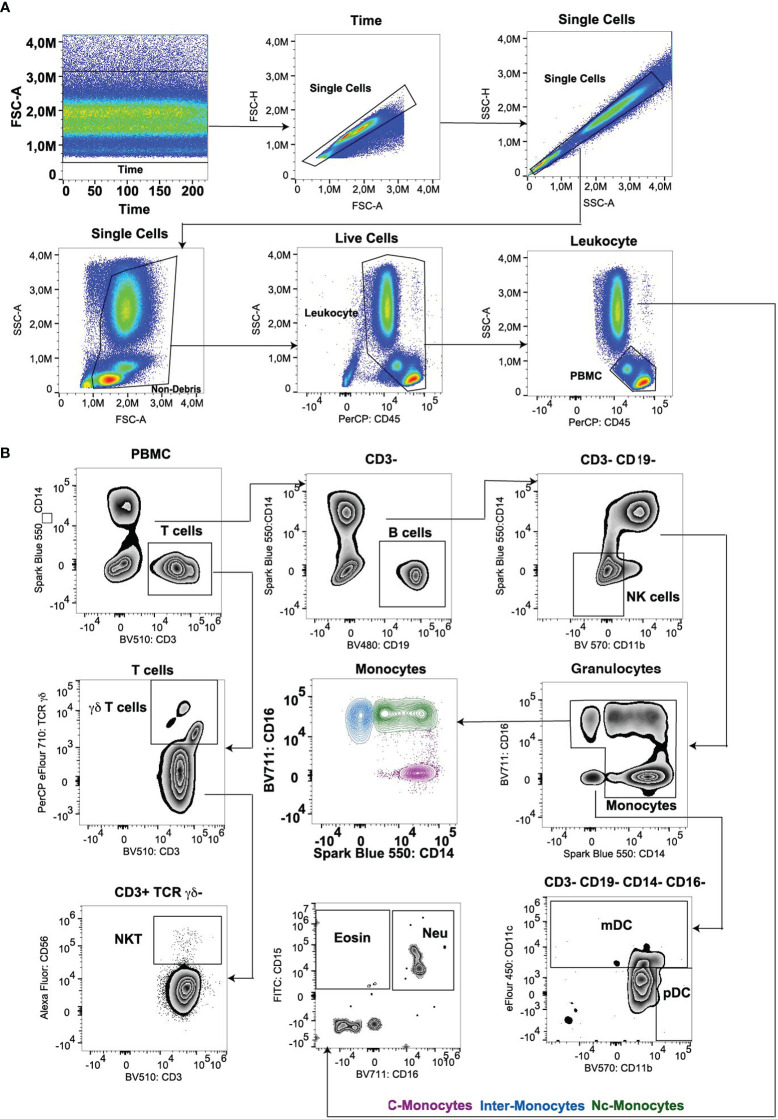
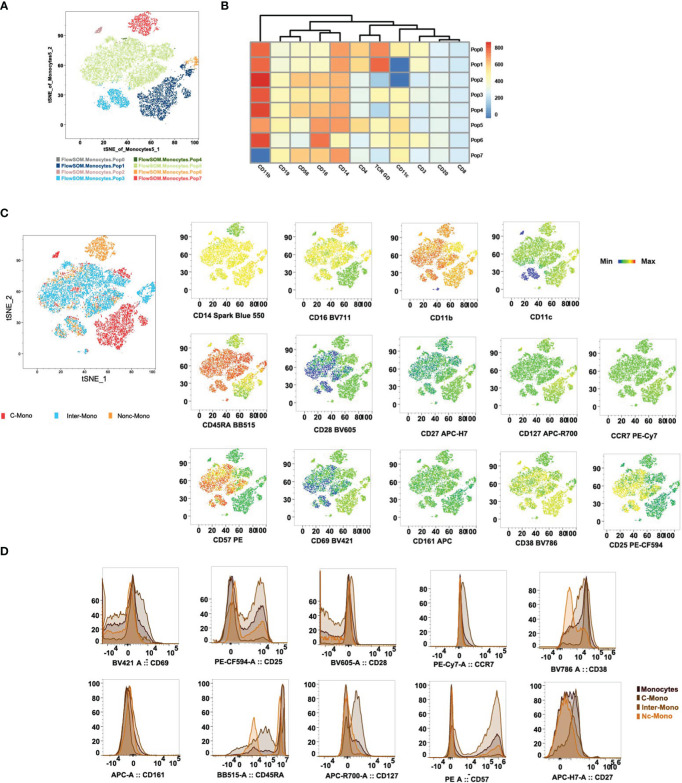
Methods: This study unveils a novel methodology utilizing four 20-color flow cytometry panels for comprehensive peripheral immune system phenotyping, specifically targeting classical, intermediate, and non-classical monocyte subsets.
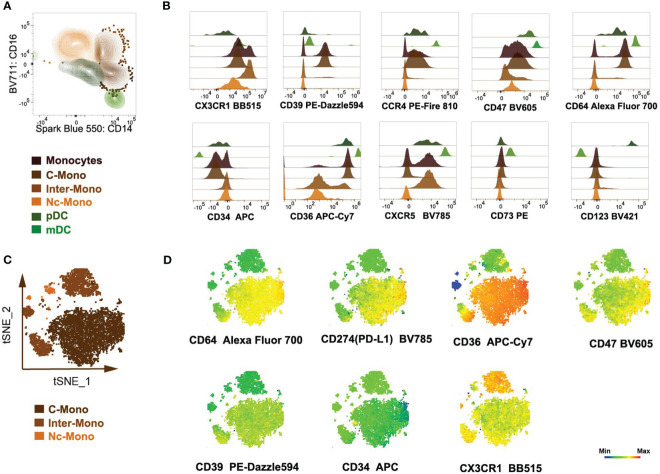
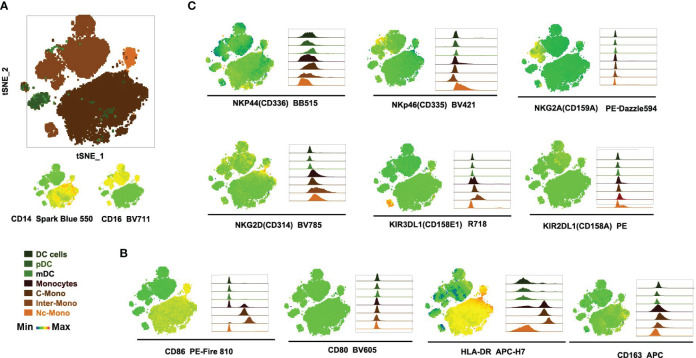
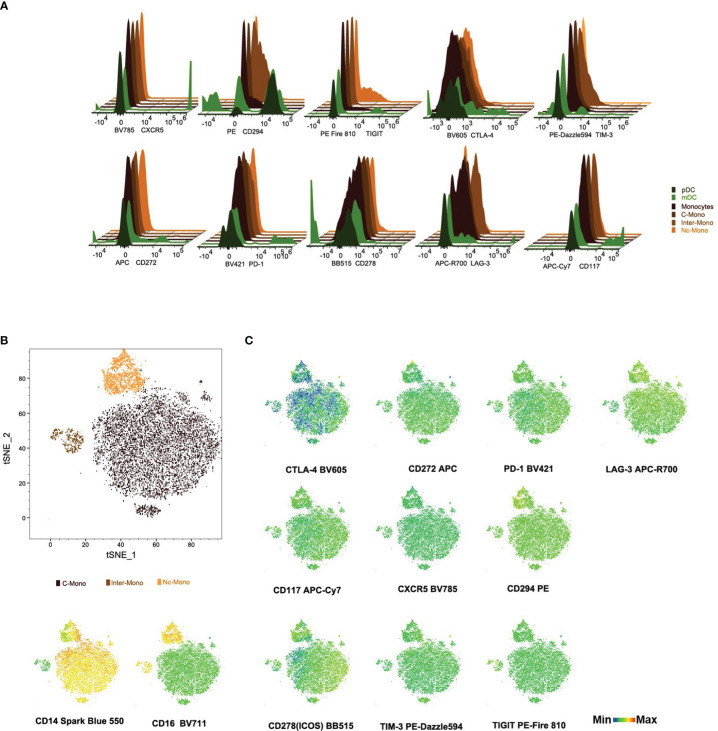
Results: By applying advanced dimensionality reduction techniques like t-distributed stochastic neighbor embedding (tSNE) and FlowSom analysis, we performed an extensive profiling of monocytes, assessing 50 unique cell surface markers related to a wide range of immunological functions, including activation, differentiation, and immune checkpoint regulation.
Discussion: This in-depth approach significantly refines the identification of monocyte subsets, directly supporting the development of personalized immunotherapies and enhancing diagnostic precision. Our pioneering panel for monocyte phenotyping marks a substantial leap in understanding monocyte biology, with profound implications for the accuracy of disease diagnostics and the success of checkpoint-inhibitor therapies. Key findings include revealing distinct marker expression patterns linked to tumor progression and providing new avenues for targeted therapeutic interventions.
Keywords: immune checkpoints; immunophenotyping; mesenchymal stromal cells (MSCs); monocytes; spectral flow cytometry; t-distributed stochastic neighbor embedding (tSNE) analysis; tumor microenvironment (TME).
Copyright © 2024 Li, Xiao, Geng, Wang, Zeng, Lai, Gong and Chen.
Conflict of interest statement
The authors declare that the research was conducted in the absence of any commercial or financial relationships that could be construed as a potential conflict of interest.
Figures
Similar articles
-
Human Blood Monocyte Subsets: A New Gating Strategy Defined Using Cell Surface Markers Identified by Mass Cytometry.Arterioscler Thromb Vasc Biol. 2017 Aug;37(8):1548-1558. doi: 10.1161/ATVBAHA.117.309145. Epub 2017 Jun 8. Arterioscler Thromb Vasc Biol. 2017. PMID: 28596372 Free PMC article.
-
Diving Deep: Profiling Exhausted T Cells in the Tumor Microenvironment Using Spectral Flow Cytometry.Cytometry A. 2025 Apr;107(4):271-280. doi: 10.1002/cyto.a.24929. Epub 2025 Apr 3. Cytometry A. 2025. PMID: 40178141
-
Heterogeneity of human monocytes: an optimized four-color flow cytometry protocol for analysis of monocyte subsets.J Cardiovasc Transl Res. 2011 Apr;4(2):211-9. doi: 10.1007/s12265-011-9256-4. Epub 2011 Feb 10. J Cardiovasc Transl Res. 2011. PMID: 21308491
-
Monocyte heterogeneity and functions in cancer.J Leukoc Biol. 2019 Aug;106(2):309-322. doi: 10.1002/JLB.4RI0818-311R. Epub 2019 Feb 18. J Leukoc Biol. 2019. PMID: 30776148 Free PMC article. Review.
-
Comprehensive phenotyping of peripheral blood monocytes in healthy bovine.Cytometry A. 2022 Feb;101(2):122-130. doi: 10.1002/cyto.a.24492. Epub 2021 Aug 12. Cytometry A. 2022. PMID: 34382742 Review.
Cited by
-
Monocyte Involvement in the Pathogenesis of Myeloproliferative Neoplasms.Int J Mol Sci. 2025 Jul 3;26(13):6422. doi: 10.3390/ijms26136422. Int J Mol Sci. 2025. PMID: 40650198 Free PMC article. Review.
-
Mass Cytometry Analysis of High-Dimensional Single-Cell Immune Profiles in ZF2001-Vaccinated Patients Infected with SARS-CoV-2.Infect Drug Resist. 2025 May 14;18:2497-2509. doi: 10.2147/IDR.S511936. eCollection 2025. Infect Drug Resist. 2025. PMID: 40384795 Free PMC article.
References
-
- Thomas GD, Hamers AAJ, Nakao C, Marcovecchio P, Taylor AM, McSkimming C, et al. . Human blood monocyte subsets: A new gating strategy defined using cell surface markers identified by mass cytometry. Arterioscler Thromb Vasc Biol. (2017) 37:1548–58. doi: 10.1161/ATVBAHA.117.309145 - DOI - PMC - PubMed
MeSH terms
LinkOut - more resources
Full Text Sources