Review
. 2024 Jun 17;53(12):6345-6398.
doi: 10.1039/d3cs00124e.

Fluorescent small molecule donors

Affiliations
Review

Fluorescent small molecule donors

Guang Chen et al. Chem Soc Rev. .

Abstract

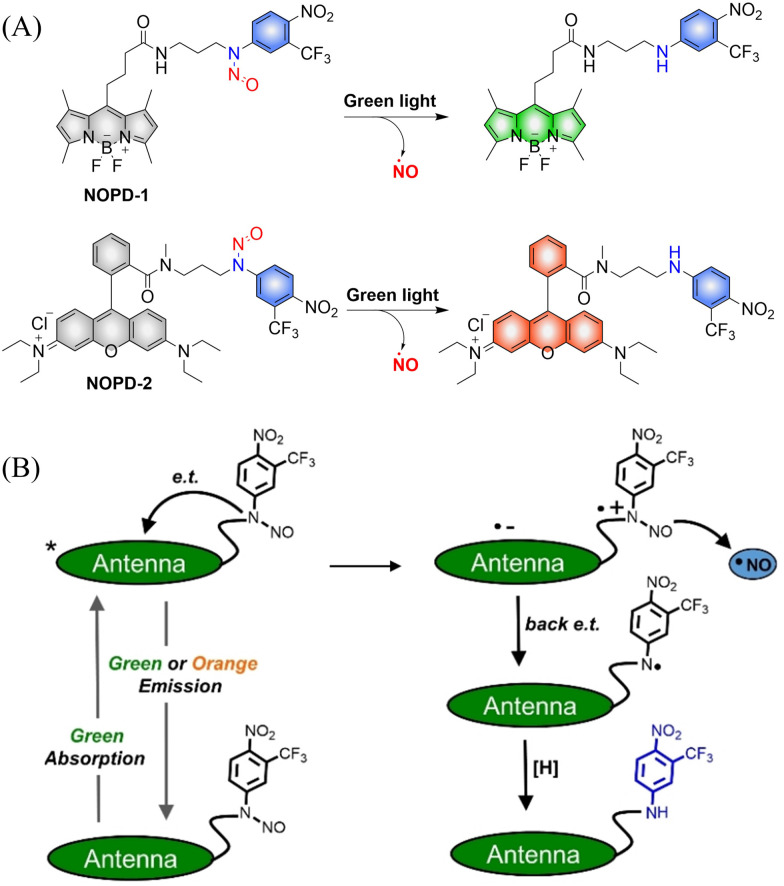
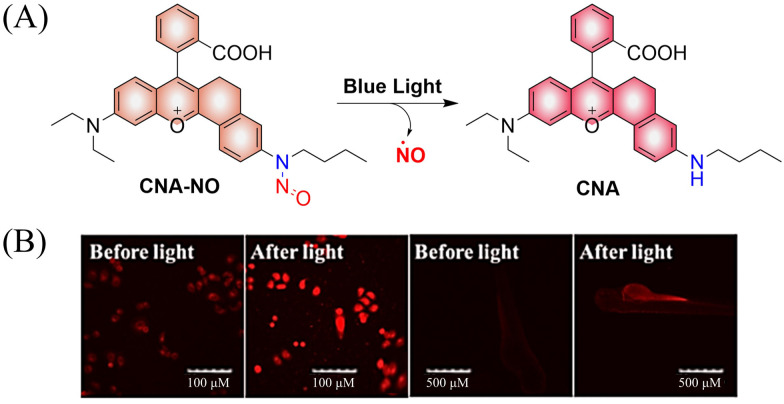
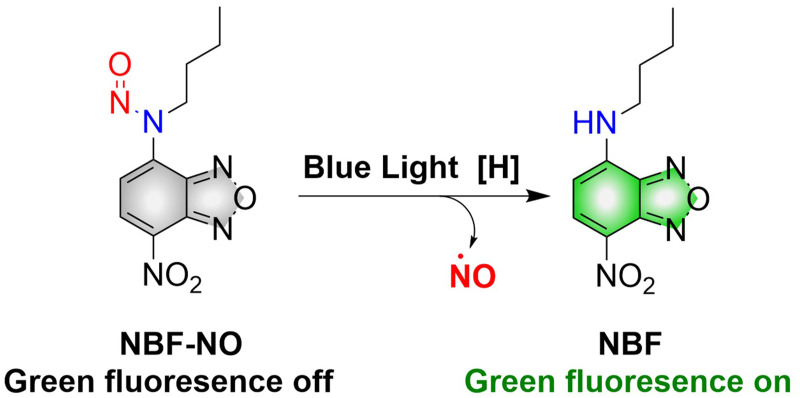
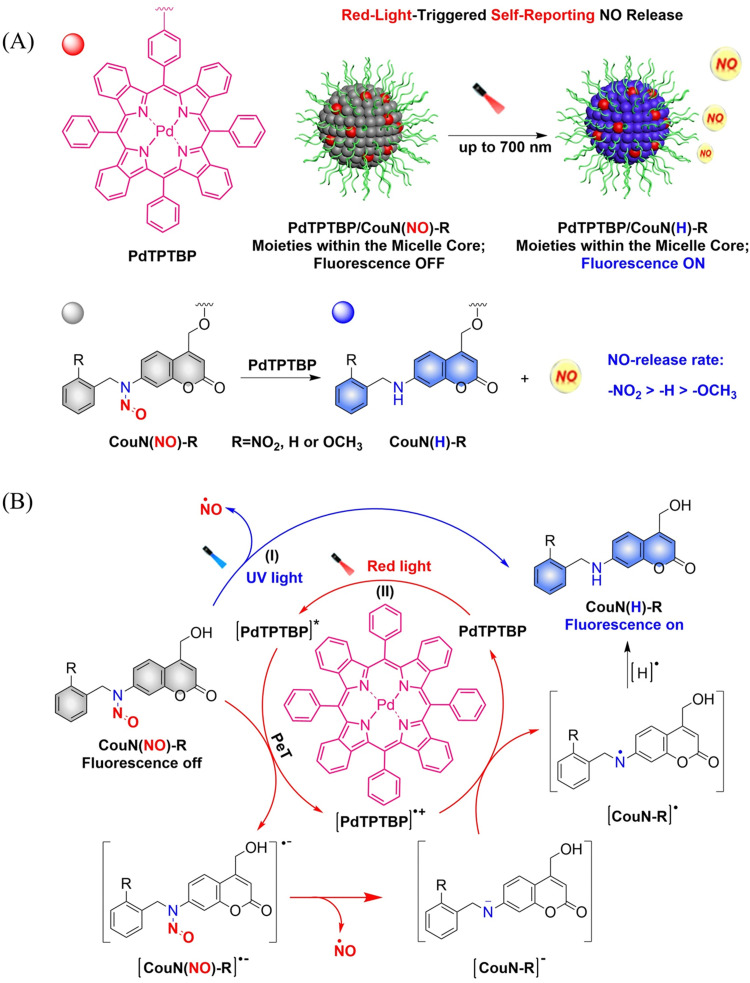
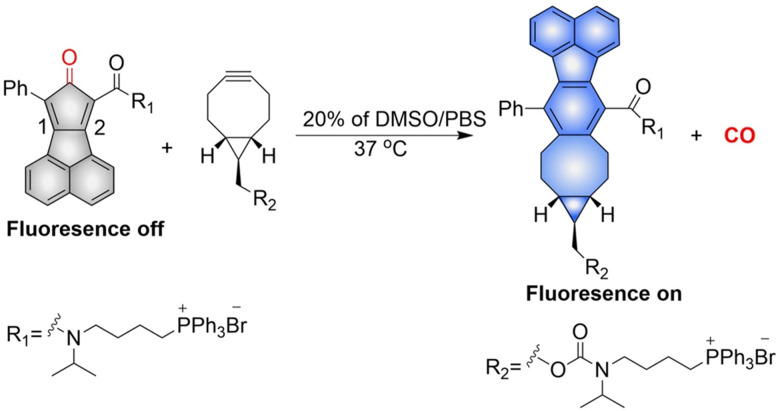
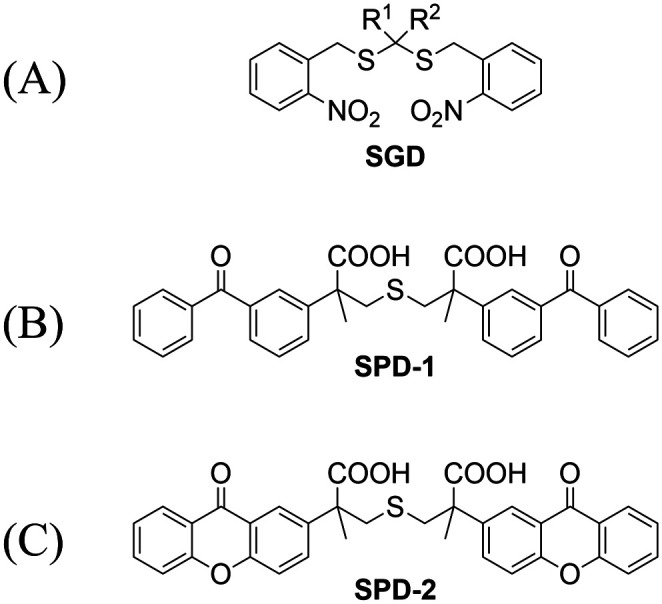
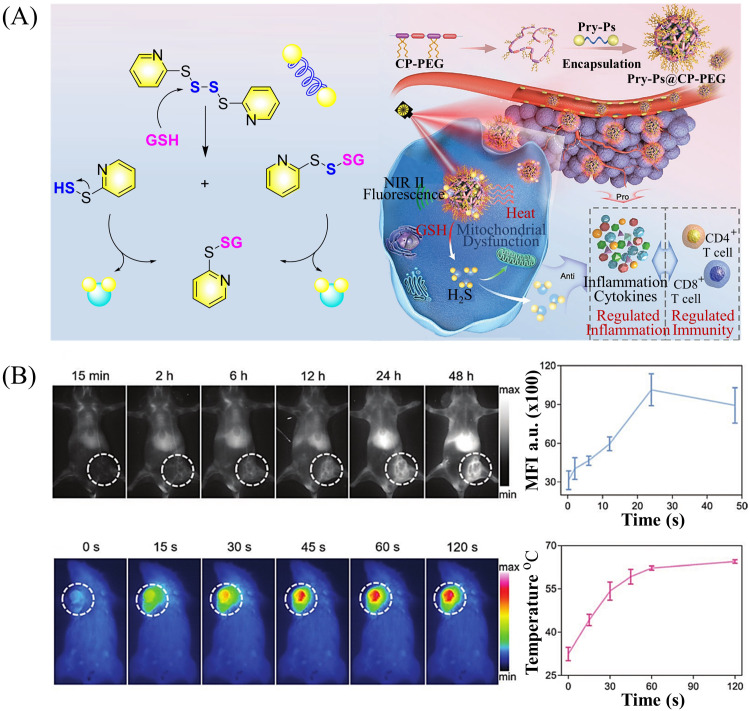
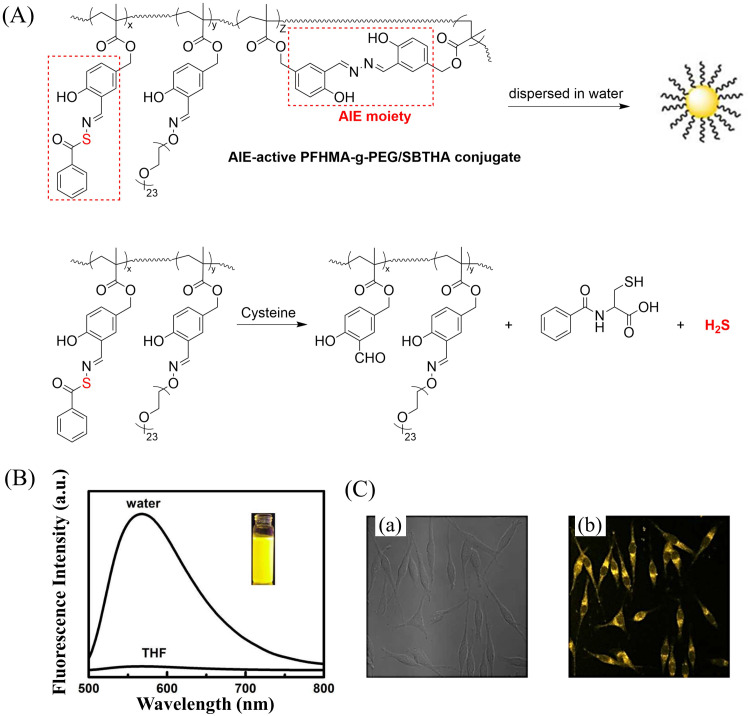
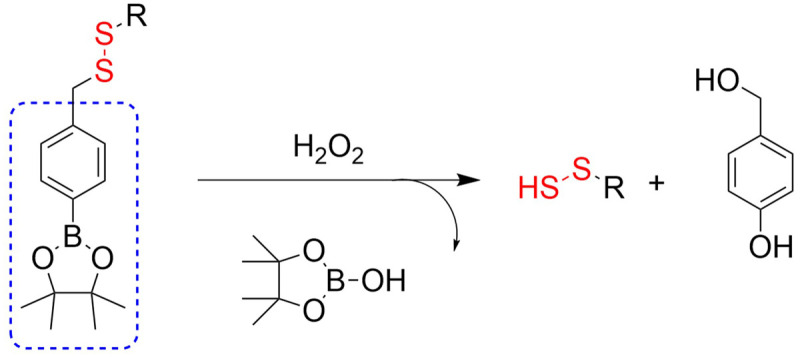
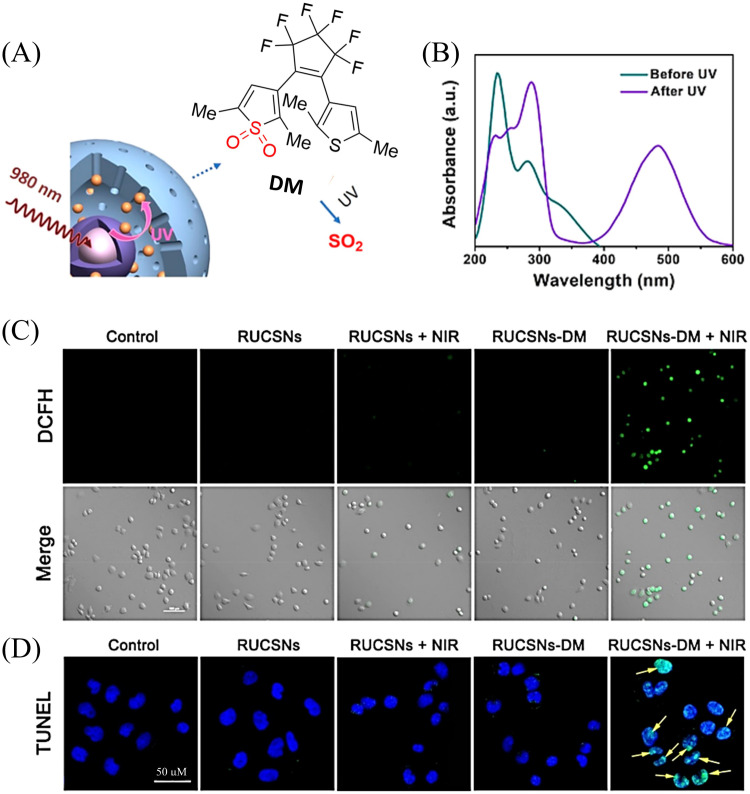
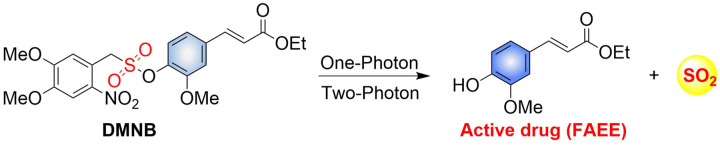
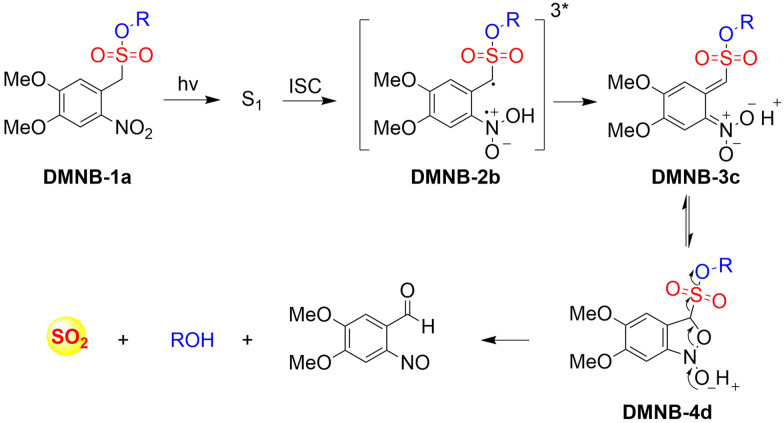
Small molecule donors (SMDs) play subtle roles in the signaling mechanism and disease treatments. While many excellent SMDs have been developed, dosage control, targeted delivery, spatiotemporal feedback, as well as the efficiency evaluation of small molecules are still key challenges. Accordingly, fluorescent small molecule donors (FSMDs) have emerged to meet these challenges. FSMDs enable controllable release and non-invasive real-time monitoring, providing significant advantages for drug development and clinical diagnosis. Integration of FSMDs with chemotherapeutic, photodynamic or photothermal properties can take full advantage of each mode to enhance therapeutic efficacy. Given the remarkable properties and the thriving development of FSMDs, we believe a review is needed to summarize the design, triggering strategies and tracking mechanisms of FSMDs. With this review, we compiled FSMDs for most small molecules (nitric oxide, carbon monoxide, hydrogen sulfide, sulfur dioxide, reactive oxygen species and formaldehyde), and discuss recent progress concerning their molecular design, structural classification, mechanisms of generation, triggered release, structure-activity relationships, and the fluorescence response mechanism. Firstly, from the large number of fluorescent small molecular donors available, we have organized the common structures for producing different types of small molecules, providing a general strategy for the development of FSMDs. Secondly, we have classified FSMDs in terms of the respective donor types and fluorophore structures. Thirdly, we discuss the mechanisms and factors associated with the controlled release of small molecules and the regulation of the fluorescence responses, from which universal guidelines for optical properties and structure rearrangement were established, mainly involving light-controlled, enzyme-activated, reactive oxygen species-triggered, biothiol-triggered, single-electron reduction, click chemistry, and other triggering mechanisms. Fourthly, representative applications of FSMDs for trackable release, and evaluation monitoring, as well as for visible in vivo treatment are outlined, to illustrate the potential of FSMDs in drug screening and precision medicine. Finally, we discuss the opportunities and remaining challenges for the development of FSMDs for practical and clinical applications, which we anticipate will stimulate the attention of researchers in the diverse fields of chemistry, pharmacology, chemical biology and clinical chemistry. With this review, we hope to impart new understanding thereby enabling the rapid development of the next generation of FSMDs.


Conflict of interest statement

There are no conflicts to declare.

Figures

Fig. 1
Fig. 1. Resonance structure of N-nitrosamines.
Fig. 2
Fig. 2. Light-controlled/one-electron reduction triggers the NO-release mechanism of N-nitroso push–pull dyes and their fluorescence changes (R = fluorophore X = alkyl, aryl, etc.).
Fig. 3
Fig. 3. (A) The structure of NOD545a–g, the mechanism of NO release and the fluorescence changes. (B) RAW 264.7 cells incubated with NOD545f for two-photon fluorescence imaging. (C) HeLa cells incubated with different concentrations of 3f to investigate the relationship between fluorescence intensity and cell culture concentration. Parts (B) and (C) are reproduced from ref. with the permission of the American Chemical Society, copyright 2016.
Fig. 4
Fig. 4. (A) The structure of NOD550, the mechanism of NO release and its fluorescence changes. (B) NOD550 and Mitotracker Deep Red were used for two-color localization imaging. (C) Super resolution monitoring of mitochondrial dynamics. Parts (B) and (C) are reproduced from ref. with the permission of the American Chemical Society, copyright 2018.
Fig. 5
Fig. 5. (A) The structure of NOD560, the mechanism of NO release and its fluorescence changes. (B) Migration of MSCs in wound models. (C) Average migration speed of MSCs under different conditions. Reproduced from ref. with the permission of Elsevier Inc., copyright 2018.
Fig. 6
Fig. 6. (A) The structure of NOD565, the mechanism of NO release and its fluorescence changes. (B) NOD565 inhibits fungal growth. Reproduced from ref. with the permission of the American Chemical Society, copyright 2018.
Fig. 7
Fig. 7. The structure of NOD575, the mechanism of NO release and its fluorescence changes.
Fig. 8
Fig. 8. (A) Formation of PEG-NORM nanoparticles. (B) Proposed photodissociation mechanism of PEG-NORM. (C) Effect of PEG-NORM on longevity of C. elegans. Reproduced from ref. with the permission of the Royal Society of Chemistry, copyright 2020.
Fig. 9
Fig. 9. (A) The structure of CNNO, the mechanism of NO release and its fluorescence changes. (B) Two-photon fluorescence imaging of NO release by CNNO in HeLa cells. Cells were treated with 10 μM CNNO. (a) The dish was imaged without light irradiation. (b) The dish was irradiated inside the selected circle using a two-photon laser at 800 nm (20 mW) for 2 min before being imaged. Reproduced from ref. with the permission of the Royal Society of Chemistry, copyright 2017.
Fig. 10
Fig. 10. (A) The structure of photoNODs, the mechanism of NO release and its PA (photoacoustic) changes. (B) (a) Schematic illustration of photoNOD-1 administration, NO treatment, and PA monitoring. (b) Photograph of mouse imaged by a PA tomographer. Dashed line indicates region of PA imaging. (c) PA images (λPAred) acquired before/after a 5 min period with/without irradiation (λPAblue) 4 h following systemic administration of photoNOD-1 (1.2 mg kg−1, 150 μL, 20% DMSO in sterile saline). (d) and (e) Measured tumor volume under different treatment conditions. Reproduced from ref. with the permission of the American Chemical Society, copyright 2018.
Fig. 11
Fig. 11. The structure of Mo-Nap-NO, the mechanism of NO release and its fluorescence changes.
Fig. 12
Fig. 12. (A) and (B) The structure of NOBL-1, the mechanism of NO release and its fluorescence changes. (C) DAR-4M AM (a fluorogenic NO probe) monitored fluorescence imaging of NO released by NOBL-1 in HEK293 cells. (D) Blue-light activated NOBL-1 to release NO induced vasodilation changes in rats. Parts (C) and (D) are reproduced from ref. with the permission of the American Chemical Society, copyright 2014.
Fig. 13
Fig. 13. (A) The structure of NO-Rosa, the mechanism of NO release and its fluorescence changes. (B) DAR-4M AM (a fluorogenic NO probe) monitored fluorescence imaging of NO released by NO-Rosa in HEK293 cells. (C) NO-Rosa activated by yellowish-green-light to release NO and induce vasodilation changes in rats. Parts (B) and (C) are reproduced from ref. with the permission of the Royal Society of Chemistry, copyright 2017.
Fig. 14
Fig. 14. (A) The structure of NOPDs, and fluorescence changes. (B) Proposed photodissociation mechanism of NOPD-1/2. Reproduced from ref. with the permission of Wiley-VCH Verlag GmbH & Co. KGaA, Weinheim, copyright 2019.
Fig. 15
Fig. 15. (A) The structure of CNA-NO, the mechanism of NO release and its fluorescence changes. (B) Comparison of fluorescence imaging of CNA-NO in living cells and zebrafish before and after illumination. Reproduced from ref. with the permission of Elsevier B.V., copyright 2021.
Fig. 16
Fig. 16. The structure of NBF-NO, the mechanism of NO release and fluorescence changes.
Fig. 17
Fig. 17. (A) Illustration of red-light-triggered self-reporting NO release. (B) The structure of CouN(NO)-R, the mechanism of NO release. (I) Under UV light irradiation, CouN(NO)-R is directly photolyzed to release NO. (II) Under red-light irradiation, photoredox catalysis occurs facilitated by photosensitizers to release NO.
Fig. 18
Fig. 18. (A) The structure of S-NO, the mechanism of NO release and its fluorescence changes. (B) Assembly of S-NO NPs and synergistic tumor treatment and evaluation of GT and PTT produced by injection into mice. Reproduced from ref. with the permission of Elsevier Ltd, copyright 2021.
Fig. 19
Fig. 19. Mechanism of NO release from nitrobenzene compounds.
Fig. 20
Fig. 20. The structure of MSCD, the mechanism of NO release and its fluorescence changes.
Fig. 21
Fig. 21. The structure of β-cyclodextrin polymers, the mechanism of NO release and the fluorescence changes.
Fig. 22
Fig. 22. N-Diazeniumdiolate compounds release NO.
Fig. 23
Fig. 23. (A) The rational design of O2-(4-hydroxyphenacyl) diazeniumdiolates DEA-1 and DEA-2 as well as O2-(3-(benzothiazole-2-yl)-4-hydroxyphenacyl) diazeniumdiolates DEA-3 and DEA-4, together with the proposed mechanism underlying the photorelease of NO. (B) The structure of DEA-3, the mechanism of NO release and the fluorescence changes.
Fig. 24
Fig. 24. The structure of FLUORO/NO, the mechanism of NO release and its fluorescence changes.
Fig. 25
Fig. 25. The structure of donor, the mechanism of NO release and fluorescence changes. Reproduced from ref. with the permission of the Royal Society of Chemistry, copyright 2019.
Fig. 26
Fig. 26. Schematic of the synthesis of Arg-dots and their NO release process in tumor cells. Reproduced from ref. with the permission of Elsevier Ltd, copyright 2021.
Fig. 27
Fig. 27. Schematic of in situ size transformation cluster nanosystem mediated by tumor acidity and bioorthogonal chemistry to overcome hypoxic resistance and enhance chemical immunotherapy. (A) Schematic diagram of preparation of iCPDNN3 and iCPDNDBCO, forming large particle size aggregates by efficient biological orthogonal click reaction under acidic environment, and then slowly releasing small particle size PDN. (B) (i) In situ size transformation cluster nanosystem enhanced tumor accumulation, retention, and penetration. (ii) NO overcomes hypoxia resistance by down-regulating HIF-1α level and enhances the chemotherapy effect of DOX. (iii) NO and DOX can induce stronger immunogenic cell death and activate anti-tumor immune responses. Reproduced from ref. with the permission of the American Chemical Society, copyright 2022.
Fig. 28
Fig. 28. (A) The structure of SISIN-1 and mechanism of NO release (B) SISIN-1 combines with albumin to form AL-SISIN-1, which delivers drugs to tumor draining lymph nodes and inhibits cancer cell metastasis. Reproduced from ref. with the permission of Wiley-VCH GmbH, copyright 2022.
Fig. 29
Fig. 29. (A) The structure of NODf3, the mechanism of NO release and its fluorescence changes. (B) NODf3 combined with Trolox protects HUVECs from OGD-induced apoptosis. Reproduced from ref. with the permission of Elsevier Inc., copyright 2021.
Fig. 30
Fig. 30. (A)–(C) The structure of Mn-carbonyl complexs, the mechanism of CO release and fluorescence changes.
Fig. 31
Fig. 31. (A) The structure of APIPB–MnCO@TPP@N,P-GQDs, the mechanism of CO release and its fluorescence changes. (B) (a) The absorbance change of hemoglobin in the presence of Nanoplatform/CO irradiated by 808 nm laser (800 mW cm−2), with the inset showing the CO release profiles. (b) The NIR controllability of Nanoplatform/CO for CO release upon the on/off switching of an 808 nm laser. Fluorescence detection of mouse mitochondrial membrane potential, Nanoplatform/CO treated HeLa cells (c) under dark environment and (d) under 808 nm laser irradiation. Reproduced from ref. with the permission of Elsevier Inc., copyright 2022.
Fig. 32
Fig. 32. (A) Illustration of red-light-triggered self-reporting CO release from micellar nanoparticles containing TTQ-2TC-4T, PCB-b-PPG-b-PCB and CO-releasing Mn2(CO)10 moieties within the cores. (B) Infrared photothermal imaging of MCF-7 tumor mice triggered by 808 nm light and its therapeutic effect on cancer. Reproduced from ref. with the permission of Elsevier Ltd, copyright 2022.
Fig. 33
Fig. 33. CORMs based on 3-hydroxyflavone and 3-hydroxyquinolone.
Fig. 34
Fig. 34. Mechanism of CO release from flavonol compounds.
Fig. 35
Fig. 35. (A) The structure of SL-photoCORM (SL-p), the mechanism of CO release and its fluorescence changes. (B) SL-p in A549 cells is converted into the confocal image of SL-a under the action of mercaptan. (C) The process behave like an AND logic gate. Parts (B) and (C) are reproduced from ref. with the permission of the American Chemical Society, copyright 2017.
Fig. 36
Fig. 36. (A) The structure of MC-photoCORM, the mechanism of CO release and its fluorescence changes. (B) MC-a (n = 1) and MTR intensity distribution strongly indicates that MC-a is located in the mitochondria. Reproduced from ref. with the permission of the American Chemical Society, copyright 2018.
Fig. 37
Fig. 37. The structure of QA-photoCORM, the mechanism of CO release and its fluorescence changes. Reproduced from ref. with permission of the American Chemical Society, copyright 2018.
Fig. 38
Fig. 38. (A) The structure of cytosolic/extracellular-photoCORM, the mechanism of CO release and its fluorescence changes. (B) Fluorescence detection of CO release from Cyt-1 and Cyt-2 (50 μM) using a Nile red-based CO sensor (1-Ac) in RAW 264.7 cells. Green channel: detection of fluorescence emission by cytosolic/extracellular. Red channel: detection of CO sensor. Size of bar = 40 μm. (C) and (D) extracellular administration shows significant anti-inflammatory effect. Reproduced from ref. with the permission of the American Chemical Society, copyright 2019.
Fig. 39
Fig. 39. (A) The structure of FB, the mechanism of CO release and its fluorescence changes. (B) (a) The structure and sensing mechanism of FB toward H2O2-activated and CO photo-releaser. (b) The H2O2 mapping and CO releasing in vitro. (c) The H2O2 mapping and CO-release in vivo. (d) The vasodilatation effect of CO and angiotensin type 2 induced H2O2 fluctuation. Reproduced from ref. with the permission of Wiley-VCH Verlag GmbH & Co. KGaA, Weinheim, copyright 2018.
Fig. 40
Fig. 40. (A) The structure of Cou-Flavone, the mechanism of CO release and its fluorescence changes. (B) The capacity of Cou-Flavone for CO-release was investigated in HEPES buffer (10 mM, pH 7.4, with 10% DMSO, v/v) at room temperature under light irradiation (460 nm, 7 W cm2). Typical ratiometric fluorescence changes were observed before and after irradiation. Reproduced from ref. with the permission of the Royal Society of Chemistry, copyright 2019.
Fig. 41
Fig. 41. (A) The structure of PEO-b-PFNM, the mechanism of CO release and fluorescence changes. (B) Comparison of the treatment effect of PBS, OM and OC micelles on skin wounds. Reproduced from ref. with the permission of the Royal Society of Chemistry, copyright 2020.
Fig. 42
Fig. 42. The structure of PTT-HF, the mechanism of CO release and its fluorescence changes. Reproduced from ref. with the permission of Wiley-VCH GmbH, copyright 2021.
Fig. 43
Fig. 43. (A) The structure of PCNO, the mechanism of CO and NO release and its fluorescence changes. (B) Proposed degradation mechanism of the NO/CO-releasing H-NOCO under 410 nm light irradiation. (C) The schematic diagram of the synergistic release of NO and CO in visible-light mediated PCNO micelles can play a synergistic bactericidal role on Gram-positive bacteria through hyperpolarization and penetration of bacterial plasma membrane, leading to the loss of intracellular substances and bacterial death. (D) Evaluation of therapeutic effect on mice infected with MRSA. Parts (C) and (D) are reproduced from ref. with the permission of Wiley-VCH GmbH, copyright 2021.
Fig. 44
Fig. 44. (A) The structure of NIR-photoCORM, the mechanism of CO release and its fluorescence changes. (B) Two mechanistic pathways for CO release from NIR-photoCORM.
Fig. 45
Fig. 45. The structure of COR-BDPs, the mechanism of CO release and fluorescence changes.
Fig. 46
Fig. 46. The structure of pro-drug, the mechanism of CO release and its fluorescence changes.
Fig. 47
Fig. 47. Structure of the Pro-drug, and mechanism of CO release resulting in fluorescence changes.
Fig. 48
Fig. 48. (A) and (B) Rational design of PCOD585 and its proposed mechanism of action. LG = leaving group. (C) PCOD585 was tested for in vitro applications in PC12 cells and EA.hy 926 cells. Reproduced from ref. with the permission of the American Chemical Society, copyright 2022.
Fig. 49
Fig. 49. The structures of SGD (A), SPD-1 (B), SPD-2 (C).
Fig. 50
Fig. 50. The structure of ESIPT/H2S, and the mechanism of H2S release and fluorescence changes.
Fig. 51
Fig. 51. (A) Proposed Photodissociation mechanism of QuH2S-CDs. (B) The ability of cellular uptake of QuH2S-CD was observed by confocal microscope imaging. Release of H2S from QuH2S-CDs was monitored before and after irradiation for 50 min with light (λ ≥ 410 nm). Reproduced from ref. with the permission of the Royal Society of Chemistry, copyright 2020.
Fig. 52
Fig. 52. (A) The structure of Pry-Ps, the mechanism of H2S release. Schematic illustration of the NIR-II fluorescence tracked Pry-Ps@CP-PEG. (B) Pry-Ps@CP-PEG fluorescence and photothermal imaging in mice. Parts (A) and (B) are reproduced from ref. with the permission of Wiley-VCH GmbH, copyright 2021.
Fig. 53
Fig. 53. (A) The structure of AIE-active PFHMA-g-PEG/SBTHA, the mechanism of H2S release. (B) Fluorescence spectrum of AIE-active PFHMA-g-PEG/SBTHA in water or THF (λex = 390 nm, λem = 570 nm). Inset: Fluorescence image in water under 365 nm UV light. (C) CLSM images of L929 cells after incubation with 50 μg mL−1 of AIE-active PFHMA-g-PEG/SBTHA conjugate (i.e. salicylaldazine moieties). (a) Bright field, (b) excited with a 390 nm laser. Reproduced from ref. with the permission of the Royal Society of Chemistry, copyright 2018.
Fig. 54
Fig. 54. (A) The structure of UTS-1 and UTS-2. (B) The mechanism of H2S release and its fluorescence changes. Images of UTS-1 (20 μM, vial 1, 2) and UTS-1 (20 μM) with GSH (100 μM, vial 3; 200 μM, vial 4) in DMSO after 15 min. Reproduced from ref. with the permission of the Royal Society of Chemistry, copyright 2020.
Fig. 55
Fig. 55. (A) The structure of Pro-s, the mechanism of H2S release and its fluorescence changes. (B) Pro-s releases H2S confocal fluorescence imaging in zebrafish. Reproduced from ref. with the permission of the American Chemical Society, copyright 2021.
Fig. 56
Fig. 56. (A) The structure of HSD560, the mechanism of H2S release and its fluorescence changes. (B) HSD560 released H2S confocal fluorescence imaging in zebrafish. Reproduced from ref. with the permission of the Royal Society of Chemistry, copyright 2021.
Fig. 57
Fig. 57. Under different triggering conditions, the thiocarbamate (A)/thiocarbonate (B) breaks to release COS.
Fig. 58
Fig. 58. (A) Proposed decomposition mechanism of BDP-H2S. Under 470 nm light irradiation, the B–O bond of BDP-H2S is broken to produce intermediate BDP-M. Then intermediate BDP-M undergoes 1,6-elimination to generate COS, which is rapidly hydrolyzed to H2S in the presence of CA. (B) Fluorescence intensity comparison of BDP-H2S before and after light triggering (λex = 470 nm, λem = 540 nm). Reproduced from ref. with the permission of the American Chemical Society, copyright 2017.
Fig. 59
Fig. 59. Proposed photodissociation mechanism of Nap-Sul-ONB. Under 365 nm light activation, the photolysis group (o-nitrobenzyl) undergoes a self-elimination reaction to release COS, and then COS is rapidly hydrolyzed to H2S in the presence of CA.
Fig. 60
Fig. 60. Proposed decomposition mechanism of FLD-S. Under thiol triggered, FLD-S undergoes a cascade reaction to release COS, and then COS is rapidly hydrolyzed to H2S in the presence of CA.
Fig. 61
Fig. 61. Proposed decomposition mechanism of HL-H2S. Triggered by H2S, the azide group of HL-H2S is reduced, thus undergoes self-immolation to generate COS, and then COS is rapidly hydrolyzed to H2S in the presence of CA.
Fig. 62
Fig. 62. (A) Proposed decomposition mechanism of NAB. (B) (a) Fluorescence spectra of NAB (10 μM) with H2O2 (100 μM) at various times in phosphate buffer (20 mM, pH 7.4). (b) Fluorescence kinetic curves of NAB (10 μM) with different H2O2 concentrations. (c) Linear relationship between fluorescence intensity and H2O2 concentrations. (d) Fluorescence changes of NAB (10 μM) in the presence of different ROS species. (1) NAB only; (2) H2O2 (100 μM); (3) NO (100 μM); (4) ClO (100 μM); (5) ˙OH (100 μM); (6) 1O2 (100 μM); (7) O2 (100 μM); (8) TBHP (100 μM); (9) TBO˙ (100 μM); (10) ONOO (10 μM). (λex = 405 nm, λem = 577 nm). Reproduced from ref. with the permission of the Royal Society of Chemistry, copyright 2019.
Fig. 63
Fig. 63. (A) Proposed decomposition mechanism of HSD545 releasing H2S. (B) Fluorescence imaging of H2S released by HSD545 in zebrafish. Reproduced from ref. with the permission of Elsevier B.V., copyright 2021.
Fig. 64
Fig. 64. Proposed decomposition mechanism of HSD-R.
Fig. 65
Fig. 65. Proposed decomposition mechanism of HSD-B releasing H2S.
Fig. 66
Fig. 66. (A) Proposed decomposition mechanism of ZL47. (B) (a) Time-dependent H2S release from ZL47. (b) Linear relationship between fluorescence intensity and H2O2 (λex = 365 nm, λem = 448 nm). Reproduced from ref. with the permission of Elsevier Ltd, copyright 2021.
Fig. 67
Fig. 67. (A) and (B) P-TCO,T-DTOs structure, COS release mechanism and fluorescence changes. (C) L-DTO structure, COS release mechanism and fluorescence changes. Reproduced from ref. with the permission of Wiley-VCH GmbH, copyright 2021.
Fig. 68
Fig. 68. (A) γ-KetoTCM-1-2 structure, H2S release mechanism and fluorescence changes. (B) (a) Formation of p-nitroaniline (PNA) after compound activation. (b) H2S Delivery from γ-KetoTCM-1 in HeLa cells. HeLa cells were treated with a cell-trappable H2S fluorescent probe SF7-AM (5 μM) for 30 min, washed, and incubated with FBS-free DMEM only (left), with 100 μM γ-KetoCM-1 (middle), or with γ-KetoTCM-1 (right) for 2 h. Cells were then washed and imaged in PBS. Scale bar: 100 μM. Reproduced from ref. with the permission of Wiley-VCH Verlag GmbH & Co. KGaA, Weinheim, copyright 2018.
Fig. 69
Fig. 69. The structure of DOP-NAC, the mechanism of RSSH release.
Fig. 70
Fig. 70. ROS triggered RSSR release.
Fig. 71
Fig. 71. (A) The structure of BOP-fluor, the mechanism of RSSR release and its fluorescence changes. (B) Triggered by excessive H2O2, BOP fluor releases 7-hydroxycoumarin within 5 hours, resulting in a 100-fold fluorescence change. (C) The relative response of BDP fluor (3.3 μM) to each potential trigger (330 μM) or control (no trigger added). Reproduced from ref. with the permission of John Wiley-VCH Verlag GmbH & Co. KGaA, Weinheim, copyright 2018.
Fig. 72
Fig. 72. The structure of probe, the mechanism of RSSR release and its fluorescence changes.
Fig. 73
Fig. 73. (A) Schematic illustration of NIR light-triggered SO2 generation from RUCSNs-DM. (B) UV-vis absorption spectra of DM before and after UV irradiation (365 nm). (C) Confocal imaging of intracellular ROS levels in HeLa cells after treatment with PBS (control), RUCSNs, RUCSNs + NIR (980 nm laser irradiation), RUCSNs-DM, RUCSNs-DM + NIR (980 nm laser irradiation) (D) Intracellular TUNEL staining in HeLa cells after treatment with different formulations (blue fluorescence: DAPI, green fluorescence: TUNEL). The yellow arrows indicated the overlap of blue fluorescence from DAPI and the green fluorescence from TUNEL, suggesting DNA fragmentation in the nucleus. Parts (A–D) are reproduced from ref. with the permission of the American Chemical Society, copyright 2019.
Fig. 74
Fig. 74. DMNB structure, mechanism of SO2 release, and fluorescence changes.
Fig. 75
Fig. 75. Proposed photodissociation mechanism of sulfonate DMNB-1a.
Fig. 76
Fig. 76. (A) Formation of Au@MnO2NPs nanoparticles. (B) and (C) Proposed decomposition mechanism of BTS releasing SO2 and self-reporting GT. Fluorescein isothiocyanate (FITC) is coupled to the surface of Au by caspase-3 responsive peptide (DEVEC). The fluorescence of FITC was quenched due to the FRET effect between Au NPs and FITC. However, caspase-3 is overexpressed in apoptotic tumor cells. As such DEVEC is cleaved and FITC fluorescence is restored to achieve “self-reporting” during the therapeutic process. Reproduced from ref. with the permission of Wiley-VCH GmbH, copyright 2021.
Fig. 77
Fig. 77. Under the trigger of GSH, 2,4-dinitrobenzenesulfonyl group releases SO2.
Fig. 78
Fig. 78. (A) Construction of a nano platform (MON-DN@PCBMA-DOX) and its SO2-release mechanism. (B) In vivo NIR-FI of tumor-bearing mice after injection of Cy7, MON-Cy7, and MON@PCBMA-Cy7 (1 mg mL−1, 100 μL). Reproduced from ref. with the permission of Wiley-VCH Verlag GmbH & Co. KGaA, Weinheim, copyright 2020.
Fig. 79
Fig. 79. (A) The structure of Cyl-DNBS, the mechanism of SO2 release and its fluorescence change. (B) Cyl-DNBS generates ROS and SO2 fluorescence imaging in cells. (C) Effect of Cyl-DNBS on cancer mice. Parts (B) and (C) are reproduced from ref. with the permission of Wiley-VCH GmbH, copyright 2021.
Fig. 80
Fig. 80. (A) The structure of BIBCl-PAE NPs, the mechanism of releasing 1O2 and its fluorescence changes. (B) and (C) Effect of PDT on tumors. Parts (B) and (C) are reproduced from ref. with the permission of the Royal Society of Chemistry, copyright 2020.
Fig. 81
Fig. 81. (A) Schematic illustration of APN-Cyl for APN imaging and cancer treatment. (B) Fluorescence imaging of endogenous APN in tumor Balb/c mice in 150 min. Reproduced from ref. with the permission of Elsevier Ltd, copyright 2020.
Fig. 82
Fig. 82. (A) The aggregated fluorophore is converted into photosensitizer (ISC on), and the fluorescence is quenched to produce ROS; the disaggregated photosensitizer is converted into a fluorophore (ISC off), and the fluorescence is restored without generating ROS. (B) BODIPY derivative structure. Reproduced from ref. with the permission of the Chinese Chemical Society, copyright 2021.
Fig. 83
Fig. 83. The structure of CPT-Se3 and CPT-Se4, the mechanism of CPT and O2˙ release and the fluorescence changes. Reproduced from ref. with the permission of the American Chemical Society, copyright 2021.
Fig. 84
Fig. 84. Schematic illustration of (A) synthesis of Cu–OCNP/Lap and (B) its intracellular delivery and NIR-II reinforced intracellular β-Lap cyclic reaction with abundant H2O2 supply to enhance CDT. Reproduced from ref. with the permission of Elsevier Ltd, copyright 2021.
Fig. 85
Fig. 85. (A) Proposed decomposition mechanism of photoFAD-3 releasing FA. (B) Epifluorescence and (C) IVIS images of HEK293 cells stained with photoFAD-3 after 0, 5, 20, 60, and 180 s of photoactivation. Scale bar represents 100 μm. Parts (B) and (C) are reproduced from ref. with the permission of the American Chemical Society, copyright 2020.
None
From left to right: Jing Yu, Jie Xu, Chao Wang, Tony D. James, Guang Chen and Siyue Ma
None
Luling Wu
None
Simon E. Lewis
None
Yanfeng Yue
None
Zhe Sun
None
Yuxia Liu
None
Bo Tang

References

    1. Szabo C. Nat. Rev. Drug Discovery. 2016;15:185–203. doi: 10.1038/nrd.2015.1. - DOI - PMC - PubMed
    1. Carlstrom M. Nat. Rev. Nephrol. 2021;17:575–590. doi: 10.1038/s41581-021-00429-z. - DOI - PMC - PubMed
    1. Forrester S. J. Kikuchi D. S. Hernandes M. S. Xu Q. Griendling K. K. Circ. Res. 2018;122:877–902. doi: 10.1161/CIRCRESAHA.117.311401. - DOI - PMC - PubMed
    1. Kou Y. Zhao H. Cui D. Han H. Tong Z. Ageing Res. Rev. 2022;73:101512. doi: 10.1016/j.arr.2021.101512. - DOI - PubMed
    1. Li Z. Polhemus D. J. Lefer D. J. Circ. Res. 2018;123:590–600. doi: 10.1161/CIRCRESAHA.118.311134. - DOI - PubMed