. 2024 Jun 4;16(6):evae100.
doi: 10.1093/gbe/evae100.

Matreex: Compact and Interactive Visualization for Scalable Studies of Large Gene Families

Affiliations

Matreex: Compact and Interactive Visualization for Scalable Studies of Large Gene Families

Victor Rossier et al. Genome Biol Evol. .

Abstract

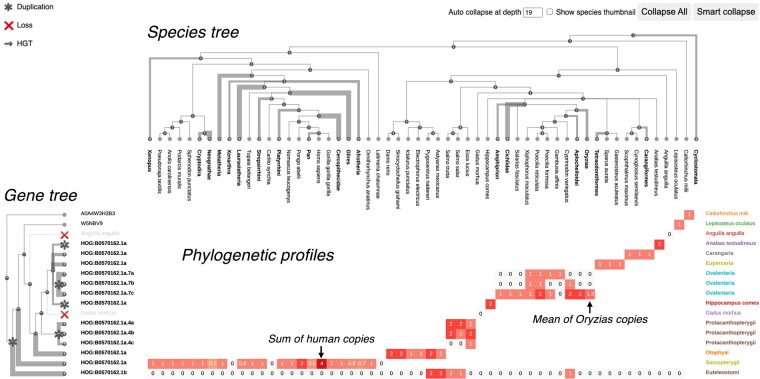
Studying gene family evolution strongly benefits from insightful visualizations. However, the ever-growing number of sequenced genomes is leading to increasingly larger gene families, which challenges existing gene tree visualizations. Indeed, most of them present users with a dilemma: display complete but intractable gene trees, or collapse subtrees, thereby hiding their children's information. Here, we introduce Matreex, a new dynamic tool to scale up the visualization of gene families. Matreex's key idea is to use "phylogenetic" profiles, which are dense representations of gene repertoires, to minimize the information loss when collapsing subtrees. We illustrate Matreex's usefulness with three biological applications. First, we demonstrate on the MutS family the power of combining gene trees and phylogenetic profiles to delve into precise evolutionary analyses of large multicopy gene families. Second, by displaying 22 intraflagellar transport gene families across 622 species cumulating 5,500 representatives, we show how Matreex can be used to automate large-scale analyses of gene presence-absence. Notably, we report for the first time the complete loss of intraflagellar transport in the myxozoan Thelohanellus kitauei. Finally, using the textbook example of visual opsins, we show Matreex's potential to create easily interpretable figures for teaching and outreach. Matreex is available from the Python Package Index (pip install Matreex) with the source code and documentation available at https://github.com/DessimozLab/matreex.

Keywords: gene evolution; phylogenetic profile; software tool; tree reconciliation; visualization.


Figures

Fig. 1.
Fig. 1.
Matreex's layout consists of a gene tree, a species tree and a matrix of phylogenetic profiles. Gene tree labels represent gene subfamily memberships (OMA HOGs in this case) for collapsed nodes, gene ids for leaves, and taxon or species names for lost genes (implied from the species tree). Figures in the phylogenetic profiles represent the average number of in-paralogs of the clade species. For a given profile, clades that have lost their genes are displayed with zeros on a gray background, while clades that are outgroups of the corresponding subtree remain empty. Branch thickness increases with the collapsed subtree size and cell color darkness with the number of in-paralogs in the cell. The taxonomic levels of collapsed subtrees and phylogenetic profiles are annotated on the right. “Auto-collapse at depth” enables the automatic collapse of the species tree at a given depth from the root. “Show species thumbnail” enables displaying a taxon image (at present from Wikipedia) when hovering over a taxon. “Collapse All” and “Smart collapse” are two default views described in the main text. The examples shown are red-sensitive visual opsins (data from OMA, All.Dec2021 release). Italic annotations do not belong to the Matreex layout but were added for figure clarity.
Fig. 2.
Fig. 2.
Detailed evolutionary analysis of the eukaryotic MutS family. a) Matreex view of the MutS gene family (gene tree from PANTHER v.17). Clade legends and gene family names do not belong to the Matreex layout but were added for figure clarity. b) Hypotheses on MutS evolution discussed in the text with their level of support in the literature and in the examined gene tree. An orange, green, or blue background indicates, respectively, a conflict with the literature, no conflict with the literature, or a new hypothesis from this work.
Fig. 3.
Fig. 3.
IFT gene families (data from OMA all.Dec2021). Colored clades display partial and complete IFT losses that fit the “last-in, first-out” hypothesis for gene module evolution. ✓ highlights partial IFT losses reported by van Dam et al. (2013) and ? the ones reported here. To our knowledge, we are the first to report a complete loss of IFT in the mixozoan T. kitauei. The species tree is unresolved because it comes from the OMA database, which is derived from the NCBI taxonomy (Schoch et al. 2020). Clade legends, Italic annotations, brackets, ✓, and ? symbols do not belong to the Matreex layout but were added for figure clarity.
Fig. 4.
Fig. 4.
Visual opsin families in vertebrates (data from OMA All.Dec2021). Adaptations involved in textbook correlations with patterns of gene losses and duplications are annotated with separate colors. Nocturnality in snakes and mammals: loss of blue- and green-sensitive opsins. Frugivory in old-world primates: duplications of red-sensitive opsin. Deep-water: loss of violet- and red-sensitive opsins, duplications of blue- and green-sensitive opsins. Turbid water: duplications of red-sensitive opsins. Benthic: duplications of green-sensitive opsins. Ecological niche legends on the left do not belong to the Matreex layout but were added for figure clarity.

References

    1. Altenhoff AM, Levy J, Zarowiecki M, Tomiczek B, Warwick Vesztrocy A, Dalquen DA, Müller S, Telford MJ., Glover NM, Dylus D, et al. OMA standalone: orthology inference among public and custom genomes and transcriptomes. Genome Res. 2019:29(7):1152–1163. 10.1101/gr.243212.118. - DOI - PMC - PubMed
    1. Altenhoff AM, Train C-M, Gilbert KJ, Mediratta I, Mendes de Farias T, Moi D, Nevers Y, Radoykova H-S, Rossier V, Warwick Vesztrocy A, et al. OMA orthology in 2021: website overhaul, conserved isoforms, ancestral gene order and more. Nucleic Acids Res. 2021:49(D1):D373–D379. 10.1093/nar/gkaa1007. - DOI - PMC - PubMed
    1. Aury J-M, Jaillon O, Duret L, Noel B, Jubin C, Porcel BM, Ségurens B, Daubin V, Anthouard V, Aiach N, et al. Global trends of whole-genome duplications revealed by the ciliate Paramecium tetraurelia. Nature. 2006:444(7116):171–178. 10.1038/nature05230. - DOI - PubMed
    1. Badano JL, Mitsuma N, Beales PL, Katsanis N. The ciliopathies: an emerging class of human genetic disorders. Annu Rev Genomics Hum Genet. 2006:7(1):125–148. 10.1146/annurev.genom.7.080505.115610. - DOI - PubMed
    1. Bell JS, Harvey TI, Sims A-M, McCulloch R. Characterization of components of the mismatch repair machinery in Trypanosoma brucei. Mol Microbiol. 2004:51(1):159–173. 10.1046/j.1365-2958.2003.03804.x. - DOI - PubMed

Publication types