. 2024 May 28;20(10):4350-4362.
doi: 10.1021/acs.jctc.4c00370. Epub 2024 May 14.

Multistate Method to Efficiently Account for Tautomerism and Protonation in Alchemical Free-Energy Calculations

Affiliations

Multistate Method to Efficiently Account for Tautomerism and Protonation in Alchemical Free-Energy Calculations

Candide Champion et al. J Chem Theory Comput. .

Abstract

The majority of drug-like molecules contain at least one ionizable group, and many common drug scaffolds are subject to tautomeric equilibria. Thus, these compounds are found in a mixture of protonation and/or tautomeric states at physiological pH. Intrinsically, standard classical molecular dynamics (MD) simulations cannot describe such equilibria between states, which negatively impacts the prediction of key molecular properties in silico. Following the formalism described by de Oliveira and co-workers (J. Chem. Theory Comput. 2019, 15, 424-435) to consider the influence of all states on the binding process based on alchemical free-energy calculations, we demonstrate in this work that the multistate method replica-exchange enveloping distribution sampling (RE-EDS) is well suited to describe molecules with multiple protonation and/or tautomeric states in a single simulation. We apply our methodology to a series of eight inhibitors of factor Xa with two protonation states and a series of eight inhibitors of glycogen synthase kinase 3β (GSK3β) with two tautomeric states. In particular, we show that given a sufficient phase-space overlap between the states, RE-EDS is computationally more efficient than standard pairwise free-energy methods.


Conflict of interest statement

The authors declare no competing financial interest.

Figures

Figure 1
Figure 1
EDS reference potential-energy function VR (in light brown), which “envelopes” the minima of the potential-energy surfaces of the states A (dotted blue) and B (dotted red). There is a strong phase-space overlap between states A and A′ (dashed blue) (as well as B and B′ (dashed red)), highlighting how the addition of states with good phase-space overlap does not alter the reference potential much (i.e., the four-state EDS reference state (dark brown) is very similar to the two-state EDS reference state). Representative molecules are drawn to showcase the more challenging alchemical side-chain transformation of an aromatic hydroxyphenyl into a nonaromatic cyclopropyl, whereas the simpler transformations correspond to the two tautomeric states of the imidazole core.
Figure 2
Figure 2
Inhibitors studied in this work: FXa data set (left) and GSK3β data set (right). For compounds 18, the nitrogen shown in blue can exist in either protonated or deprotonated form. In the text, we will refer to the protonated form of compound C as Ca and to the deprotonated form as Cb. The perturbed part of the molecule is shown as a bold gray ring. All other atoms were represented only once in the system (hybrid topology). Molecules 2 and 3 are two tautomers of the same molecule. For compounds 916, the imidazole ring (marked in blue) can exist in two tautomeric forms (A and B). All experimental binding affinities and SMILES are given in Tables S5 and S8 of the Supporting Information.
Figure 3
Figure 3
Representative conformations of ligand 1 bound to FXa in its protonated form (A, shown in pink) and deprotonated form (B, shown in blue). The binding pose highlights the solvent exposed nature of the tertiary amine (water molecules within 0.5 nm of the nitrogen are shown in sticks, and hydrogen bonding interactions are shown with dashes). Note that the orientation from which the binding pose is viewed is rotated by 180° between subfigures A and B.
Figure 4
Figure 4
Comparison between calculated and experimental binding free energies for the FXa data set. Dark and light gray regions correspond to margins of error of 4.2 and 8.4 kJ mol–1, respectively. Error bars correspond to standard deviations over the five repeats. (A) Results from RE-EDS simulations based on the binding free energies of the deprotonated (blue) and protonated (purple) states only. (B) Results from RE-EDS simulations based on the combined values of protonation isomers (dark green), as well as with the combined binding free energies for the tautomeric molecules 2 and 3 (light green) with Jaguar pKa estimates (eqs 1–8). (C) Same analysis using rule-based pKa values from ACD Percepta to combine states. Data points are labeled with the corresponding molecule identifier.
Figure 5
Figure 5
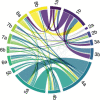
Chord diagram representation of the transitions between all end states in the two highest replicas (s = 1 and s = 0.29326) of the FXa RE-EDS production run (no or minimal smoothing of the potential-energy surface). The thickness of each line is representative of the number of transitions between source and target state, and lines are colored according to the source state. Raw data is given in Table S6 of the Supporting Information.
Figure 6
Figure 6
Comparison of calculated and experimental binding free energies for the GSK3β data set. Dark and light gray regions correspond to margins of error of 4.2 and 8.4 kJ mol–1, respectively. Error bars correspond to standard deviations over the five repeats. (A) Results from RE-EDS simulations based on the binding free energies of tautomers A (blue) and B (purple) only. (B) Results from RE-EDS simulations based on the combined values of tautomers A and B (green), using ACD derived pKa estimates. Data points are labeled with the corresponding molecule identifier.
Figure 7
Figure 7
Representative conformations of ligand 9 bound to the hinge region of GSK3β in its tautomeric forms A (shown in pink) and B (shown in blue). The polar residues interacting with the ligand are shown in orange (Lys85, Glu97, and Asp200), and nonpolar residues in the buried part of the binding pocket are shown in yellow. Hydrogen bonding interactions are represented by dashed lines.
Figure 8
Figure 8
Chord diagram representation of the transitions between all end states in the GSK3β RE-EDS production run in (a) the two highest-s replicas (s = 1 and s = 0.10818) with no or minimal smoothing of the potential-energy surface, and (b) at all s-values. The thickness of each line corresponds is representative of the number of transitions. Ligands with nonaromatic substituents are marked in purple and ligands with aromatic substituents in green. Raw data is given in Tables S9 and S10 of the Supporting Information.
Figure 9
Figure 9
Comparison of the sampling time required for RE-EDS and pairwise TI calculations, assuming a single repeat of the production run. For both data sets, the TI perturbation map has the minimal size N – 1. For the FXa data set, we report the exact protocol used by de Oliveira et al. For the GSK3β data set, a recommended TI setup was assumed (see main text).

Similar articles

Cited by

References

    1. Garcia-Moreno B. Adaptations of Proteins to Cellular and Subcellular pH. J. Biol. 2009, 8, 98.10.1186/jbiol199. - DOI - PMC - PubMed
    1. Freeman S. A.; Grinstein S.; Orlowski J. Determinants, Maintenance, and Function of pH. Physiol. Rev. 2023, 103, 515–606. 10.1152/physrev.00009.2022. - DOI - PubMed
    1. Anderson D. E.; Becktel W. J.; Dahlquist F. W. pH-induced Denaturation of Proteins: a Single Salt Bridge Contributes 3–5 kcal/mol to the Free Energy of Folding of T4 Lysozyme. Biochem. 1990, 29, 2403–2408. 10.1021/bi00461a025. - DOI - PubMed
    1. Yang A.-S.; Honig B. On the pH Dependence of Protein Stability. J. Mol. Biol. 1993, 231, 459–474. 10.1006/jmbi.1993.1294. - DOI - PubMed
    1. Talley K.; Alexov E. On the pH-optimum of Activity and Stability of Proteins. Proteins 2010, 78, 2699–2706. 10.1002/prot.22786. - DOI - PMC - PubMed

LinkOut - more resources