. 2024 Oct 4;14(10):1823-1837.
doi: 10.1158/2159-8290.CD-23-1459.

Perivascular NOTCH3+ Stem Cells Drive Meningioma Tumorigenesis and Resistance to Radiotherapy

Affiliations

Perivascular NOTCH3+ Stem Cells Drive Meningioma Tumorigenesis and Resistance to Radiotherapy

Abrar Choudhury et al. Cancer Discov. .

Abstract

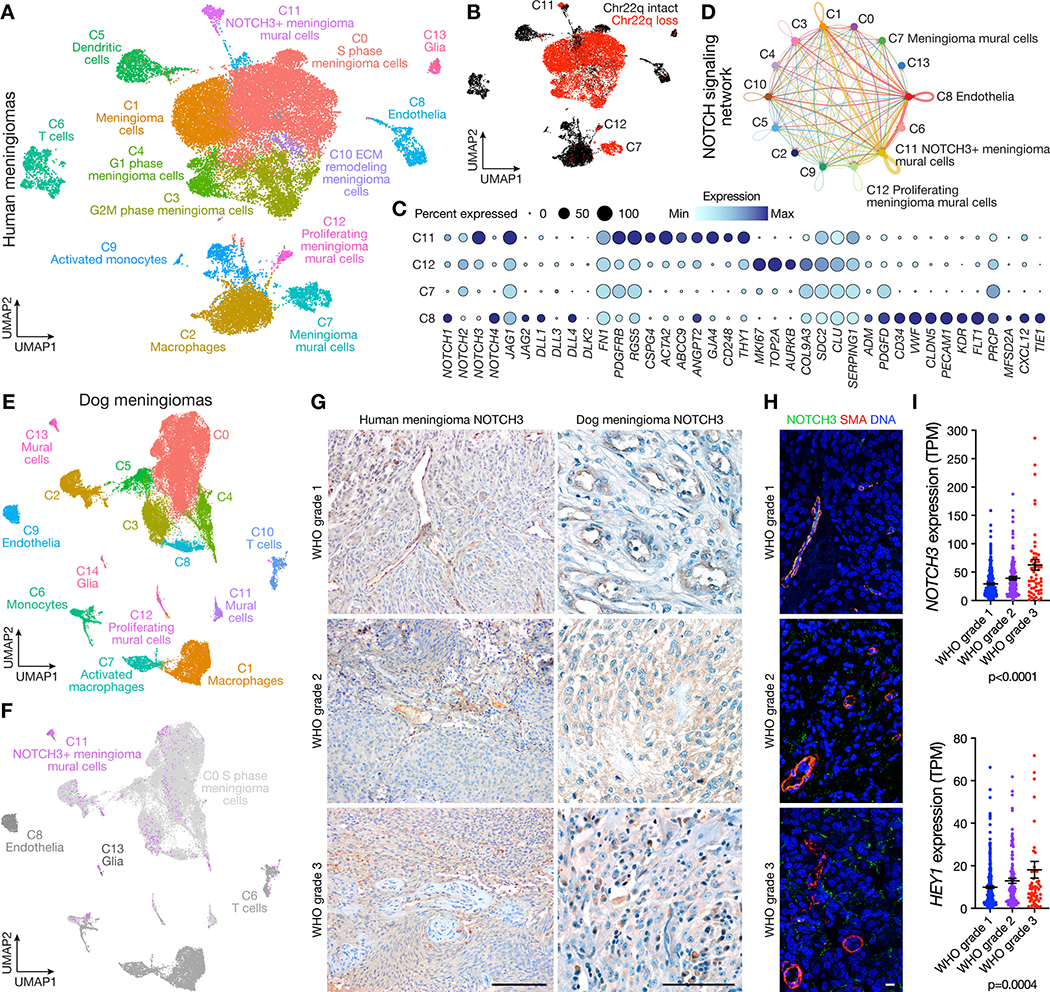
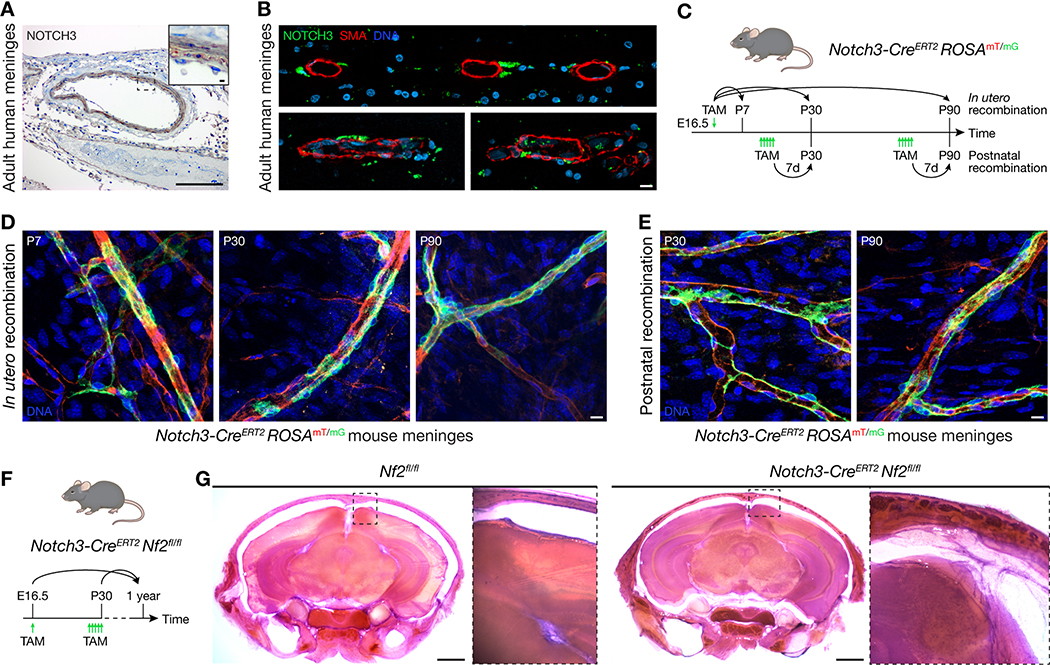
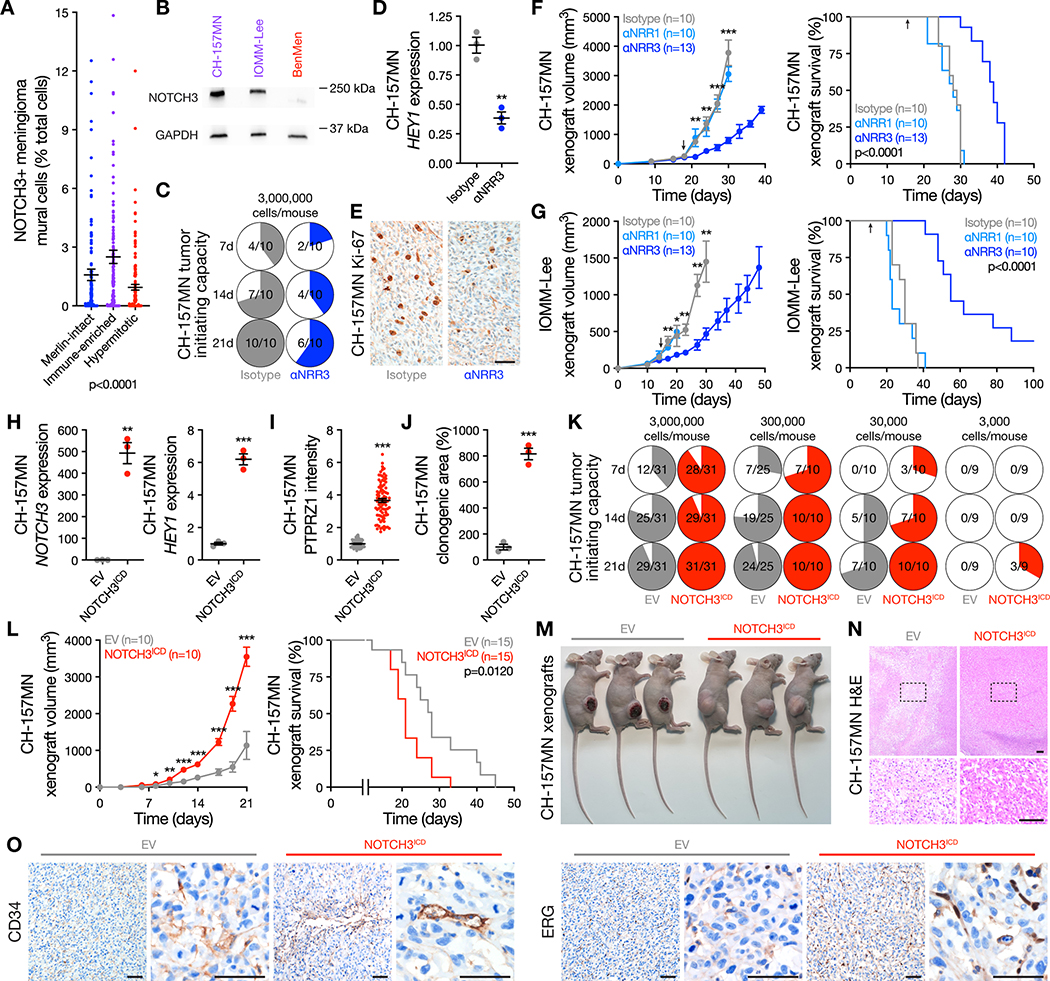
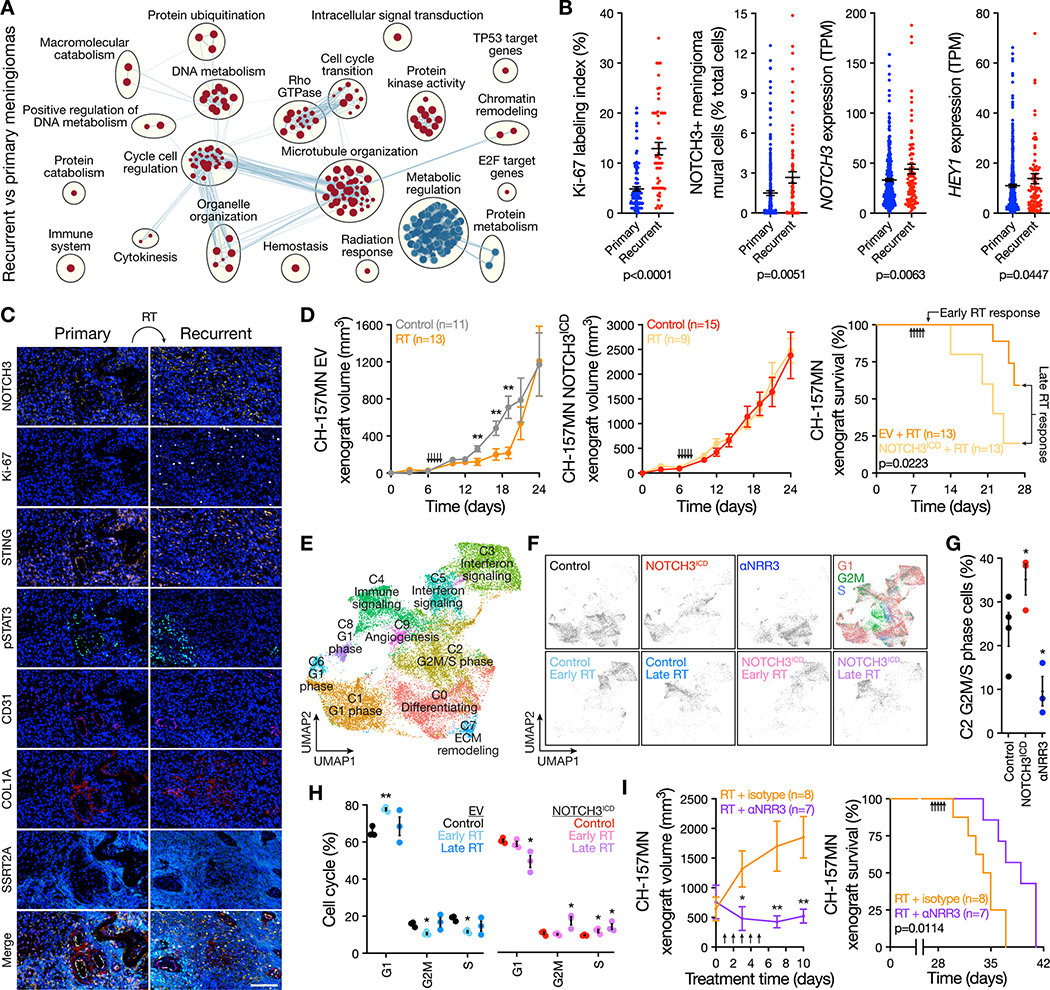
Meningiomas are the most common primary intracranial tumors. Treatments for patients with meningiomas are limited to surgery and radiotherapy, and systemic therapies remain ineffective or experimental. Resistance to radiotherapy is common in high-grade meningiomas and the cell types and signaling mechanisms that drive meningioma tumorigenesis and resistance to radiotherapy are incompletely understood. Here, we report that NOTCH3 drives meningioma tumorigenesis and resistance to radiotherapy and find that perivascular NOTCH3+ stem cells are conserved across meningiomas from humans, dogs, and mice. Integrating single-cell transcriptomics with lineage tracing and imaging approaches in genetically engineered mouse models and xenografts, we show NOTCH3 drives tumor-initiating capacity, cell proliferation, angiogenesis, and resistance to radiotherapy to increase meningioma growth and reduce survival. To translate these findings to patients, we show that an antibody stabilizing the extracellular negative regulatory region of NOTCH3 blocks meningioma tumorigenesis and sensitizes meningiomas to radiotherapy, reducing tumor growth and improving survival. Significance: There are no effective systemic therapies to treat meningiomas, and meningioma stem cells are poorly understood. Here, we report perivascular NOTCH3+ stem cells to drive meningioma tumorigenesis and resistance to radiotherapy. Our results identify a conserved mechanism and a therapeutic vulnerability to treat meningiomas that are resistant to standard interventions.


Conflict of interest statement

Conflict of interests statement

AA is a co-founder of Tango Therapeutics, Azkarra Therapeutics, Ovibio Corporation, and Kytarro; a member of the board of Cytomx and Cambridge Science Corporation; a member of the scientific advisory board of Genentech, GLAdiator, Circle, Bluestar, Earli, Ambagon, Phoenix Molecular Designs, Yingli, ProRavel, Oric, Hap10, and Trial Library; a consultant for SPARC, ProLynx, Novartis, and GSK; receives research support from SPARC; and holds patents on the use of PARP inhibitors held jointly with AstraZeneca.

Figures

Figure 1.
Figure 1.
NOTCH3 is enriched in meningioma mural cells and is expressed throughout high-grade meningiomas. A, Single-cell RNA sequencing UMAP of 30,934 transcriptomes from human meningioma samples with loss of chromosome 22q showing tumor cell states and microenvironment cell types. B, UMAP showing single-cell RNA sequencing of human meningiomas shaded by chromosome 22q status. C, Dot plot showing expression of NOTCH receptors (NOTCH1, NOTCH2, NOTCH3, NOTCH3), NOTCH ligands (JAG1, JAG2, DLL1, DLL3, DLL4, DLK2, FN1), mural cell markers (PDGFRB, RGS5, CSPG4, ACTA2, ABCC9, ANGPT2, GJA4, CD248, COL9A3, SDC2, CLU, SERPING1), cancer stem-cell marker (NOTCH3, THY1), cell proliferation markers (MKI67, TOP2A, AURKB), and endothelial cells markers (ADM, PDGFD, CD34, VWF, CLDN5, PECAM1, KDR, FLT1, PRCP, MFSD2A, CXCL12, TIE1) across meningioma mural (C7, C11, C12) or endothelial cells (C8) from A. D, Inference of NOTCH signaling network in human meningiomas using single-cell RNA sequencing cell-cell communication analysis. E, Single-cell RNA sequencing UMAP of 40,525 dog meningioma transcriptomes showing tumor cell states and microenvironment cell types. F, Transcriptomic concordance of human meningioma single-cell cluster identities from A projected on single-cell RNA sequencing UMAP of 40,525 transcriptomes from dog meningioma samples showing NOTCH3+ meningioma mural cells and proliferating meningioma cells are conserved across human and dog meningiomas. G, IHC for NOTCH3 across histological grades of human (top) or dog (bottom) meningiomas. Representative of n=10 meningiomas per grade. Scale bars, 100μm. H, IF for NOTCH3 and the mural cell marker SMA across histological grades of human meningiomas. DAPI marks DNA. Representative of n=10 meningiomas per grade. Scale bars, 10μm. I, Quantification of NOTCH3 or the NOTCH3 target gene HEY1 across meningioma grades using RNA sequencing of n=502 human meningiomas. TPM, transcripts per million. Lines represent means and error bars represent standard error of means. ANOVA.
Figure 2.
Figure 2.
NOTCH3+ mural cells underly meningeal hyperproliferation. A, IHC for NOTCH3 in the adult human meninges showing expression is restricted to mural cells. Representative of n=3 biological replicates. Scale bars, 100μm and 10μm (insert). B, IF for NOTCH3 and the mural cell marker SMA in 3 adult human meningeal samples showing NOTCH3 is expressed in mural cells adjacent to smooth muscle cells in the meninges. DAPI marks DNA. Scale bar, 10μm. C, Experimental design for in vivo lineage tracing of NOTCH3+ mural cells during meningeal development (in utero recombination) or homeostasis (postnatal recombination). TAM, tamoxifen. D, Confocal microscopy of whole mount mouse convexity meningeal samples at P7, P30, or P90 after in utero recombination of the ROSAmT/mG allele showing NOTCH3 cells (green) are restricted to the perivascular niche during meningeal development. Representative of n=3 biological replicates per timepoint. DAPI marks DNA. Scale bar, 10μm. E, Confocal microscopy of whole mount mouse convexity meningeal samples at P30 or P90 after postnatal recombination of the ROSAmT/mG allele showing NOTCH3+ cells (green) are restricted to the perivascular niche during meningeal homeostasis. Representative of n=3 biological replicates per timepoint. DAPI marks DNA. Scale bar, 10μm. F, Experimental design for in vivo biallelic inactivation of Nf2 in NOTCH3+ cells during meningeal development (E16.5) or homeostasis (P30). Mice were monitored for 1 year after Nf2 inactivation. G, Coronal H&E images of 300μm decalcified mouse skull sections 1 year after postnatal (P30) treatment of mice with TAM. No gross tumors were identified, but insets show Nf2 inactivation in NOTCH3+ cells is associated with meningeal hyperproliferation. The same results were obtained after in utero (E16.5) treatment with TAM. Representative of n=5–8 biological replicates per condition. Scale bars 1mm.
Figure 3.
Figure 3.
NOTCH3 signaling drives meningioma tumor initiating capacity, cell proliferation, and angiogenesis. A, Deconvolution of NOTCH3+ meningioma mural cells from Fig. 1A using human meningiomas with paired RNA sequencing and DNA methylation profiling (n=502). ANOVA. B, Immunoblots showing NOTCH3 is expressed in CH-157MN and IOMM-Lee Immune-enriched meningioma cells but is suppressed in BenMen Hypermitotic meningioma cells. C, In vivo tumor initiating capacity of CH-157MN meningioma cells in NU/NU mice ± αNRR3 IP injection 2 times per week. Denominators indicate number of mice at each time point. Numerators indicate number of mice with tumors at each time point. D, QPCR for the NOTCH3 target gene HEY1 from meningioma xenografts ± αNRR3 treatment for 2 weeks. Student’s t test. E, IHC for Ki-67 in meningioma xenografts showing αNRR3 blocks meningioma cell proliferation. Representative of n=3 xenografts per condition. Scale bar, 100μm. F, CH-157MN meningioma xenograft growth (left, student’s t tests) or survival (log-rank test). Arrows indicate initiation of bi-weekly treatment with the indicated therapy, which continued until death. G, IOMM-Lee meningioma xenograft growth (left, student’s t tests) or survival (log-rank test). Arrows as in F. H, QPCR for NOTCH3 or HEY1 in CH-157MN meningioma cells ± stable expression of empty vector (EV) or NOTCH3ICD. Student’s t tests. I, IF quantification of the stem cell marker PTPRZ1 in CH-157MN meningioma cells. Student’s t test. J, Clonogenic in vitro growth of CH-157MN meningioma cells after 2 weeks. Student’s t test. K, In vivo tumor initiating capacity of CH-157MN meningioma cells ± EV or NOTCH3ICD over limiting dilutions. Numerator and denominator as in C. L, CH-157MN meningioma xenograft growth (left, student’s t tests) or survival (log-rank test). M, Images of heterotopic meningioma xenografts showing macroscopic necrosis and ulceration in EV meningiomas. Representative of n=7–9 xenografts per condition. N, H&E low and high (box) magnification images of meningioma xenografts showing microscopic necrosis in EV meningiomas. Representative of n=3 xenografts per condition. Scale bars, 100μm. O, IHC for endothelia markers in meningioma xenografts showing NOTCH3ICD induces meningioma angiogenesis. Representative of n=3 xenografts per condition. Scale bars, 100μm. Lines represent means and error bars represent standard error of means. **p≤0.01, ***p≤0.0001.
Figure 4.
Figure 4.
NOTCH3 signaling drives meningioma resistance to radiotherapy. A, Network of gene circuits distinguishing recurrent (n=99) from primary (n=403) human meningiomas using RNA sequencing. Nodes represent pathways and edges represent shared genes between pathways (p≤0.01, FDR≤0.01). Red nodes are enriched and blue nodes are suppressed in recurrent versus primary meningiomas. B, IHC for Ki-67 in recurrent (n=53) versus primary (n=123) meningiomas, or RNA sequencing of recurrent (n=99) versus primary (n=403) meningiomas for deconvolution of NOTCH3+ meningioma mural cells from Fig. 1A or quantification of NOTCH3 or HEY1 expression. TPM, transcripts per million. ANOVA. C, Multiplexed seqIF microscopy showing human meningioma recurrence after radiotherapy (RT) is associated with increased NOTCH3 and Ki-67. Many NOTCH3+ cells also express the interferon and innate immune regulators STING and pSTAT3. CD31 marks pericytes, COL1A marks fibroblasts, SSTR2A marks meningioma cells, and DAPI marks DNA. Representative of n=4 pairs of patient-matched primary and recurrent meningiomas. Scale bar, 100μm. D, CH-157MN meningioma xenograft growth (left and middle, student’s t tests) or survival (log-rank test) after expression of empty vector (EV) or NOTCH3ICD ± RT showing NOTCH3 drives resistance to RT. Arrows indicate RT treatments (2Gy x 5 daily fractions). Xenografts from all arms were isolated for single-cell RNA-sequencing 1 day after completing RT (early) or once median survival was reached in the EV + RT arm (late). E, Single-cell RNA sequencing UMAP of 152,464 meningioma xenograft human cell transcriptomes showing tumor cell states ± αNRR3 treatment for 2 weeks as in Fig. 3F or ± NOTCH3ICD ± RT as in D. F, UMAP showing single-cell RNA sequencing of meningioma xenograft human cells shaded by experimental condition or phase of the cell cycle. G, Analysis of C2 G2M/S phase meningioma xenograft human cells in control versus NOTCH3ICD versus αNRR3 conditions showing NOTCH3 drives meningioma cell proliferation. Colors as in F. Student’s t tests. H, Cell cycle analysis across all clusters of meningioma xenograft human cells ± NOTCH3ICD ± RT showing NOTCH3 sustains cell proliferation through G2M and S phase despite RT. Student’s t test. I, Meningioma xenograft growth (left, student’s t tests) or survival (log-rank test) after treatment with RT as in D ± αNRR3 as in Fig. 3F. αNRR3 treatment was initiated on the first day of radiotherapy and continued until death. Lines represent means and error bars represent standard error of means. *p<0.05, **p≤0.01.

Update of

Similar articles

Cited by

References

    1. Louis DN, Perry A, Wesseling P, Brat DJ, Cree IA, Figarella-Branger D, et al. The 2021 WHO Classification of Tumors of the Central Nervous System: a summary. Neuro Oncol [Internet]. 2021;23:1231–51. Available from: http://eutils.ncbi.nlm.nih.gov/entrez/eutils/elink.fcgi?dbfrom=pubmed&id... - PMC - PubMed
    1. Ostrom QT, Price M, Neff C, Cioffi G, Waite KA, Kruchko C, et al. CBTRUS Statistical Report: Primary Brain and Other Central Nervous System Tumors Diagnosed in the United States in 2015–2019. Neuro-oncology. 2022;24:v1–95. - PMC - PubMed
    1. Goldbrunner R, Stavrinou P, Jenkinson MD, Sahm F, Mawrin C, Weber DC, et al. EANO guideline on the diagnosis and management of meningiomas. Neuro-oncology. 2021;23:1821–34. - PMC - PubMed
    1. Lin D, Lin J, Deng X, Li W, Li D, Yin B, et al. Trends in intracranial meningioma incidence in the United States, 2004–2015. Cancer Med-us. 2019;8:6458–67. - PMC - PubMed
    1. Simpson D The Recurrence of Intracranial Meningiomas After Surgical Treatment. J Neurosurg. 1957;58:51–56. Available from: http://books.google.com/books?id=YncCjwEACAAJ&dq=The+recurrence+of+intra... - PubMed

MeSH terms