. 2024 Aug;23(8):e14192.
doi: 10.1111/acel.14192. Epub 2024 May 14.

Age-related dysregulation of the retinal transcriptome in African turquoise killifish

Affiliations

Age-related dysregulation of the retinal transcriptome in African turquoise killifish

Steven Bergmans et al. Aging Cell. 2024 Aug.

Abstract

Age-related vision loss caused by retinal neurodegenerative pathologies is becoming more prevalent in our ageing society. To understand the physiological and molecular impact of ageing on retinal homeostasis, we used the short-lived African turquoise killifish, a model known to naturally develop central nervous system (CNS) ageing hallmarks and vision loss. Bulk and single-cell RNA-sequencing (scRNAseq) of three age groups (6-, 12-, and 18-week-old) identified transcriptional ageing fingerprints in the killifish retina, unveiling pathways also identified in the aged brain, including oxidative stress, gliosis, and inflammageing. These findings were comparable to observations in the ageing mouse retina. Additionally, transcriptional changes in genes related to retinal diseases, such as glaucoma and age-related macular degeneration, were observed. The cellular heterogeneity in the killifish retina was characterized, confirming the presence of all typical vertebrate retinal cell types. Data integration from age-matched samples between the bulk and scRNAseq experiments revealed a loss of cellular specificity in gene expression upon ageing, suggesting potential disruption in transcriptional homeostasis. Differential expression analysis within the identified cell types highlighted the role of glial/immune cells as important stress regulators during ageing. Our work emphasizes the value of the fast-ageing killifish in elucidating molecular signatures in age-associated retinal disease and vision decline. This study contributes to the understanding of how age-related changes in molecular pathways may impact CNS health, providing insights that may inform future therapeutic strategies for age-related pathologies.

Keywords: Nothobranchius furzeri; ageing; gliosis; inflammageing; neurodegeneration; oxidative stress; retina; transcriptomics.


Conflict of interest statement

The authors declare that they have read and approved the manuscript and have no conflicts of interest.

Figures

FIGURE 1
FIGURE 1
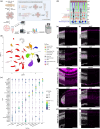
Killifish retinas have age‐related changes in gene expression. (a) Bulk RNAseq experimental setup. Created with BioRender.com. (b) Principal component analysis of 6 (young), 12 (middle‐aged) and 18 weeks of age (old) individual RNAseq samples showing age‐related variance in transcriptome across samples (n = 10). (c) Venn diagrams depicting up‐ (red) and down‐regulated (blue) genes between young, middle‐aged, and aged retinas. More upregulated genes than downregulated were identified with age. Differentially expressed genes were identified using following thresholding criteria: FDR ≤0.05 and |log2FC| ≥ 1. (d) Boxplots representing the age‐dependent fold change of transcript expression of mouse orthologs (Xu et al., 2022) to up, down, and unchanged sets of differentially expressed killifish genes. The killifish unchanged (grey) and upregulated (red) genes show a similar expression trend as in the ageing mouse retina. This is not observed for the downregulated genes (blue) (Wilcoxon rank‐sum test). FC, fold change; mo, months; ns, not significant; PC, principal component; RIN, RNA integrity number; RPE, retinal pigment epithelium; Unch, unchanged; w, weeks.
FIGURE 2
FIGURE 2
Aged killifish retinas show signs of gliosis, inflammageing, and neurodegeneration detected by bulk RNAseq. (a) Scatter plot showing mean expression of all genes detected by bulk RNAseq across 6 w and 18 w samples. The different colours denote genes that passed FDR and FC thresholds (FDR <0.05 and |log2FC| ≥ 1). Genes that are not significantly changed are shown in grey; upregulated genes are in red; downregulated genes in blue. ZC3HDC1L = optn, CU571169.1 = slc7a11. (b) Staining for Rlbp1 shows a visual increase in Rlbp1 protein expression in aged retinas, corresponding to increased transcript expression in RNAseq. (c) Immunostaining of glutamine synthetase shows expansion of Müller glia cell morphology in 18‐week‐old retinas compared to 6‐week‐old retinas. (d) in situ HCR for apoeb in 6‐ and 18‐week‐old retinas highlight an increase in immune cells with age as well as changes in their morphology (insets), signs of inflammageing. (e) Microglia/macrophage‐specific labelling by apoeb is confirmed by antibody co‐labelling with the pan‐leukocyte marker L‐plastin (arrowheads). Merged images with nuclei shown in left third of image; remaining image is without nuclei. Scale bars = 50 μm. FC, fold change; FDR, false discovery rate; GCL, ganglion cell layer; GS, glutamine synthetase; HCR, hybridisation chain reaction; INL, inner nuclear layer; ONL, outer nuclear layer; unch, unchanged; w, weeks.
FIGURE 3
FIGURE 3
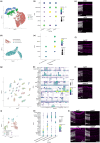
scRNAseq identifies neuronal and glial cell types within the killifish retina. (a) scRNAseq experimental setup. Created with BioRender.com. (b) UMAP dimension reduction of the retina scRNAseq dataset with clusters coloured by annotated retinal cell type. (c) Dot plot showing the specificity of marker genes within individual retinal cell types. The size of the dot represents the percentage of cells within the population expressing transcripts for the gene, while the colour indicates the average expression across individual cells. (d) Schematic representation of the cell types identified in the killifish retina and where they reside within the retinal architecture. Cell types are coloured‐coded to the UMAP in (b). Created with BioRender.com. (e–n) Spatial validation of cell type marker genes via in situ HCR confirms the identification for every retinal cell type. Merged images with nuclei shown in left third of image. Scale bars = 50 μm. GCL, ganglion cell layer; HCR, hybridisation chain reaction; ILM, inner limiting membrane; INL, inner nuclear layer; IPL, inner plexiform layer; NFL, nerve fibre layer; OLM, outer limiting membrane; ONL, outer nuclear layer; OPL, outer plexiform layer; PRL, photoreceptor layer; RBC, red blood cell; RPE, retinal pigment epithelium; UMAP, uniform manifold approximation and projection; w, weeks.
FIGURE 4
FIGURE 4
Validation of cell subtypes for specific killifish retinal populations. UMAP dimension reduction shows the subclustering of the photoreceptors (a), horizontal cells (d), bipolar cells (g), and amacrine cells (j). Cell type‐specific markers are shown as dot plots (b, e, h, k). Dot size shows the percentage of cells expressing the marker gene while the colour indicates the mean transcript expression. in situ HCRs of subtype markers for photoreceptors (c), horizontal cells (f), bipolar cells (i), and amacrine cells (l) distinguish specific retinal cell subtypes. A displaced starburst amacrine (chat+) is highlighted with an inset box and arrowhead (l). Merged images with nuclei shown in left third of image. Scale bars = 50 μm. GCL, ganglion cell layer; HCR, hybridisation chain reaction; INL, inner nuclear layer; ONL, outer nuclear layer; UMAP, uniform manifold approximation and projection.
FIGURE 5
FIGURE 5
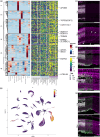
Killifish display age‐associated transcriptional dysregulation. (a) Heatmaps of data integrated from the bulk and scRNAseq. Genes that increase with age are typically expressed in a variety of retinal cell types, with roughly half of the transcripts displaying enriched expression within glial/immune cells (left). With age, the genes increase in expression across numerous cell types (right). Several genes of interest are highlighted. ZC2HDC1L = optn, CU571169.1 = slc7a11. (b) UMAP showing that the genes that increase with age are overall most highly expressed in Müller glia, immune cells, and oligodendrocytes. (c–e) Spatial validation of upregulated genes; total merge with nuclei shown in left third of image. (c) Transcript for the Müller glia enriched gene aqp1a.1 is detected in many cell types at 18 weeks by in situ HCR, including ganglion cells and photoreceptors. (d) Immunolabelling for Egfr and GS shows that Egfr is primarily in Müller glia in young retinas. In old retinas there is increased Egfr in the GCL and nerve fibre layer. Middle: Egfr + GS merge without nuclei; right: Egfr only. (e) Antibody labelling for Tgfb3 and GS shows that Tgfb3 protein is restricted to Müller glia in young retinas but appears more globally expressed in old retinas. Middle: Tgfb3 + GS without nuclei; right: Tgfb3 only. Scale bars = 50 μm. GCL, ganglion cell layer; GS, glutamine synthetase; HCR, hybridisation chain reaction; INL, inner nuclear layer; ONL, outer nuclear layer; RBCs, red blood cells; RPE, retinal pigment epithelium; UMAP, uniform manifold approximation and projection; w, weeks.

Update of

References

    1. Ahmed, Z. M. , Riazuddin, S. , Bernstein, S. L. , Ahmed, Z. , Khan, S. , Griffith, A. J. , Morell, R. J. , Friedman, T. B. , Riazuddin, S. , & Wilcox, E. R. (2001). Mutations of the protocadherin gene PCDH15 cause usher syndrome type 1F. American Journal of Human Genetics, 69, 25–34. 10.1086/321277 - DOI - PMC - PubMed
    1. Aleksander, S. A. , Balhoff, J. , Carbon, S. , Cherry, J. M. , Drabkin, H. J. , Ebert, D. , Feuermann, M. , Gaudet, P. , Harris, N. L. , Hill, D. P. , Lee, R. , Mi, H. , Moxon, S. , Mungall, C. J. , Muruganugan, A. , Mushayahama, T. , Sternberg, P. W. , Thomas, P. D. , Van Auken, K. , et al. (2023). The gene ontology knowledgebase in 2023. Genetics, 224, iyad031. 10.1093/genetics/iyad031 - DOI - PMC - PubMed
    1. Altschul, S. F. , Gish, W. , Miller, W. , Myers, E. W. , & Lipman, D. J. (1990). Basic local alignment search tool. Journal of Molecular Biology, 215, 403–410. 10.1016/S0022-2836(05)80360-2 - DOI - PubMed
    1. Anders, S. , Pyl, P. T. , & Huber, W. (2015). HTSeq‐A python framework to work with high‐throughput sequencing data. Bioinformatics, 31, 166–169. 10.1093/bioinformatics/btu638 - DOI - PMC - PubMed
    1. Ashburner, M. , Ball, C. A. , Blake, J. A. , Botstein, D. , Butler, H. , Cherry, J. M. , Davis, A. P. , Dolinski, K. , Dwight, S. S. , Eppig, J. T. , Harris, M. A. , Hill, D. P. , Issel‐Tarver, L. , Kasarskis, A. , Lewis, S. , Matese, J. C. , Richardson, J. E. , Ringwald, M. , Rubin, G. M. , & Sherlock, G. (2000). Gene ontology: Tool for the unification of biology. Nature Genetics, 25, 25–29. 10.1038/75556 - DOI - PMC - PubMed

Supplementary concepts