. 2024 Aug;67(8):1642-1662.
doi: 10.1007/s00125-024-06163-y. Epub 2024 May 14.

RFX6 haploinsufficiency predisposes to diabetes through impaired beta cell function

Affiliations

RFX6 haploinsufficiency predisposes to diabetes through impaired beta cell function

Hazem Ibrahim et al. Diabetologia. 2024 Aug.

Abstract

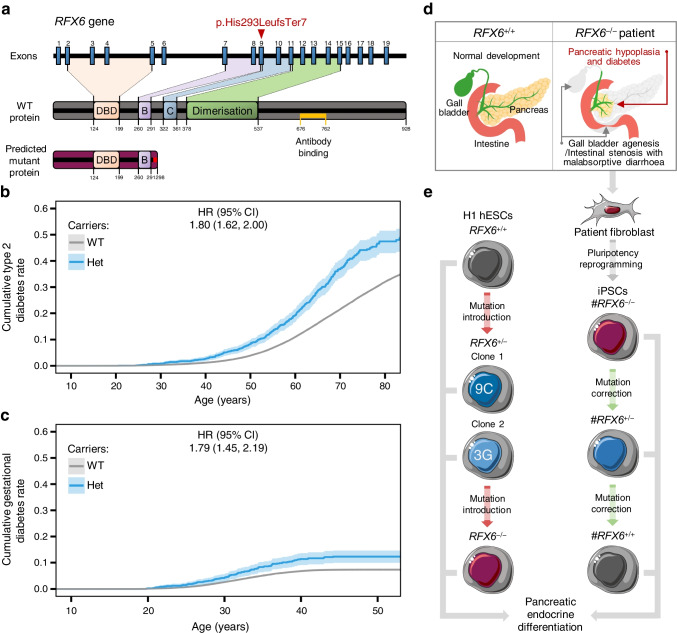
Aims/hypothesis: Regulatory factor X 6 (RFX6) is crucial for pancreatic endocrine development and differentiation. The RFX6 variant p.His293LeufsTer7 is significantly enriched in the Finnish population, with almost 1:250 individuals as a carrier. Importantly, the FinnGen study indicates a high predisposition for heterozygous carriers to develop type 2 and gestational diabetes. However, the precise mechanism of this predisposition remains unknown.

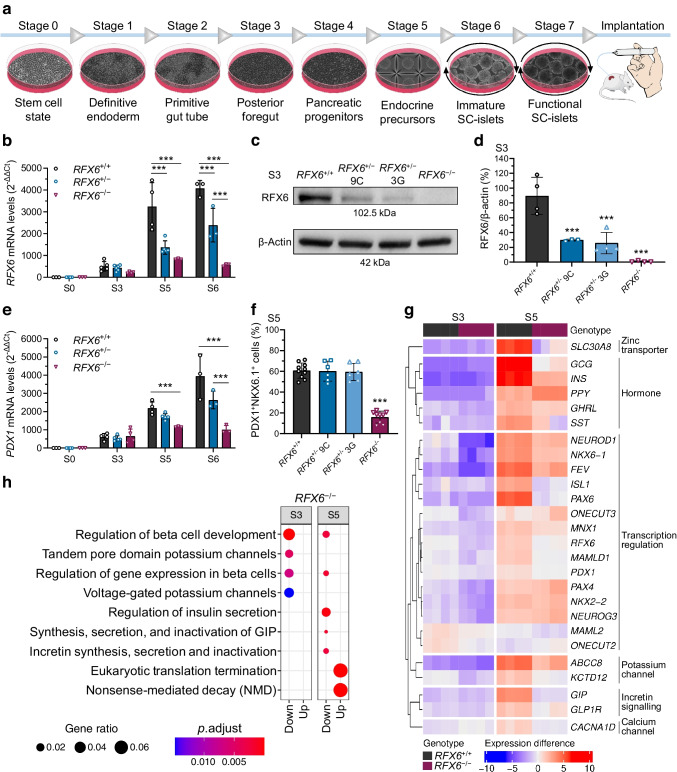
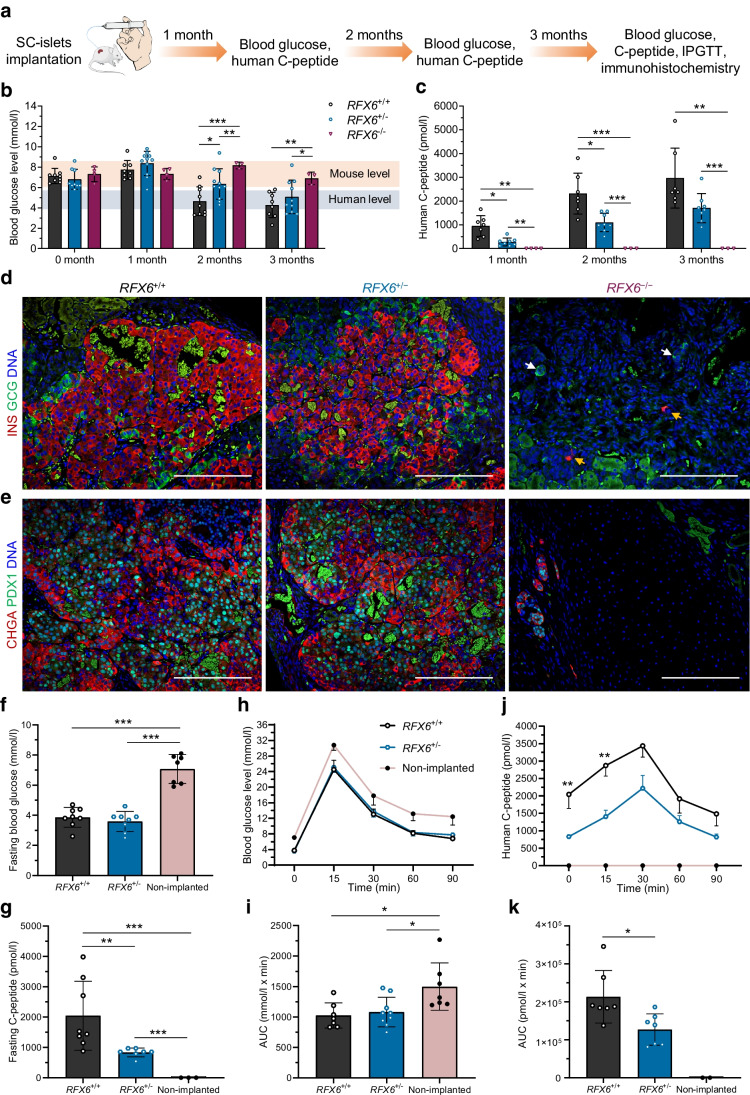
Methods: To understand the role of this variant in beta cell development and function, we used CRISPR technology to generate allelic series of pluripotent stem cells. We created two isogenic stem cell models: a human embryonic stem cell model; and a patient-derived stem cell model. Both were differentiated into pancreatic islet lineages (stem-cell-derived islets, SC-islets), followed by implantation in immunocompromised NOD-SCID-Gamma mice.

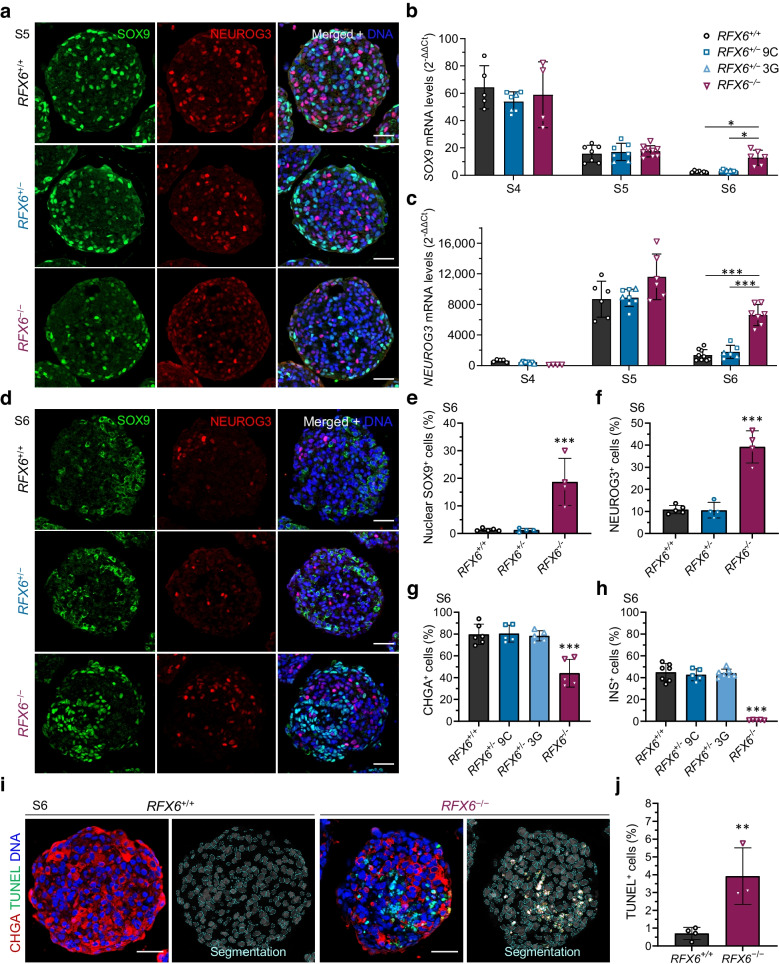
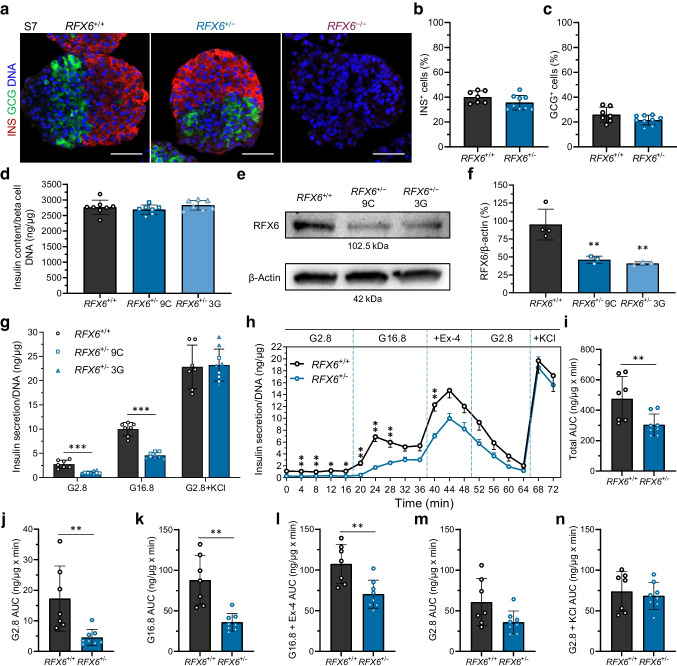
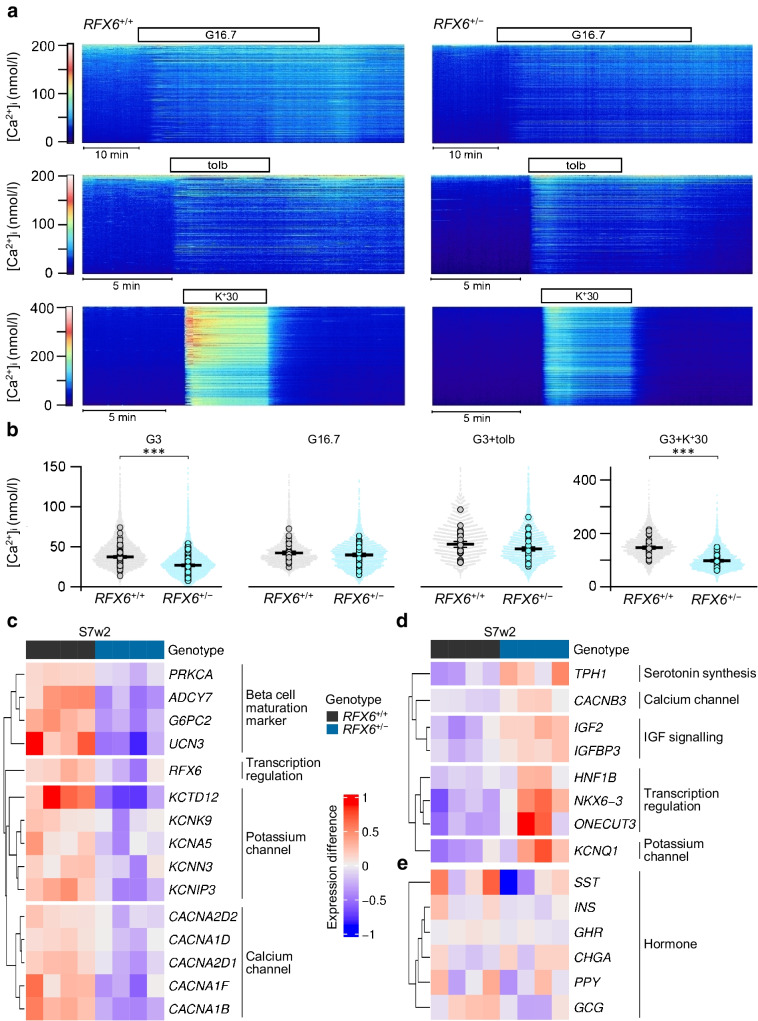
Results: Stem cell models of the homozygous variant RFX6-/- predictably failed to generate insulin-secreting pancreatic beta cells, mirroring the phenotype observed in Mitchell-Riley syndrome. Notably, at the pancreatic endocrine stage, there was an upregulation of precursor markers NEUROG3 and SOX9, accompanied by increased apoptosis. Intriguingly, heterozygous RFX6+/- SC-islets exhibited RFX6 haploinsufficiency (54.2% reduction in protein expression), associated with reduced beta cell maturation markers, altered calcium signalling and impaired insulin secretion (62% and 54% reduction in basal and high glucose conditions, respectively). However, RFX6 haploinsufficiency did not have an impact on beta cell number or insulin content. The reduced insulin secretion persisted after in vivo implantation in mice, aligning with the increased risk of variant carriers to develop diabetes.

Conclusions/interpretation: Our allelic series isogenic SC-islet models represent a powerful tool to elucidate specific aetiologies of diabetes in humans, enabling the sensitive detection of aberrations in both beta cell development and function. We highlight the critical role of RFX6 in augmenting and maintaining the pancreatic progenitor pool, with an endocrine roadblock and increased cell death upon its loss. We demonstrate that RFX6 haploinsufficiency does not affect beta cell number or insulin content but does impair function, predisposing heterozygous carriers of loss-of-function variants to diabetes.

Data availability: Ultra-deep bulk RNA-seq data for pancreatic differentiation stages 3, 5 and 7 of H1 RFX6 genotypes are deposited in the Gene Expression Omnibus database with accession code GSE234289. Original western blot images are deposited at Mendeley ( https://data.mendeley.com/datasets/g75drr3mgw/2 ).

Keywords: Beta cells; Glucose-stimulated insulin secretion; Isogenic allelic series models; Monogenic diabetes; Stem-cell-derived islets; Type 2 diabetes.


Figures

Fig. 1
Fig. 1
Impact of heterozygous and homozygous RFX6 frameshift variant p.His293LeufsTer7 on diabetes development. (a) The human RFX6 gene and the encoded WT and predicted mutant proteins. The WT RFX6 is a 928-amino-acid protein containing a DNA binding domain (DBD) and three dimerisation domains (B, C and Dimerisation). The RFX6 frameshift variant p.His293LeufsTer7 contains the DBD, dimerisation domain B and a frameshift making an early stop codon at 298. The antibody used in this study binds to the amino acid sequence from 676–762 (shown in yellow). (b) Survival curve stratified by RFX6 genotype (WT, n=439,416 and Het; heterozygous carriers, n=1318) and adjusted HR for type 2 diabetes risk. The mean ± SD age at onset for Het and WT was 57.48±12.87 and 59.91±12.43 years, respectively (p=2.5×10⁻⁴). The total number of individuals in the FinnGen dataset was 440,734, which included 71,728 with type 2 diabetes. (c) Survival curve stratified by RFX6 genotype (WT, n=253,803 and Het; heterozygous carriers, n=814) and adjusted HR for gestational diabetes risk. The total number of individuals in the FinnGen dataset was 254,617, which included 16,802 with gestational diabetes. (d) Schematic showing the patient with Mitchell–Riley syndrome’s clinical manifestations (pancreatic hypoplasia with neonatal diabetes, gall bladder agenesis and intestinal stenosis with malabsorptive diarrhoea). (e) Schematic of generating RFX6 allelic series of the frameshift variant in H1 hESCs and patient-derived iPSCs, followed by directed differentiation into pancreatic endocrine cells. Panel (e) was created using Servier Medical Art. Survival plots (b, c) were generated using survminer and adjusted HRs were calculated using Cox proportional hazards model adjusting for age, sex and principal components PC1–PC10
Fig. 2
Fig. 2
RFX6 controls the transcriptional network of pancreatic development. (a) Schematic of H1 SC-islet differentiation protocol. Stages 1–4 in monolayer, stage 5 in microwells and stages 6–7 in suspension culture, followed by implantation under kidney capsule of NSG mice. (b) Relative gene expression levels of RFX6 at stage 0 (S0), S3, S5 and S6 (n=3–5). (c) Protein immunoblots of RFX6 and β-actin for the isogenic H1 clones (9C and 3G) at S3. (d) Percentage of RFX6 protein band densitometry normalised to β-actin bands, quantified from (c) (n=3 or 4). (e) Relative gene expression levels of PDX1 at S0, S3, S5 and S6 (n=3–5). (f) Percentage of PDX1+ and NKX6.1+ cells at S5 measured by flow cytometry (n=6–10). (g) Heatmap showing the relative differences in gene expression of RFX6+/+ and RFX6/ at S3 and S5 (n=4). Using log1p transformed normalised read count, with sample specific expression subtracted from gene averages. Each gene is differentially expressed in one or both of the stages, FDR<0.01. (h) Enrichment analysis of the differentially expressed genes between RFX6+/+ and RFX6/ at S3 and S5. The upregulated and downregulated genes (FDR<0.01) were analysed for enrichment against the Reactome database separately for S3 and S5 comparisons. Statistical significance was measured using two-way ANOVA with Tukey’s test for multiple comparisons correction in (b, e), and one-way ANOVA with Tukey’s test for multiple comparisons correction in (d, f). Data are presented as means ± SD; ***p<0.001
Fig. 3
Fig. 3
Persistent expression of SOX9 and NEUROG3 in homozygous RFX6/ cells and increased apoptosis. (a) Immunohistochemistry showing SOX9+ and NEUROG3+ cells at stage 5 (S5). Scale bar, 50 µm. (b, c) Relative gene expression levels of SOX9 (b) and NEUROG3 (c), comparing all the cell lines at S4, S5 and S6 (n=4–9). (d) Immunohistochemistry for SOX9+ and NEUROG3+ cells at S6. Scale bar, 50 µm. (e, f) Percentages of SOX9+ (e) and NEUROG3+ cells (f) at S6 quantified from (d) (n=4–5). (g, h) Percentage of CHGA+ (g) and insulin (INS)+ cells (h) at S6 quantified by flow cytometry (n=5–7). (i) Immunohistochemistry showing TUNEL+ and CHGA+ cells for the RFX6+/+ and RFX6/ clones at S6. Scale bar, 50 µm. (j) Percentage of TUNEL+ cells at S6 quantified from (i) (n=3–4). Statistical significance was measured using two-way ANOVA with Tukey’s test for multiple comparisons correction in (b, c), one-way ANOVA with Tukey’s test for multiple comparisons correction in (eh) and two-tailed unpaired t test in (j). Data are presented as means ± SD; *p<0.05, **p<0.01, ***p<0.001
Fig. 4
Fig. 4
RFX6 haploinsufficiency impairs insulin secretion of beta cells. (a) Immunohistochemistry showing insulin-positive (INS+) and glucagon-positive (GCG+) cells for RFX6+/+ and RFX6+/− SC-islets at stage 7 week 2 (S7w2), and for RFX6−/− at stage 7 day 2 (S7d2). Scale bar, 50 µm. (b, c) Percentage of INS+ (b) and GCG+ cells (c) for RFX6+/+ and RFX6+/− SC-islets at S7w2 measured by flow cytometry (n=7–9). (d) Insulin content of RFX6+/+ and RFX6+/− SC-islets at stage 7 week 3 (S7w3) normalised to the DNA content of beta cells (n=7 or 8). (e) Protein immunoblots of RFX6 and β-actin for RFX6+/+ and RFX6+/− SC-islets at S7w2. (f) Percentage of RFX6 protein bands densitometry normalised to β-actin bands, quantified from (e) (n=3 or 4). (g) Static insulin secretion at S7w3 at low 2.8 mmol/l glucose (G2.8), followed by high 16.8 mmol/l glucose (G16.8) and then depolarisation with G2.8+30 mmol/l KCl, normalised to the DNA content of the SC-islets (n=7–9). (h) Dynamic insulin secretion responses to perifusion (4 min intervals) with G2.8, G16.8, G16.8+12 nmol/l exendin-4 (Ex-4) and G2.8+30 mmol/l KCl, normalised to the DNA content of the SC-islets (n=7 or 8). (i) Total AUC, quantified from (h) (n=7 or 8). (jn) AUC for individual phases, quantified from (h) (n=7 or 8). Statistical significance was measured using unpaired t test in (b, c, in), using one-way ANOVA with Tukey’s test for multiple comparisons correction in (d, f) and using two-tailed unpaired multiple t tests in (g, h). Data are presented as means ± SD; *p<0.05, **p<0.01, ***p<0.001
Fig. 5
Fig. 5
Reduced [Ca2+]i in basal and depolarised conditions in RFX6+/− SC-islets. (a) Heatmaps of [Ca2+]i recorded with Fura-2 LR in cells within SC-islets under basal conditions of 3 mmol/l glucose (G3) and after stimulation with 16.7 mmol/l glucose (G16.7), G3+1 mmol/l tolbutamide (tolb) and G3+30 mmol/l K+ (K+30). Each heatmap shows the responses of all cells in one islet. (b) Quantification of [Ca2+]i responses from experiments as in (a). Time-averaged [Ca2+]i for all individual cells (dots) and average values for all cells in each islet (circles). The bars represent means ± SEM for the averaged islet responses. n=no. of islets (total cell number in parenthesis): G3 WT, n=65 (6933); G3 RFX6+/−, n=75 (8502); G16.7 WT, n=29 (3203); G16.7 RFX6+/−, n=42 (4853); tolb WT, n=23 (2720); tolb RFX6+/−, n=39 (4692); K+30 WT n=32 (3639); and K+30 RFX6+/−, n=37 (4320). Statistical analyses with Student’s unpaired two-tailed t test, ***p<0.001. (c) Heatmap of downregulated genes in RFX6+/− SC-islets at stage 7 week 2 (S7w2). Statistically significant genes (ADCY7, G6PC2, UCN3, KCTD12, KCNIP3 and CACNA1B), FDR<0.01 (n=4). (d) Heatmap of upregulated genes in RFX6+/− SC-islets at S7w2. All genes except IGFBP3 are statistically significant, FDR<0.01 (n=4). (e) Heatmap of hormone gene expression in RFX6+/+ and RFX6+/− SC-islets at S7w2. None of the genes show statistically significant differences (n=4). Heatmaps (ce) show log1p transformed normalised read count, with sample-specific expression subtracted from gene averages
Fig. 6
Fig. 6
Heterozygous RFX6+/− beta cells present lower insulin secretion in vivo. (a) Schematic showing the data points and sampling post implantation of SC-islets under the kidney capsule of NSG mice. (b) Random blood glucose levels measured monthly post implantation (n=3–11). (c) Random human C-peptide levels measured monthly post implantation (n=3–8). (d) Immunohistochemistry showing insulin-positive (INS+) and glucagon-positive (GCG+) cells at month 3 post implantation. In RFX6−/− cells, yellow arrows point to INS+ and white arrows point to GCG+. Scale bar, 200 µm. (e) Immunohistochemistry showing CHGA+ and PDX1+ cells at month 3 post implantation. Scale bar, 200 µm. (f) Fasting blood glucose levels measured at month 3 post implantation (n=7 or 8). (g) Fasting human C-peptide levels measured at month 3 post implantation (n=3–8). (h) Blood glucose levels during an IPGTT of fasted mice at month 3 post implantation (n=7–9). (i) AUC quantified from (h) (n=7–9). (j) Human C-peptide during an IPGTT of fasted mice at month 3 post implantation (n=2–7). (k) AUC quantified from (j) (n=2–7). Statistical significance was measured using two-way ANOVA with Tukey’s test for multiple comparisons correction in (b, c), one-way ANOVA with Tukey’s test for multiple comparisons correction in (fi) and two-tailed unpaired t test between RFX6+/+ and RFX6+/− in (j, k). Data are presented as means ± SD, except for (h, j) showing mean ± SEM; *p<0.05, **p<0.01, ***p<0.001

References

    1. Fuchsberger C, Flannick J, Teslovich TM et al (2016) The genetic architecture of type 2 diabetes. Nature 536(7614):41–47. 10.1038/nature18642 10.1038/nature18642 - DOI - PMC - PubMed
    1. Dimas AS, Lagou V, Barker A et al (2014) Impact of type 2 diabetes susceptibility variants on quantitative glycemic traits reveals mechanistic heterogeneity. Diabetes 63(6):2158–2171. 10.2337/db13-0949 10.2337/db13-0949 - DOI - PMC - PubMed
    1. Bonnefond A, Unnikrishnan R, Doria A et al (2023) Monogenic diabetes. Nat Rev Dis Primer 9(1):12. 10.1038/s41572-023-00421-w10.1038/s41572-023-00421-w - DOI - PubMed
    1. Aftab S, Semenec L, Chu JS-C, Chen N (2008) Identification and characterization of novel human tissue-specific RFX transcription factors. BMC Evol Biol 8(1):226. 10.1186/1471-2148-8-226 10.1186/1471-2148-8-226 - DOI - PMC - PubMed
    1. Sugiaman-Trapman D, Vitezic M, Jouhilahti E-M et al (2018) Characterization of the human RFX transcription factor family by regulatory and target gene analysis. BMC Genomics 19(1):181. 10.1186/s12864-018-4564-6 10.1186/s12864-018-4564-6 - DOI - PMC - PubMed

MeSH terms

Substances