. 2024 May 14;134(13):e174500.
doi: 10.1172/JCI174500.

Arteriovenous metabolomics in pigs reveals CFTR regulation of metabolism in multiple organs

Affiliations

Arteriovenous metabolomics in pigs reveals CFTR regulation of metabolism in multiple organs

Hosung Bae et al. J Clin Invest. .

Abstract

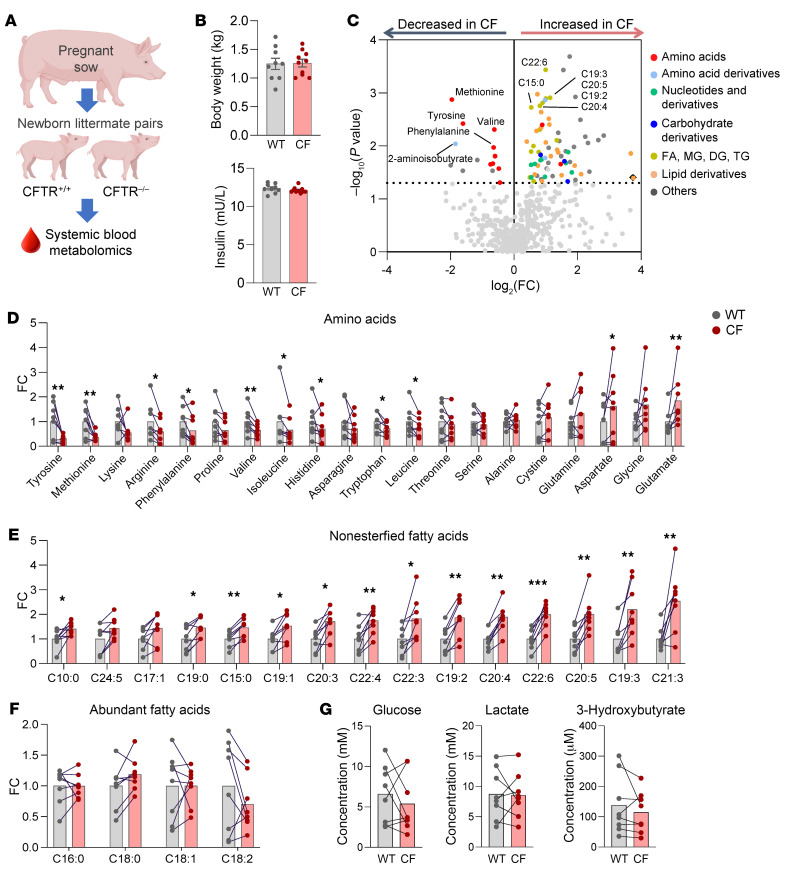
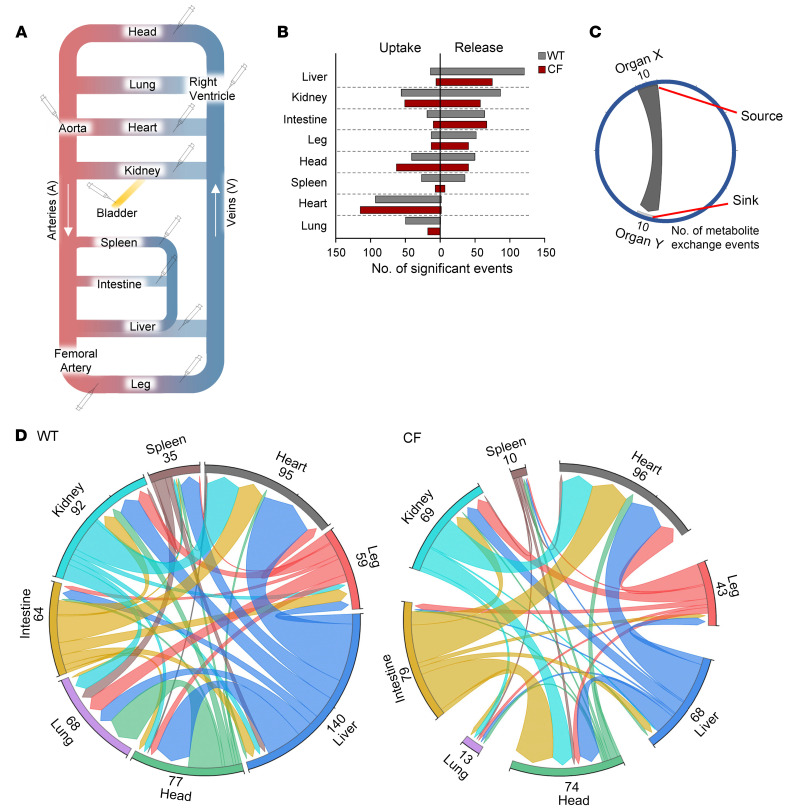
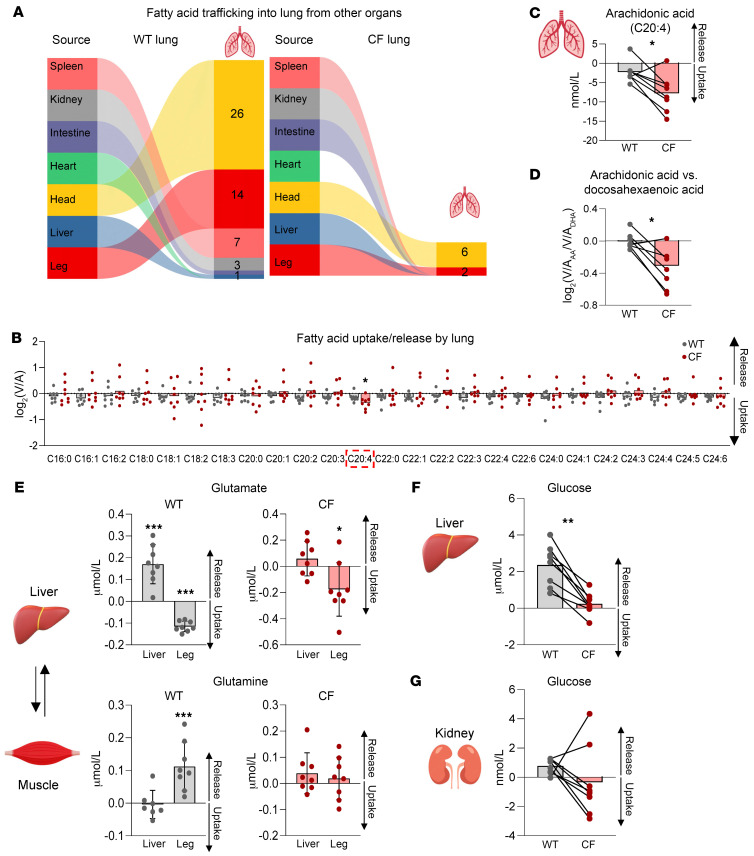
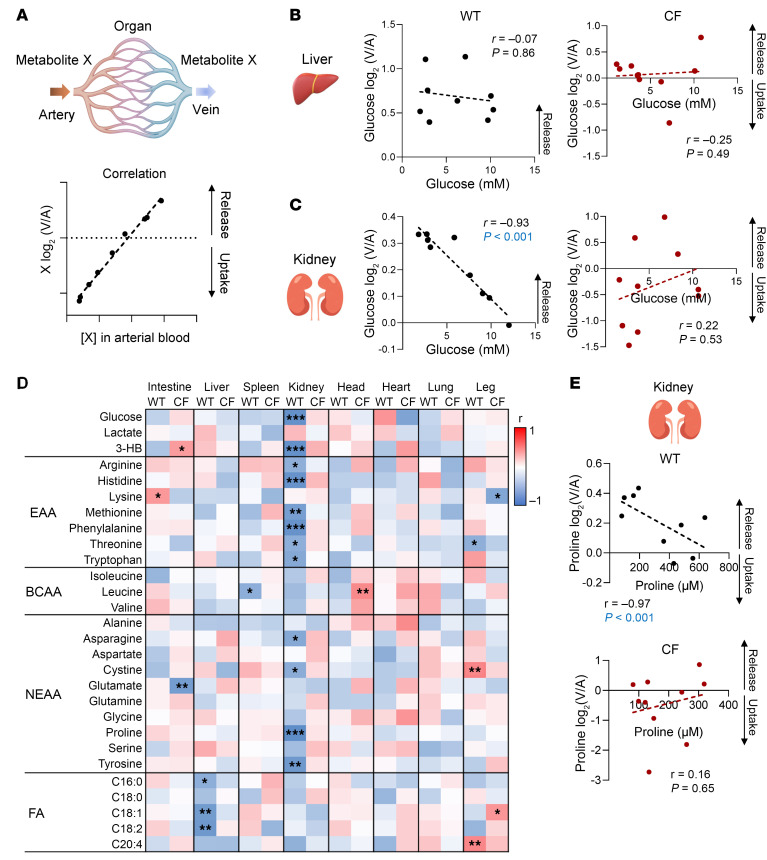
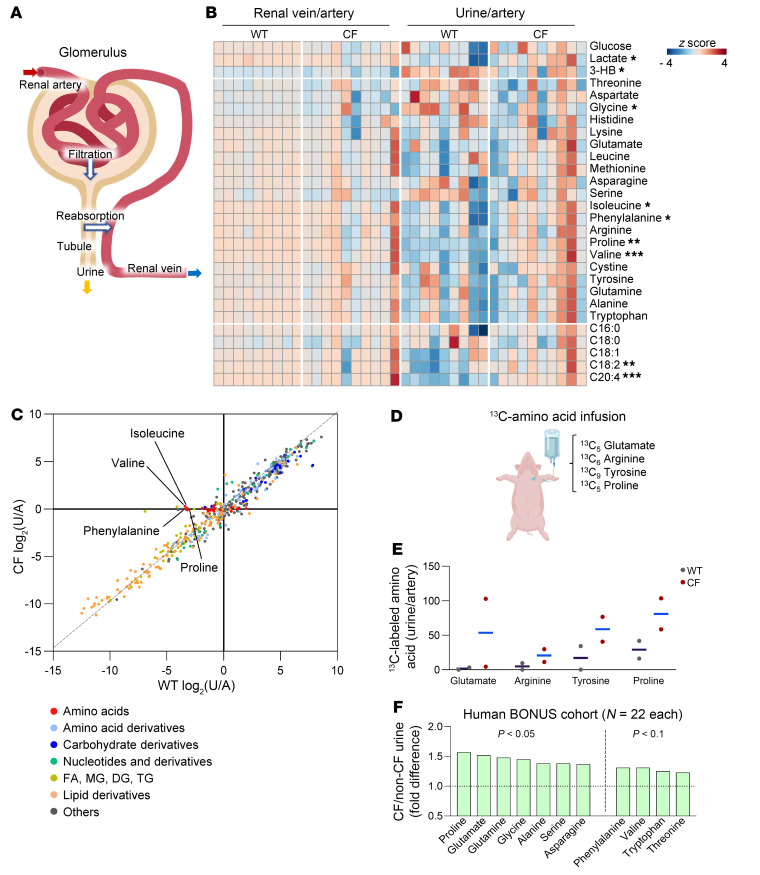
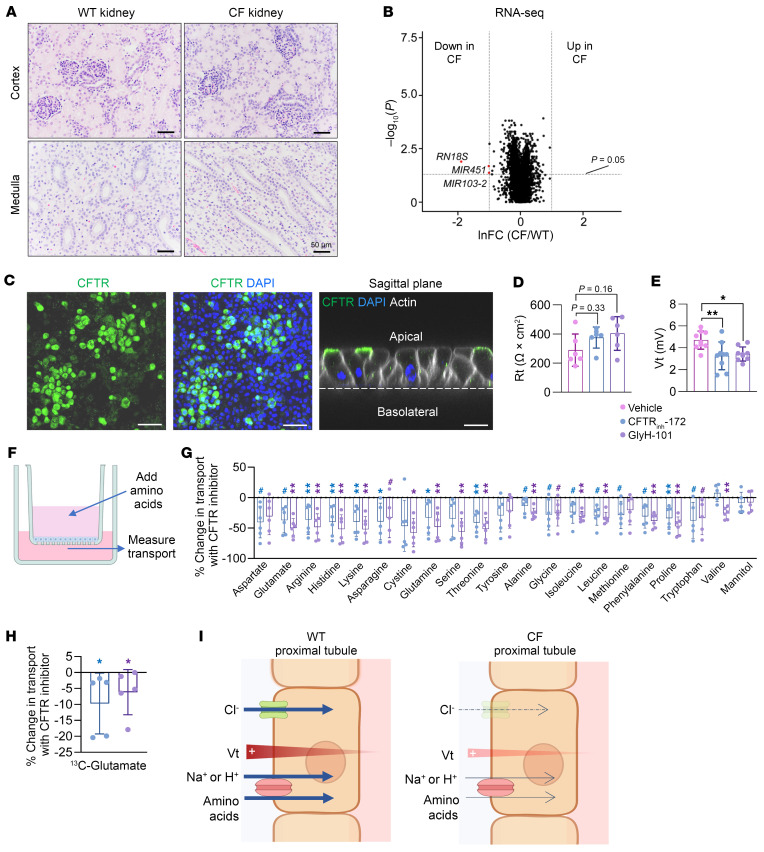
Mutations in the cystic fibrosis transmembrane conductance regulator (CFTR) gene cause cystic fibrosis (CF), a multiorgan disease that is characterized by diverse metabolic defects. However, other than specific CFTR mutations, the factors that influence disease progression and severity remain poorly understood. Aberrant metabolite levels have been reported, but whether CFTR loss itself or secondary abnormalities (infection, inflammation, malnutrition, and various treatments) drive metabolic defects is uncertain. Here, we implemented comprehensive arteriovenous metabolomics in newborn CF pigs, and the results revealed CFTR as a bona fide regulator of metabolism. CFTR loss impaired metabolite exchange across organs, including disruption of lung uptake of fatty acids, yet enhancement of uptake of arachidonic acid, a precursor of proinflammatory cytokines. CFTR loss also impaired kidney reabsorption of amino acids and lactate and abolished renal glucose homeostasis. These and additional unexpected metabolic defects prior to disease manifestations reveal a fundamental role for CFTR in controlling multiorgan metabolism. Such discovery informs a basic understanding of CF, provides a foundation for future investigation, and has implications for developing therapies targeting only a single tissue.

Keywords: Amino acid metabolism; Ion channels; Metabolism; Monogenic diseases.


Figures

Figure 1
Figure 1. The circulating metabolome differs between WT and CF newborn pigs.
(A) Experimental scheme for systemic blood metabolomics using LC-MS. (B) Body weights and fasting serum insulin levels (mU/L). n = 9 WT and n = 10 CF pigs. (C) Volcano plot indicating the difference of each circulating metabolite between WT and CF pigs (color coded to indicate various metabolite categories). Representative metabolites enriched in WT or CF are marked. Fatty acid (FA); monoglyceride (MG); diglyceride (DG); triglyceride (TG). (DG) Comparison of amino acids (D), fatty acids (E), and other abundant circulating metabolite (F and G) levels in blood between 8 WT and CF littermate pairs. *P < 0.05, **P < 0.01, and ***P < 0.001 relative to WT, by 2-tailed, paired Student’s t test for metabolites meeting normality or Wilcoxon signed-rank test for metabolites that do not meet normality (see Supplemental Table 1). Bars show the mean. FC, fold change (CF/WT).
Figure 2
Figure 2. CFTR loss impairs metabolism in multiple organs and interorgan metabolite exchange.
(A) Schematic of the circulatory system indicating blood and urine sampling sites. (B) For each organ in WT and CF pigs, metabolites showing significant release and uptake were identified using the 1-sample t test or Mann-Whitney U test (see Supplemental Table 2). (C) Schematic plotting the source and sink organs of circulating metabolites. The blunt end indicates source organ X, and the arrowed end indicates sink organ Y. Numbers indicate the number of metabolite exchange events that met statistical significance in both organs for each interorgan metabolite exchange. (D) Chord graphs indicating metabolite exchange between organs in WT and CF pigs. n = 9 WT and n = 10 CF pigs.
Figure 3
Figure 3. Quantitative analysis reveals altered metabolite trafficking in CF lungs, liver, and legs.
(A) Graphs indicating fatty acid trafficking into lungs from other organs. (B) log2(V/A) ratios of LCFAs in WT and CF lungs. n = 8 WT and n = 8 CF littermates. Error bars show the mean. Note that arachidonic acid (C20:4) uniquely shows greater uptake by CF lung compared with WT lung. *P < 0.05, by paired, 2-tailed Student’s t test. (C) Arachidonic acid (C20:4) trafficking. Bars show the mean for 8 WT and 8 CF littermates. *P < 0.05, by paired, 2-tailed Student’s t test. (D) Calculated ratio of lung uptake of arachidonic acid versus docosahexaenoic acid. Bars show the mean. *P < 0.05, by Wilcoxon signed-rank test. n = 8 WT and n = 8 CF littermates. (E) Glutamate and glutamine trafficking between the liver and leg. Bars show the mean ± SD for 8 WT and 8 CF littermates, except glutamine WT liver (n = 7). *P < 0.05 and ***P < 0.001, by 1-sample t test or Mann-Whitney U test (see also Supplemental Table 2). (F and G) Hepatic and renal glucose trafficking. Bars show the mean. n = 8 WT and n = 8 CF littermates. **P < 0.01, by Wilcoxon signed-rank test.
Figure 4
Figure 4. Loss of CFTR disrupts renal glucose and amino acid homeostasis.
(A) Schematic of correlation analysis of circulating metabolites between arterial concentration, [X], and tissue release/uptake activity [log2(V/A)]. For correlation analysis in the liver, the weighted average of portal and arterial blood concentration was used. (B and C) Correlations between blood glucose concentration and hepatic or renal release in WT and CF pigs. P values were calculated by Spearman’s correlation test. n = 9 WT and n = 10 CF pigs. (D) Heatmap showing correlations for 28 abundant metabolites across 8 organs. EAA, essential amino acids; BCAA, branched-chain amino acids; NEAA, nonessential amino acids. *P < 0.05, **P < 0.01, and ***P < 0.001, by Spearman’s correlation test. n = 9 WT and n = 10 CF pigs. (E) Correlations between arterial blood concentrations and kidney trafficking of proline in WT and CF pigs. P values were calculated by Spearman’s correlation test. n = 9 WT and n = 10 CF pigs.
Figure 5
Figure 5. CF kidney exhibits defective amino acid reabsorption.
(A) Schematic of renal filtration and reabsorption. Most metabolites are first filtered, and selected metabolites are then actively reabsorbed back into the systemic circulation. (B) Heatmap showing 28 metabolite abundance ratios of the renal vein relative to the artery and urine relative to the artery. Blue color in urine/artery indicates reabsorption, and red color indicates loss into urine. *P < 0.05, **P < 0.01, and ***P < 0.001 of CF urine/artery relative to WT, by 2-tailed Student’s t test or Mann-Whitney U test (see Supplemental Table 2). Urine data were normalized to urine creatinine levels. (C) Correlation between WT urine/artery and CF urine/artery for each circulating metabolite (color coded by categories). Examples of amino acids that are poorly reabsorbed in CF are labeled. (D) Schematic of stable isotope tracing in pigs. Pigs were intravenously infused with four 13C-labeled amino acid tracers. (E) 13C-labeled amino acid abundance in WT and CF urine samples. The ion counts of 13C-labeled amino acids in urine (normalized to urine creatinine) were normalized to the labeled amino acids in arterial blood. Data are individual points with the mean shown by a blue line. n = 2 WT and n = 2 CF littermates. (F) Fold difference in urine amino acids, normalized by urine osmolality, from 12-month-old children with CF (n = 22) relative to non-CF controls (n = 22). P values by Welch’s 2-sample t test. Data were adapted from BONUS (12).
Figure 6
Figure 6. Inhibition of CFTR in cultured human renal proximal tubule epithelia impairs amino acid absorption.
(A) H&E staining of newborn WT and CF pig kidneys. Scale bars: 50 μm. (B) Volcano plot showing differentially expressed genes in WT and CF pig kidneys. lnFC, fold change (CF/WT) in kidney tissues at the natural log scale. Dashed lines indicate the cutoffs: genes that were lower in CF with P < 0.05, by Mann-Whitney U test are highlighted in red. n = 12 WT and 11 CF pigs. Down, downregulated; Up, upregulated. (C) Immunofluorescence staining for CFTR (green) and actin (white) in DAPI-labeled human renal proximal tubule epithelial cells. Scale bars: 20 μm (left 2 panels) and 100 μm (right-most panel). (D and E) Rt and Vt in cells after addition of vehicle control or 2 CFTR inhibitors (CFTRinh-172 or GlyH-101). n = 6 per group for Rt and n = 9 per group for voltage. Bars show the mean ± SD. *P < 0.05 and **P < 0.01, by 1-way ANOVA. (F) Schematic of an assay to measure transepithelial transport of amino acids. (G and H) Percentage change in transepithelial transport of amino acids by CFTR inhibitors at 60 minutes after amino acid addition. Mannitol was used as a negative control. #P < 0.1, *P < 0.05, and **P < 0.01 for color-coded inhibitors relative to vehicle, by Mann-Whitney U test. Bars show the mean ± SD. n = 6 per group, except n = 5 for valine, asparagine, tryptophan, mannitol, and 13C-glutamate. (I) Proposed model for impaired amino acid reabsorption by the proximal tubule. Cl absorption through CFTR anion channels contributes to the lumen positive voltage, and loss of CFTR decreases voltage. The positive voltage enhances Na+- and H+-coupled amino acid reabsorption.

Comment in

  • Cystic fibrosis related metabolic defects: cross talk between ion channels and organs

References

    1. Quinton PM. Physiological basis of cystic fibrosis: a historical perspective. Physiol Rev. 1999;79(1 suppl):S3–S22. doi: 10.1152/physrev.1999.79.1.S3. - DOI - PubMed
    1. Ratjen F, et al. Cystic fibrosis. Nat Rev Dis Primers. 2015;1:15010. doi: 10.1038/nrdp.2015.10. - DOI - PMC - PubMed
    1. Elborn JS. Cystic fibrosis. Lancet. 2016;388(10059):2519–2531. doi: 10.1016/S0140-6736(16)00576-6. - DOI - PubMed
    1. Welsh MJ, Ramsey BW, Accurso F, Cutting GR. Cystic Fibrosis. In: Valle DL, Antonarakis S, Ballabio A, Beaudet AL, Mitchell GA, eds. The Online Metabolic and Molecular Bases of Inherited Disease. McGraw-Hill Education; 2019. Accessed May 15, 2024. https://ommbid.mhmedical.com/content.aspx?bookid=2709&sectionid=225891527.
    1. Consortium TCFG-P. Correlation between genotype and phenotype in patients with cystic fibrosis. N Engl J Med. 1993;329(18):1308–1313. doi: 10.1056/NEJM199310283291804. - DOI - PubMed

Substances