. 2024 May 14;9(12):e176963.
doi: 10.1172/jci.insight.176963.

Coordinated immune dysregulation in juvenile dermatomyositis revealed by single-cell genomics

Affiliations

Coordinated immune dysregulation in juvenile dermatomyositis revealed by single-cell genomics

Gabrielle Rabadam et al. JCI Insight. .

Abstract

Juvenile dermatomyositis (JDM) is one of several childhood-onset autoimmune disorders characterized by a type I IFN response and autoantibodies. Treatment options are limited due to an incomplete understanding of how the disease emerges from dysregulated cell states across the immune system. We therefore investigated the blood of patients with JDM at different stages of disease activity using single-cell transcriptomics paired with surface protein expression. By immunophenotyping peripheral blood mononuclear cells, we observed skewing of the B cell compartment toward an immature naive state as a hallmark of JDM at diagnosis. Furthermore, we find that these changes in B cells are paralleled by T cell signatures suggestive of Th2-mediated inflammation that persist despite disease quiescence. We applied network analysis to reveal that hyperactivation of the type I IFN response in all immune populations is coordinated with previously masked cell states including dysfunctional protein processing in CD4+ T cells and regulation of cell death programming in NK cells, CD8+ T cells, and γδ T cells. Together, these findings unveil the coordinated immune dysregulation underpinning JDM and provide insight into strategies for restoring balance in immune function.

Keywords: Autoimmune diseases; Autoimmunity; Bioinformatics; Rheumatology.


Figures

Figure 1
Figure 1. Study design and analysis strategy for profiling PBMCs from 27 samples.
(A) Overview of clinical characteristics of study cohort. Individuals are labeled by donor ID (JDM 1–15, HC 16–20). Longitudinal samples were collected from the following donors: JDM1 (n = 2), JDM2 (n = 2), JDM4 (n = 3), JDM8 (n = 2), JDM13 (n = 2), JDM15 (n = 2). Icon shapes denote disease activity group, and shades of blue denote medication regimen. (B) Analysis strategy for CITEseq data from PBMCs. n = 22 JDM, n = 5 HC.
Figure 2
Figure 2. Cell types associated with JDM in peripheral blood.
(A) UMAP constructed using weighted nearest neighbors (wnn) clustering colored by cell type. pDCs, plasmacytoid DCs; cDCs = classical DCs; PBs, plasmablasts; B_mem, memory B cells. (B) Heatmap with top 2 markers per cluster. (C) Box plot shows cell type proportion by disease group, using Kruskal-Wallis test with Dunn’s post hoc test comparing TNJDM with HC, TNJDM with inactive JDM, and inactive with HC (Holm’s, Padj < 0.05; *Padj < 0.05, **Padj < 0.01). The dot plot above shows the Spearman correlation between corresponding cell type proportion in box plot and Physician Global VAS, where the size of the dot indicates the correlation, the color indicates the direction of the correlation, and the border weight indicates significance (Padj < 0.05). (D) Heatmap with selected ADT protein markers. Asterisks mark significant comparisons between TNJDM and HC per cell type with an absolute LFC > 0.5 and Padj < 0.05.
Figure 3
Figure 3. Type I IFN–induced gene and protein expression is associated with disease activity in JDM in CD14+ monocytes.
(A) Heatmap of average IFN score per cell type and sample. Hierarchical clustering was performed using Euclidean distance and the complete clustering method. IFN score was calculated based on average expression of IFN module across all cells per sample. (B) Spearman correlation between IFN score and Physician Global VAS colored by disease group. (C) Scatter plot showing Spearman correlation between CD169 (SIGLEC-1) expression in CD14+ monocytes and Physician Global VAS. (D) Scatter plot showing Spearman correlation between IFN score and Physician Global VAS. (E) Scatter plot showing Spearman correlation between CD169 expression and IFN score in CD14+ monocytes.
Figure 4
Figure 4. DECIPHERseq extracts gene expression programs from single-cell RNA-Seq data in JDM.
(A) Overview of the DECIPHERseq workflow. (B) Heatmap showing 6 major clusters of GEPs identified by DECIPHERseq (Pearson). GEPs are clustered into modules, with isolated GEPs filtered out (grayscale).
Figure 5
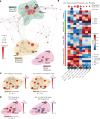
Figure 5. Network of coordinated biological activity inferred from GEPs in peripheral blood.
(A) Network constructed from correlated GEPs in PBMCs from patients with JDM and HCs. Nodes represent programs in the given cell types, and edges represent positive significant correlations (Pearson, P < 0.05). (B) Dot plot showing selected gene sets found to be enriched within specific modules compared with the rest of the network. Color corresponds to module enrichment P value, and size corresponds to a set’s rank in the list of significantly enriched gene sets for that given module ordered by ascending module enrichment P value (network permutations, GSEA, FDR < 0.01). All gene sets shown fall in the top 10 terms for their respective modules (total gene sets: 626).
Figure 6
Figure 6. JDM is associated with a central IFN hub and cell-specific gene programs in the B and CD4 T compartments.
(A) Zoomed-in graph of Module 1. GSEA results for Response to type I IFN GO term shown with each node colored according to FDR. Padj value of module enrichment is also shown (network permutations, Methods). (B) Heatmap showing significant differences in expression of selected programs between HC (n = 5) and patients with JDM (n = 22), with columns annotated by P values (P < 0.05) of case-control (t test) and disease activity association (4-group 1-way ANOVA). (C) Network graph showing case-control analysis of each program’s expression, with node size scaled according to P value and colored according to strength of the association between disease status and program expression (t test).
Figure 7
Figure 7. Disease activity in JDM is associated with central hub of IFN response in network, correlated with dysregulated immune cell states.
(A) Network graph showing results of 4-group 1-way ANOVA of each program’s expression, with node size scaled according to P value and colored according to strength of the association between disease status and program expression. (B) Heatmap showing significant differences in expression of selected disease activity–associated programs between HC (n = 5) and patients with inactive JDM (n = 6), active JDM (n = 7), and TNJDM (n = 9). Columns are annotated by P values of case-control t test and disease activity association (4-group 1-way ANOVA). (C and D) Selected network modules colored by FDR of enrichment for indicated gene ontology set (FDR < 0.01) or gene loading similarity within Modules 2 (C) and 5 (D).
Figure 8
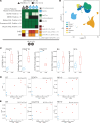
Figure 8. JDM-associated signatures identified by DECIPHERseq can be validated in independent samples.
(A) Clinical characteristics of validation cohort (n = 7). HC18 was included in original cohort, but an independent sample was collected and analyzed for this data set. Individuals are labeled by the donor ID. Immunosuppressants denoted as “+” for patients JDM22–25 were as follows: (JDM22: methotrexate), (JDM23: IVIG, cytoxan), (JDM24: hydroxychloroquine, MMF, IVIG, tofacitinib), (JDM25: methotrexate, IVIG). (B) UMAP of single-cell RNAseq data from validation cohort PBMC samples, colored by 6 major cell types corresponding to labels used in original cohort. (C) Box plots of case-control comparisons (HC = 2, JDM = 5) for selected programs queried in validation data set using AUCell (t test, *P < 0.05, **P < 0.01). (D and E) Scatter plots correlating disease activity (PGA) with AUCell scores for selected IFN programs (D) and selected disease activity programs (E) in validation data set (Spearman, P < 0.05).

Update of

Similar articles

Cited by

References

    1. Elkon KB, Stone VV. Type I interferon and systemic lupus erythematosus. J Interferon Cytokine Res. 2011;31(11):803–812. doi: 10.1089/jir.2011.0045. - DOI - PMC - PubMed
    1. Taplin CE, Barker JM. Autoantibodies in type 1 diabetes. Autoimmunity. 2008;41(1):11–18. doi: 10.1080/08916930701619169. - DOI - PubMed
    1. Apaolaza PS, et al. Islet expression of type I interferon response sensors is associated with immune infiltration and viral infection in type 1 diabetes. Sci Adv. 2021;7(9):eabd6527. doi: 10.1126/sciadv.abd6527. - DOI - PMC - PubMed
    1. Miller FW, et al. Genome-wide association study of dermatomyositis reveals genetic overlap with other autoimmune disorders. Arthritis Rheum. 2013;65(12):3239–3247. doi: 10.1002/art.38137. - DOI - PMC - PubMed
    1. Tsaltskan V, et al. Long-term outcomes in Juvenile Myositis patients. Semin Arthritis Rheum. 2020;50(1):149–155. doi: 10.1016/j.semarthrit.2019.06.014. - DOI - PMC - PubMed

Substances