. 2024 May 14;134(13):e169112.
doi: 10.1172/JCI169112.

The long noncoding RNA CARDINAL attenuates cardiac hypertrophy by modulating protein translation

Affiliations

The long noncoding RNA CARDINAL attenuates cardiac hypertrophy by modulating protein translation

Xin He et al. J Clin Invest. .

Abstract

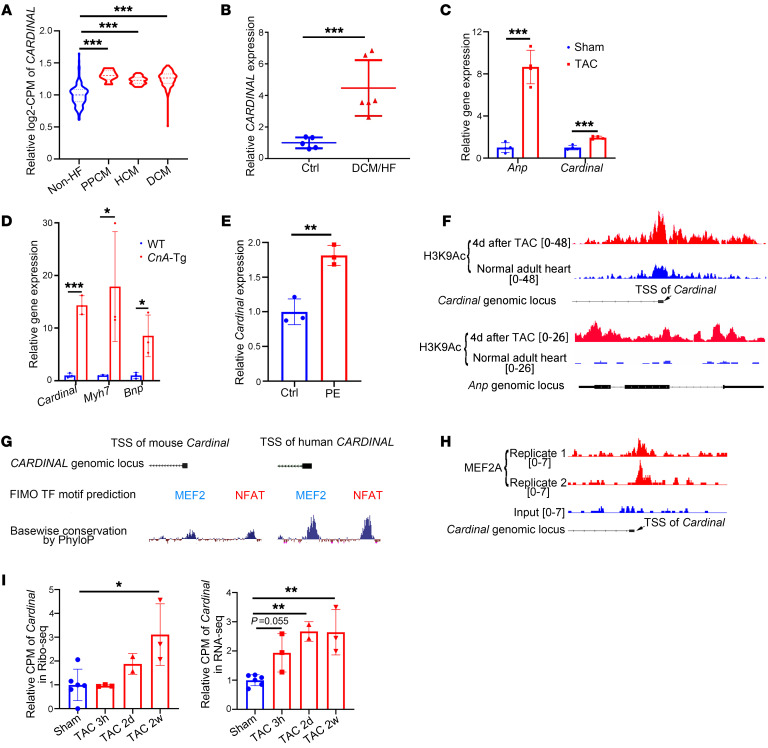
One of the features of pathological cardiac hypertrophy is enhanced translation and protein synthesis. Translational inhibition has been shown to be an effective means of treating cardiac hypertrophy, although system-wide side effects are common. Regulators of translation, such as cardiac-specific long noncoding RNAs (lncRNAs), could provide new, more targeted therapeutic approaches to inhibit cardiac hypertrophy. Therefore, we generated mice lacking a previously identified lncRNA named CARDINAL to examine its cardiac function. We demonstrate that CARDINAL is a cardiac-specific, ribosome-associated lncRNA and show that its expression was induced in the heart upon pathological cardiac hypertrophy and that its deletion in mice exacerbated stress-induced cardiac hypertrophy and augmented protein translation. In contrast, overexpression of CARDINAL attenuated cardiac hypertrophy in vivo and in vitro and suppressed hypertrophy-induced protein translation. Mechanistically, CARDINAL interacted with developmentally regulated GTP-binding protein 1 (DRG1) and blocked its interaction with DRG family regulatory protein 1 (DFRP1); as a result, DRG1 was downregulated, thereby modulating the rate of protein translation in the heart in response to stress. This study provides evidence for the therapeutic potential of targeting cardiac-specific lncRNAs to suppress disease-induced translational changes and to treat cardiac hypertrophy and heart failure.

Keywords: Cardiology; Cardiovascular disease; Development; Mouse models; Translation.


Figures

Figure 1
Figure 1. Identification of CARDINAL by screening for cardiac-specific, ribosome-associated lncRNAs.
(A) Flow chart of screening for cardiac-specific lncRNAs in a human multiorgan RNA-Seq database (https://apps.kaessmannlab.org/lncRNA_app). (B) Heatmap showing the cardiac specificity of candidate human lncRNAs identified in A. (C) Heatmap showing the cardiac specificity of mouse orthologs of candidate lncRNAs. (D) Relative expression level of 5 lncRNA candidates detected by RNA-Seq in ribosome-free fraction and a polysome fraction following polysome profiling in hESC-CMs (SRP150416) (n = 3 for each group). (E) Relative expression levels of Cardinal in polysome fractions of mouse hearts after sham or TAC surgery (GSE131296) (n = 5 for each group). (F) Polysome profiling of HL-1 cells and results of RT-qPCR and Western blotting with different fractions. (G) Relative expression levels of Cardinal in different cell types in hearts, detected by RT-qPCR (n = 3 for each group). (H) Northern blotting of endogenous Cardinal from adult mouse hearts. Gapdh serves as a control for loading. (I) Genomic structure of Cardinal with Ribo-Seq and RNA-Seq read coverage, basewise conservation calculated by PhyloP, and coding potential calculated by PhyloCSF. Black arrows indicate 2 conserved promoter regions. Tracks of Ribo-Seq and RNA-Seq read coverage were obtained from the Hubner Laboratory (http://shiny.mdc-berlin.de/cardiac-translatome/). Tracks of basewise conservation and coding potential were obtained from the UCSC genome browser (https://genome.ucsc.edu/). (J) Single-molecule RNA-FISH of Cardinal in HL-1 cells. (K) Single-molecule RNA-FISH in cardiomyocytes from adult mice. (L) Quantification of Cardinal RNA-FISH signals in the nucleus (Nuc) and cytoplasm (Cyto) in at least 100 randomly selected adult cardiomyocytes (CM) and HL-1 cells. (M) Relative amount of Cardinal in the nucleus versus the cytoplasm detected by RT-qPCR following nucleus/cytoplasm fractionation in adult cardiomyocytes and HL-1 cells (n = 3 for each group). *P < 0.05 and **P < 0.01, by 2-tailed Student’s t test (E and G). Scale bars: 50 μm (J and K). Cyto, cytoplasm; Nuc, nucleus.
Figure 2
Figure 2. CARDINAL modulation alters translation.
(A) Rationale of the SUnSET measurement. (B) Western blot and (C) quantification of puromycin-incorporated protein in NRVCs infected with control virus or Ad-Cardinal and treated by culture medium with or without PE (50 μM) for 24 hours. Cells were treated with 1 μM puromycin for 30 minutes before harvesting (n = 3 for each group). (D) Immunofluorescence images (scale bars: 50 μm) and (E) fluorescence intensity quantification of NRVCs infected with control virus or Ad-Cardinal and treated in culture medium with or without PE (50 μM) for 24 hours by FUNCAT assay. Newly synthesized protein was labeled by Alexa Fluor 594. Violin plots were generated to show the median, 25th and 75th percentiles. At least 100 cells were measured for quantification in each group. (F) Western blot and (G) quantification of puromycin-incorporated protein in adult cardiomyocytes infected with control virus or Ad-Cardinal and treated in culture medium with or without PE (50 μM) for 24 hours. Cells were treated with 1 μM puromycin for 30 minutes before harvesting (n = 3 for each group). **P < 0.01 and ***P < 0.001, by 2-way ANOVA with Tukey’s post hoc test (C, E, and G).
Figure 3
Figure 3. Cardiac hypertrophy upregulates CARDINAL and enhances its association with the ribosome.
(A) RNS-Seq was performed to detect relative expression levels of CARDINAL in human heart samples from individuals without heart failure (Non-HF), with peripartum cardiomyopathy (PPCM), hypertrophic cardiomyopathy (HCM), or DCM (GSE141910). Replicate numbers of non-HF, PPCM, HCM, and DCM samples were 166, 6, 28, and 166, respectively. (B) Relative expression of CARDINAL detected by RT-qPCR in human heart samples from individuals with or without heart failure (HF)/DCM (n ≥5 for each group). (C) Relative Anp and Cardinal expression levels detected by RT-qPCR in hearts 2 weeks after sham or TAC surgery (n = 4 for each group). (D) Relative expression levels of Cardinal and the hypertrophic markers Bnp and Myh7 in hearts from WT or CnA-Tg mice detected by RT-qPCR (n = 3 for each group). (E) Relative Cardinal expression levels detected by RT-qPCR in isolated adult mouse cardiomyocytes treated in culture medium with or without PE (50 μM) for 24 hours. (n = 3 for each group). (F) Read coverage of histone H3K9Ac CHIP-Seq near the transcription start sites (TSSs) of Cardinal and Anp from normal hearts or hearts 4 days after TAC surgery (GSE50637). (G) MEF2 and NFAT were predicted to bind the conserved promoter regions of CARDINAL in both humans and mice by the software tool Find Individual Motif Occurrences (FIMO). (H) Read coverage of MEF2A CHIP-Seq near the TSS of Cardinal (GEO GSE124008). (I) Ribosome-associated and total Cardinal levels detected by Ribo-Seq and RNA-Seq from hearts after sham surgery or 3 hours, 2 days, or 2 weeks after TAC surgery (PRJNA484227). The replicate numbers of sham surgery, 3 hours after TAC (TAC 3h), 2 days after TAC (TAC 2d), and 2 weeks after TAC (TAC 2w) were 6, 3, 2, and 3, respectively. *P < 0.05, **P < 0.01, and ***P < 0.001, by 2-tailed Student’s t test (BE) or 2-way ANOVA with Tukey’s post hoc test (A and I).
Figure 4
Figure 4. Pressure overload increases cardiac hypertrophy and enhances protein translation in Cardinal-KO mice.
(A) Relative Cardinal expression levels detected by RT-qPCR (n ≥3 for each group) and (B) ventricular weight/body weight ratio (n ≥6 for each group). (C) H&E staining, (D) wheat germ agglutinin (WGA) staining (scale bars: 60 μm), (E) relative cardiomyocyte area quantification (n ≥6 for each group), (F) Picrosirius red/Fast Green staining (scale bars: 1 mm and 200 μm), (G) relative fibrosis area quantification (n ≥10 for each group) performed on cross sections, (H) relative expression levels of hypertrophy and fibrosis markers detected by RT-qPCR (n ≥4 for each group), and (I) echocardiographic parameters (n ≥6 for each group) of hearts from control and Cardinal-KO mice 4 weeks after sham or TAC surgery. (J) Western blot analysis and (K) quantification of puromycin-incorporated protein in hearts from control and Cardinal-KO mice 2 weeks after TAC surgery (n = 6 for each group). Mice were peritoneally injected with 25 mg/kg puromycin 45 minutes before sacrifice. (L) Western blot and (M) quantification of puromycin-incorporated protein in adult mouse cardiomyocytes from control or Cardinal-KO mice treated in culture medium with or without PE (50 μM) for 24 hours. Cells were treated with 1 μM puromycin for 30 minutes before harvesting (n = 4 for each group). (N) Summary of the GSEA results. Proteomic changes in hearts from KO TAC versus Ctrl TAC by GSEA using the gene sets from the Gene Ontology Biological Process. (O) Enrichment plot of the gene set “actin filament organization” generated by GSEA with translatomic alterations in hearts from KO TAC versus Ctrl TAC mice. (P) Heatmap showing proteomic changes in the “actin filament organization” gene set in hearts from KO TAC versus Ctrl TAC mice. Documented prohypertrophic factors among upregulated proteins are highlighted. *P < 0.05, **P < 0.01, and ***P < 0.001, by 2-tailed Student’s t test (G and K) or 2-way ANOVA with Tukey’s post hoc test (A, B, E, H, I, and M).
Figure 5
Figure 5. CARDINAL overexpression attenuates cardiomyocyte hypertrophy.
(A) Timeline for in vivo Cardinal gain-of-function analysis. (B) Relative expression of Cardinal (n ≥4 for each group) detected by RT-qPCR. (C) Ventricular weight/body weight ratio (n ≥4 for each group), (D) gross morphology (scale bars: 1 mm), (E) H&E staining (scale bars: 1 mm), (F) WGA staining (scale bars: 50 μm), (G) cardiomyocyte size quantification (n = 3 for each group), (H) Picrosirius red/Fast Green staining (scale bars: 1 mm), and (I) fibrosis area quantification (n ≥4 for each group) using cross sections, (J) relative expression of cardiac hypertrophy and fibrosis markers (n ≥4 for each group), and (K) percentage of fractional shortening (FS) of hearts from mice injected with AAV9-Ctrl or AAV9-Cardinal 4 weeks after sham or TAC surgery. (L) Immunofluorescence images (scale bars: 70 μm) and (M) cell area quantification of NRVCs infected with control virus or Ad-Cardinal treated using culture medium with or without PE (50 μM) for 48 hours. Violin plots were generated to show the median and 25th and 75th percentiles. At least 300 cells were measured for quantification in each group. (N) RT-qPCR results showing relative gene expression levels of hypertrophy markers in NRVCs infected with control virus or Ad-Cardinal treated in culture medium with or without PE (50 μM) for 24 hours (n = 3 for each group). *P < 0.05, **P < 0.01, and ***P < 0.001, by 2-tailed Student’s t test (I) or 2-way ANOVA with Tukey’s post hoc test (B, C, G, J, K, M, and N).
Figure 6
Figure 6. RNA interactome reveals that CARDINAL interacts with the translational regulator DRG1.
(A) Designs for 3 sets of RNA pull-downs. (B) Venn diagram showing the Cardinal-interacting proteins. (C) Relative enrichment of Cardinal, Cardinal-as, and Linc-p21 from HA-DRG1 and control IP (n = 3 for each group). Mass spec, mass spectrometry. (D) Western blot (WB) of HA-DRG1 in RNA pull-downs. HA, hemagglutinin. (E) Relative enrichment of Cardinal from IP in HL-1 cells. (F) Ribo-Seq coverages of hearts after sham surgery or 2 weeks after TAC surgery (PRJNA484227) over the Myh7 genomic locus (n = 3 for each group). Black arrows show a potential ribosome stalling site. (G) Western blot and (H) quantification of DRG1 and puromycin-incorporated protein in HL-1 cells 48 hours after RNA interference. Cells were treated with 1 μM puromycin for 30 minutes before harvesting (n = 3 for each group). (I) Western blot and (J) quantification of puromycin-incorporated protein in NRVCs 24 hours after stimulation. Cells were treated by 1 μM puromycin for 30 minutes before harvesting (n = 3 for each group). (K) Immunofluorescence staining and (L) cell size quantification of NRVCs 48 hours after stimulation (n ≥300 for each group). Scale bars: 50 μm. (M) RT-qPCR results of relative gene expression in NRVCs 24 hours after stimulation (n = 3 for each group). (IM) NRVCs were treated with si-NC or si-Drg1 and stimulated by culture medium with or without PE (50 μM). (N) Proportion of proteins with 0–4 categories of stalling motif among upregulated proteins versus the remaining proteins. (O) Violin plots showing the number of stalling motifs among upregulated versus the remaining proteins. (P) Proportion of proteins with 0–4 kinds of stalling motif among proteins in “actin filament organization” (AFO) gene set versus the remaining proteins. (Q) Violin plots showing numbers of stalling motifs among proteins in AFO gene set versus the remaining proteins. **P < 0.01 and ***P < 0.001, by 2-tailed Student’s t test (C and H), Mann-Whitney U test (O and Q), or 2-way ANOVA with Tukey’s post hoc test (J, L, and M). NC, negative control.
Figure 7
Figure 7. CARDINAL destabilizes DRG1 by preventing its interaction with DFRP1.
(A) Western blot and (B) quantification of DRG1 protein levels and (C) quantification of Drg1 mRNA levels detected by RT-qPCR in NRVCs infected with control virus or Ad-Cardinal and treated with or without PE for 48 hours (50 μM) (n ≥3 for each group). (D) Western blot and (E) quantification of DRG1 protein levels (n = 3 for each group) and (F) quantification of Drg1 mRNA levels (n ≥6 for each group) detected by RT-qPCR in hearts from control or Cardinal-KO mice 4 weeks after sham or TAC surgery. (G) Western blot and (H) quantification of DRG1 protein levels in hearts from mice injected with AAV9-GFP or AAV9-Cardinal 4 weeks after sham or TAC surgery (n = 3 for each group). (I) Western blot of immunoprecipitated product and input in 293T cells showing the interaction between DRG1 and DFRP1. (J) Western blot of anti-DRG1 and IgG immunoprecipitated product and input in HL-1 cells. (K) Western blot of HA-DRG1 in 293T cells transfected with HA-Drg1 plasmid with or without cotransfection of Dfrp1and Cardinal plasmid. (L) Western blot of immunoprecipitated product and input of 293T cells showing the effect of Cardinal on DRG1-DFRP1 interaction. The amount of transfected plasmid was carefully titrated to ensure comparable inputs in the presence or absence of Cardinal. (M) Relative Cardinal expression levels detected by RT-qPCR in sh-NC and sh-Cardinal HL-1 cells (n = 3 for each group). (N) Western blot of anti-DRG1 immunoprecipitated product in stably knocked-down Cardinal (sh-Cardinal) and its control (sh-NC) HL-1 cells. (O) Western blot and (P) quantification of puromycin-incorporated protein in NRVCs with the indicated treatment and PE stimulation for 9 hours (n = 3 for each group). *P < 0.05, **P < 0.01, and ***P < 0.001, by 2-tailed Student’s t test (F and M) or 2-way ANOVA with Tukey’s post hoc test (B, C, E, H, and P).
Figure 8
Figure 8. Proposed model for the regulation of mRNA translation and cardiac hypertrophy by CARDINAL.
(A) Cardinal is a cardiac-specific lncRNA that can suppress mRNA translation. Under normal conditions, the expression of Cardinal and the ribosome-binding protein DRG1 (which promotes mRNA translation) are in balance. We propose that CARDINAL inhibits mRNA translation by interference with DRG1 function. CARDINAL binds DRG1 and interferes with the formation of the DRG1-DFRP1 stabilization complex; inhibition of DRG1-DFRP1 complex formation by CARDINAL results in reduced levels of DRG1, which helps maintain a normal level of translation. (B) Under stress conditions, both the lncRNA CARDINAL and DRG1 are upregulated. However, while Cardinal attempts to inhibit cardiomyocyte translation, it is no longer able to balance the increased translation induced by the increase in DRG1; the result is a net increase in mRNA translation and cardiac hypertrophy. (C) In the absence of CARDINAL, the constraint on DRG1 levels is lost. The result is an even greater elevation of protein synthesis and worsening of cardiac hypertrophy.

References

    1. Conrad N, et al. Temporal trends and patterns in heart failure incidence: a population-based study of 4 million individuals. Lancet. 2018;391(10120):572–580. doi: 10.1016/S0140-6736(17)32520-5. - DOI - PMC - PubMed
    1. Taylor CJ, et al. Trends in survival after a diagnosis of heart failure in the United Kingdom 2000-2017: population based cohort study. BMJ. 2019;364:l223. doi: 10.1136/bmj.l223. - DOI - PMC - PubMed
    1. Nakamura M, Sadoshima J. Mechanisms of physiological and pathological cardiac hypertrophy. Nat Rev Cardiol. 2018;15(7):387–407. doi: 10.1038/s41569-018-0007-y. - DOI - PubMed
    1. Wang Y, et al. Temporal dynamics of cardiac hypertrophic growth in response to pressure overload. Am J Physiol Heart Circ Physiol. 2017;313(6):H1119–H1129. doi: 10.1152/ajpheart.00284.2017. - DOI - PMC - PubMed
    1. He X, et al. Signaling cascades in the failing heart and emerging therapeutic strategies. Signal Transduct Target Ther. 2022;7(1):134. doi: 10.1038/s41392-022-00972-6. - DOI - PMC - PubMed