. 2024 Sep 3;147(9):3113-3130.
doi: 10.1093/brain/awae158.

PMP22 duplication dysregulates lipid homeostasis and plasma membrane organization in developing human Schwann cells

Affiliations

PMP22 duplication dysregulates lipid homeostasis and plasma membrane organization in developing human Schwann cells

Robert Prior et al. Brain. .

Abstract

Charcot-Marie-Tooth disease type 1A (CMT1A) is the most common inherited peripheral neuropathy caused by a 1.5 Mb tandem duplication of chromosome 17 harbouring the PMP22 gene. This dose-dependent overexpression of PMP22 results in disrupted Schwann cell myelination of peripheral nerves. To obtain better insights into the underlying pathogenic mechanisms in CMT1A, we investigated the role of PMP22 duplication in cellular homeostasis in CMT1A mouse models and in patient-derived induced pluripotent stem cells differentiated into Schwann cell precursors (iPSC-SCPs). We performed lipidomic profiling and bulk RNA sequencing (RNA-seq) on sciatic nerves of two developing CMT1A mouse models and on CMT1A patient-derived iPSC-SCPs. For the sciatic nerves of the CMT1A mice, cholesterol and lipid metabolism was downregulated in a dose-dependent manner throughout development. For the CMT1A iPSC-SCPs, transcriptional analysis unveiled a strong suppression of genes related to autophagy and lipid metabolism. Gene ontology enrichment analysis identified disturbances in pathways related to plasma membrane components and cell receptor signalling. Lipidomic analysis confirmed the severe dysregulation in plasma membrane lipids, particularly sphingolipids, in CMT1A iPSC-SCPs. Furthermore, we identified reduced lipid raft dynamics, disturbed plasma membrane fluidity and impaired cholesterol incorporation and storage, all of which could result from altered lipid storage homeostasis in the patient-derived CMT1A iPSC-SCPs. Importantly, this phenotype could be rescued by stimulating autophagy and lipolysis. We conclude that PMP22 duplication disturbs intracellular lipid storage and leads to a more disordered plasma membrane owing to an alteration in the lipid composition, which might ultimately lead to impaired axo-glial interactions. Moreover, targeting lipid handling and metabolism could hold promise for the treatment of patients with CMT1A.

Keywords: Charcot–Marie–Tooth disease type 1A; Schwann cells; human induced pluripotent stem cells; lipid metabolism; lipid storage; plasma membrane.


Conflict of interest statement

L.V.D.B. is head of the Scientific Advisory Board of Augustine Therapeutics (Leuven, Belgium) and is part of the Investment Advisory Board of Droia Ventures (Meise, Belgium). The other authors declare no competing interests.

Figures

Figure 1
Figure 1
Cholesterol biosynthesis is the major dysregulated pathway during nerve development of CMT1A mice. (A) Immunohistochemical analysis of human PMP22 in the sciatic nerves of the C3 and C22 mouse models at 12 weeks of age. (B) Schematic overview of the time points analysed for bulk RNA sequencing of sciatic nerves isolated from the C3 and C22 mouse models, with their age-matched littermate controls used for normalization. (C) Activation heat map of the main canonical pathways (the cholesterol biosynthesis-related pathways) that are dysregulated in both the C3 and C22 mouse models throughout their postnatal development when compared with their littermate controls. (D) The super pathway of cholesterol biosynthesis z-scores is plotted over the developmental time points at which data collection was conducted. Littermate control z-scores are equivalent to zero on the y-axis of the graph. (E) Heat map illustrating the temporal expression profiles of dysregulated lipid metabolism-related genes in the C3 and C22 mouse models throughout development. Scale bar in A = 100 µm. Black arrows in C and E represent developmental time points from 3 to 12 weeks in age, as displayed in B.
Figure 2
Figure 2
Lipidomic analysis highlights major alterations in the expression of lipid species in the sciatic nerves of 5-week-old C3 mice. (A) Principal component analysis (PCA) plot of lipids in sciatic nerves from C3 mice versus their wild-type (WT) littermate controls at 5 weeks of age. Principal components 1 and 2 (PC1 and PC2, respectively) were used to generate the graph. (B) Volcano plot demonstrating the relative expression of lipid species between C3 mice and WT controls. The P-value threshold was set at 0.05; fold change (FC) threshold: log2(FC) = 0.3. (C) Total cholesterol measurement from sciatic nerves of 5-week-old C3 mice and WT littermates. Statistical significance was evaluated using a two-tailed, unpaired t-test (*P < 0.05). Data are presented as the mean ± SD. (D) Simplified network visualization of lipid metabolism showing alterations in lipid profiles of C3 mice compared with their WT littermates. Circles represent the detected lipid species, where the circle size expresses the significance according to the P-value, while the colour darkness defines the degree of upregulation/downregulation (red/blue) according to the fold change. The most discriminating lipids are annotated. The number of mice used in A, B and D was as follows: WT mice = 4 and C3 mice = 3. In C, the number of mice used was as follows: WT mice = 3 and C3 mice = 5.
Figure 3
Figure 3
Generation of Schwann cells and their precursors from induced pluripotent stem cells (iPSCs). (A) Schematic overview of the iPSC-SC differentiation protocol, indicating incorporation or removal (Δ) of key medium components. Phase contrast images show the cultures at Days 0, 6, 28 and 36. Scale bar = 100 µm. (B) Immunocytochemical stainings of key lineage markers documenting a switch in phenotypes at Days 0 (iPSC; Nanog and Oct3/4), 6 (neural crest-like; AP2 and HNK1), 28 (SCP; NGFR and GAP43) and 35 (immature SC; GFAP and S100β) of the protocol. Scale bar = 50 µm. (C) Quantifications using qPCR of temporal mRNA expression of NANOG, GAP43, CDH19, MPZ, NGFR, DHH, GFAP, SOX10 and ITGA4. DIV = days in vitro. Data are presented as the mean ± SD. (D) Immunocytochemical staining of iPSC-SCs showing expression of myelin basic protein (MBP) after being co-cultured with mouse dorsal root ganglia for 8 weeks. Scale bar = 20 µm. The image on the right shows a three-dimensional reconstruction using Leica SP8 confocal microscopy of the image on the left. Scale bar = 10 µm.
Figure 4
Figure 4
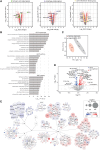
Dysregulated gene expression and alterations of the lipidomic profile in CMT1A patient iPSC-SCPs. (A) Volcano plots showing dysregulated genes in CMT1A iPSC-SCs compared with isogenic controls. Dysregulated myelin/Schwann cell-related genes, in addition to lipid metabolism- and autophagy-related genes are highlighted in separate graphs. The adjusted P-value threshold was set at 0.05; fold change (FC) threshold: 0.5. (B) Gene ontology (GO) showing the top 10 enriched ontological terms for cellular components (GO Component), function (GO Function) and molecular process (GO Process) that are reduced in CMT1A iPSC-SCPs. (C) Principal component analysis plot for the lipidomic analysis performed on CMT1A iPSC-SCPs and isogenic controls. (D) Volcano plot of the relative expression profiles of lipid species in the CMT1A iPSC-SCPs. The P-value threshold was set at 0.05; log2(FC) threshold: 0.3. (E) Simplified network visualization of lipid species, showing alterations in lipid profiles of CMT1A iPSC-SCPs compared with isogenic controls. Circles represent the detected lipid species, where the circle size expresses the significance according to the P-value, while the colour darkness defines the degree of upregulation/downregulation (red/blue) according to the fold change. The most discriminating lipids are annotated.
Figure 5
Figure 5
Reduced free cholesterol, increased disorder and altered lipid raft dynamics in the plasma membrane of CMT1A iPSC-SCPs. (A) Representative images of the filipin staining for isogenic and CMT1A iPSC-SCPs. (B) Free cholesterol levels in the plasma membrane of CMT1A iPSC-SCPs and isogenic controls were determined by filipin staining. n = average intensity per well, with ∼200 cells/well analysed. (C) Flow cytometry to calculate generalized polarization excitation (GPex) values ranging from −1 (low membrane order) to +1 (high membrane order). n = individual wells cultured in parallel. (D and E) Spectral confocal imaging of giant plasma membrane vesicles (GPMVs) using Di-4-ANEPPDHQ (D) or Laurdan (E) to calculate the generalized polarization emmission (GPem) values. For Di-4-ANEPPDHQ, n = 164 CMT1A and n = 142 isogenic GPMVs, and for Laurdan, n = 151 CMT1A and n = 112 isogenic GPMVs. Representative figures are shown. (F and G) Di-4-ANEPPDHQ-stained GPMVs from CMT1A and isogenic iPSC-SCPs (F), colour-coded generalized polarization (GP) value per pixel (G). (H and I) Laurdan-stained GPMVs from CMT1A and isogenic iPSC-SCPs (H) colour-coded GP value per pixel (I). (J) Representative total internal reflection fluorescence images of CTB-labelled PM in isogenic and CMT1A iPSC-SCPs, and representative trajectory maps (inset: magnification exhibiting confined and free diffusion). (K and L) Mean square displacement (MSD) over time, area under the curve (AUC), mean distribution of the diffusion coefficient and the ratio of mobile to immobile fractions for CMT1A and isogenic iPSC-SCPs. Lipid raft dynamics is significantly confined in CMT1A. n = 27–34 cells, with 6966 trajectories per cell in the isogenic group and 5424 trajectories per cell in CMT1A group. Data are presented as the mean ± SD. **P < 0.01 and ****P < 0.0001.
Figure 6
Figure 6
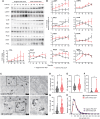
Dysregulated lipid homeostasis and autophagy during lipid stress and lipid accumulations in the late-endosomal lysosomal system in CMT1A iPSC-SCPs. (A) Immunoblots of key proteins of autophagy and lipid homeostasis in CMT1A iPSC-SCPs and isogenic controls during lipid starvation (0, 24, 48, 72, 96 and 120 h). (B) Quantification of blots displayed in A. Data are presented as the mean ± SEM. n = 3–5 independent time-course experiments. (C) Transmission electron microscopy images of CMT1A and isogenic iPSC-SCPs. GC = Golgi compartment; LA = lipid accumulation; M = mitochondria; N = nucleus. Black arrowheads indicate the perimeter of the vesicles. An enlarged area shows late-endosomal lysosomes (LELs) in isogenic iPSC-SCPs (top) and ‘filled’ LELs with lipid accumulations in CMT1A iPSC-SCPs (bottom). Scale bars = 500 nm for left images; 200 nm for insets. (DG) Quantifications of LEL number (D) and size (E) per cell. Lipid accumulations per cell (F) present in LELs and non-vesicular bound accumulations. The number of ‘filled’ LELs (G), representing lipid and non-lipid accumulations in LELs that occupied at least one-fifth of the LEL. Isogenic iPSC-SCP cells = 45; CMT1A iPSC-SCP cells = 33. (H) Relative frequency distribution of the total number of LELs quantified in two independent preparations (isogenic iPSC-SCP LELs = 600; CMT1A iPSC-SCP LELs = 611). Statistical significance in B was evaluated using a two-way ANOVA, followed by Fisher’s LSD test (*P < 0.05, **P < 0.01 and ***P < 0.001). In DH, statistical significance was evaluated using Student’s two-tailed, unpaired t-test (*P < 0.05 and ***P < 0.001).
Figure 7
Figure 7
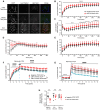
Excessive lipid droplet formation in response to oleic acid exposure in CMT1A iPSC-SCPs, which can be reversed by modulating lipid metabolism. (A) Immunofluorescence of lysosomes (LysoTracker, in red) and lipid droplets (LDs, LipidSpot, in green) of CMT1A iPSC-SCPs treated with oleic acid (OA) at the beginning, middle and end of the time-course experiment. Scale bar = 20 µm. (BE) Analysis of the time-course experiment demonstrating higher LD numbers (B) and size (C) in CMT1A than in isogenic iPSC-SCPs. Lysosome size (D) and number (E) were initially increased in the CMT1A iPSC-SCPs, but then reached the level of isogenic iPSC-SCPs. Thirty wells per group were analysed. Data are presented as the mean ± SD. (F and G) Time-course imaging of lysosomes and LDs demonstrated that forskolin (FSK) prevented the excessive accumulation of LDs (F) and lysosomes (G) in CMT1A iPSC-SCPs during exposure to OA. Data are presented as the mean ± SD. (H) Treatment with progesterone receptor antagonist (PA) PF-02413873 resulted in increased free cholesterol in the plasma membrane. Data are presented as the mean ± SEM; 30 wells per group were analysed for both isogenic and CMT1A iPSC-SCPs. Analysis in BE was performed using a one-way ANOVA (**P < 0.01, ***P < 0.001 and ****P < 0.0001; data are presented as the mean ± SD), in F and G using a two-way ANOVA with Šidák multiple comparisons tests (****,####P < 0.0001; data are presented as the mean ± SD), and in H by using Student’s two-tailed t-test (**P < 0.01, ***P < 0.001 and ****P < 0.0001).
Figure 8
Figure 8
Schematic overview of the perturbed lipid homeostasis during human CMT1A Schwann cell development. Homeostatic regulation of lipid metabolism is perturbed during the development of human CMT1A Schwann cells. Illustration of how human CMT1A Schwann cells respond to lipid abundance and starvation, including (1) reduced cellular trafficking and incorporation of cholesterol; and (2) excess accumulation of polyunsaturated fatty acids (PUFAs) and reduction of sphingomyelin (SM) in the plasma membrane (PM). These alterations in PM lipid composition cause the PM to become disordered, which perturbs lipid raft functions and lipid-mediated signalling, thereby affecting the stability of the PM and cell differentiation state in CMT1A Schwann cells. In addition, CMT1A Schwann cells displayed alterations in (3) lipid droplet biogenesis, size and number during nutrient stress; and, likewise, (4) the number and size of lysosomes and late endosomal lysosomes (LELs), and the number of lipid-loaded LELs was increased. Importantly, treatment strategies targeting the lipid droplets were shown effectively to (5) release the storage of free cholesterol and enable its incorporation into the PM; and (6) stabilize the PM and lipid raft dynamics. (7) Lastly, the targeting of perturbed lipid droplets and lysosome regulation can restore the lipid homeostatic balance in human CMT1A Schwann cells. This figure was created with BioRender.com.

References

    1. Timmerman V, Neils E, Van Hul W, et al. The peripheral myelin protein gene PMP-22 is contained within the Charcot-Marie-Tooth disease type 1A duplication. Nat Genet. 1992;1:171–175. - PubMed
    1. Raeymaekers P, Timmerman V, Nelis E, et al. Duplication in chromosome 17p11.2 in Charcot-Marie-Tooth neuropathy type 1a (CMT 1a). Neuromuscul Disord. 1991;1:93–97. - PubMed
    1. van Paassen BW, van der Kooi AJ, van Spaendonck-Zwarts KY, Verhamme C, Baas F, de Visser M. PMP22 related neuropathies: Charcot-Marie-Tooth disease type 1A and Hereditary Neuropathy with liability to Pressure Palsies. Orphanet J Rare Dis. 2014;9:38. - PMC - PubMed
    1. Amici SA, Dunn WA, Notterpek L. Developmental abnormalities in the nerves of peripheral myelin protein 22-deficient mice. J Neurosci Res. 2007;85:238–249. - PubMed
    1. Brady ST, Witt AS, Kirkpatrick LL, et al. Formation of compact myelin is required for maturation of the axonal cytoskeleton. J Neurosci. 1999;19:7278–7288. - PMC - PubMed

MeSH terms