. 2024 Jun 1;41(6):msae092.
doi: 10.1093/molbev/msae092.

Evolution of Chromosomal Inversions across an Avian Radiation

Affiliations

Evolution of Chromosomal Inversions across an Avian Radiation

Ulrich Knief et al. Mol Biol Evol. .

Erratum in

Abstract

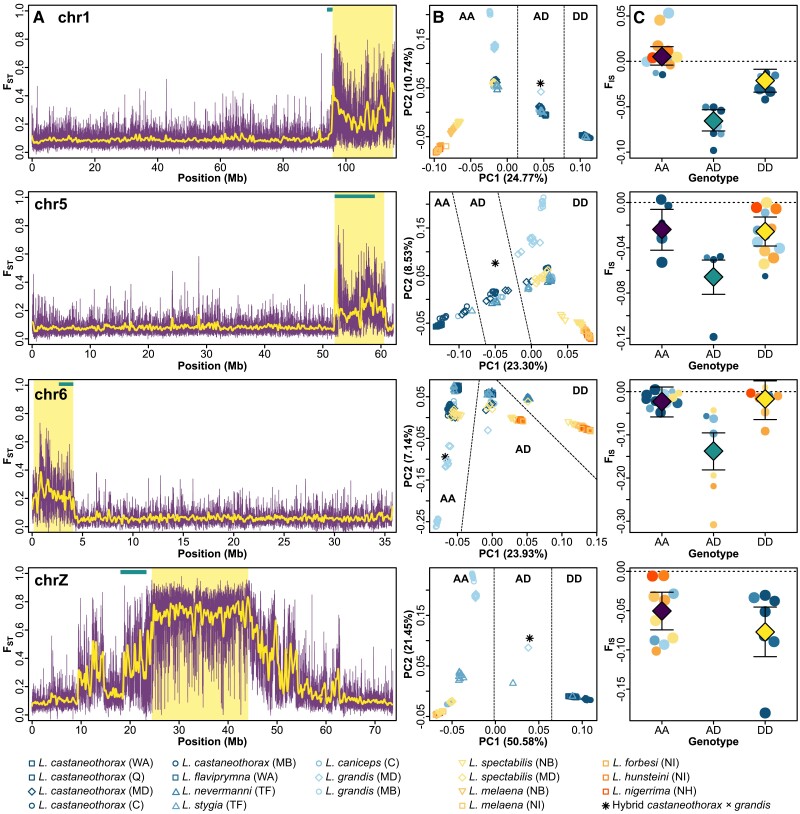
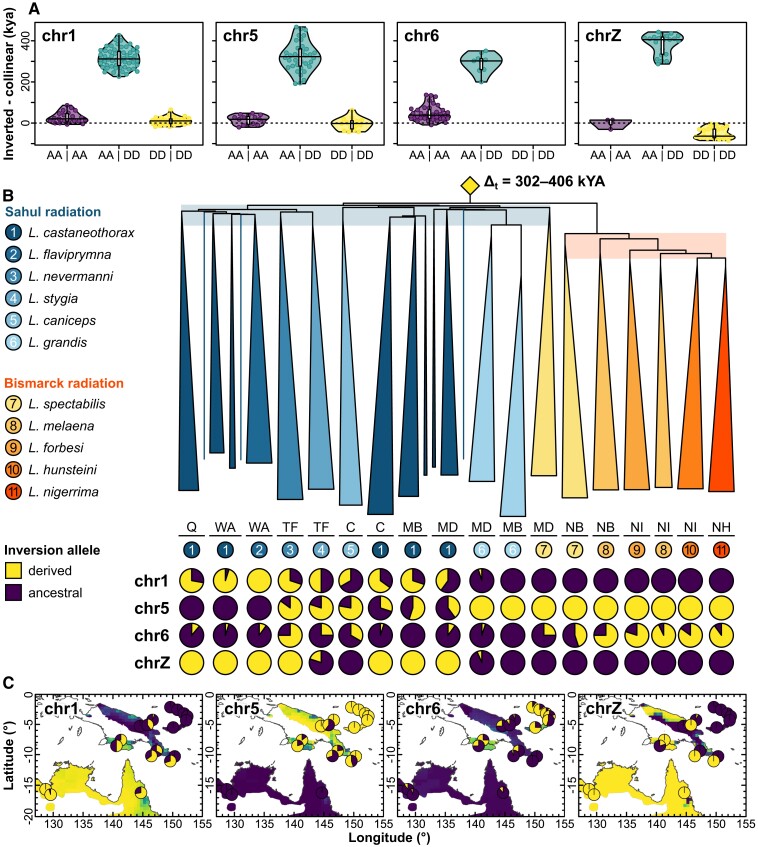
Chromosomal inversions are structural mutations that can play a prominent role in adaptation and speciation. Inversions segregating across species boundaries (trans-species inversions) are often taken as evidence for ancient balancing selection or adaptive introgression, but can also be due to incomplete lineage sorting. Using whole-genome resequencing data from 18 populations of 11 recognized munia species in the genus Lonchura (N = 176 individuals), we identify four large para- and pericentric inversions ranging in size from 4 to 20 Mb. All four inversions cosegregate across multiple species and predate the numerous speciation events associated with the rapid radiation of this clade across the prehistoric Sahul (Australia, New Guinea) and Bismarck Archipelago. Using coalescent theory, we infer that trans-specificity is improbable for neutrally segregating variation despite substantial incomplete lineage sorting characterizing this young radiation. Instead, the maintenance of all three autosomal inversions (chr1, chr5, and chr6) is best explained by selection acting along ecogeographic clines not observed for the collinear parts of the genome. In addition, the sex chromosome inversion largely aligns with species boundaries and shows signatures of repeated positive selection for both alleles. This study provides evidence for trans-species inversion polymorphisms involved in both adaptation and speciation. It further highlights the importance of informing selection inference using a null model of neutral evolution derived from the collinear part of the genome.

Keywords: Lonchura; ecological selection; munia; speciation; trans-species polymorphism.


Figures

Fig. 1.
Fig. 1.
Current distribution and phylogenetic history of the Lonchura species complex in Australia, New Guinea, and the Bismarck Archipelago. a) Collinear genome-wide phylogenetic network analysis, including L. striata as an outgroup. Two major radiations (Sahul and Bismarck) are well supported and make L. castaneothorax, L. spectabilis, and L. melaena poly- or paraphyletic. b) PCA using all collinear autosomal loci. The 18 populations form distinct clusters. Species from Australia and New Guinea are split from those on the Bismarck Islands along PC1 and L. grandis from the remaining Australian/New Guinean species along PC2. The individual marked by a black asterisk is an F1 hybrid between L. castaneothorax and L. grandis. c) Admixture analysis using K = 12 clusters. For species sampled in more than one location, samples generally group by geography rather than species identity. The bird illustrations are the work of Javier Lazaro and the species range shape files are courtesy of BirdLife International and Handbook of the Birds of the World (2017).
Fig. 2.
Fig. 2.
Detection and genotyping of the four polymorphic inversions on chromosomes chr1, chr5, chr6, and chrZ. a) Inversions stand out as regions of high FST in comparison to the collinear parts of the chromosomes (see also supplementary table S1, Supplementary Material online). chr1: L. flaviprymna (WA) versus L. spectabilis (MD), chr5: L. castaneothorax (WA) versus L. spectabilis (MD), chr6: L. flaviprymna (WA) versus Lonchura nevermanni (TF), chrZ: L. castaneothorax (MB) versus L. spectabilis (MD). Centromere positions are highlighted by turquoise bars. Purple lines: FST in 10 kb sliding windows with 2 kb overlap. Yellow lines: loess smoothed sliding window FST. Inversion positions are highlighted as light yellow boxes. b) PCA using SNPs located inside the inversions separate homokaryotypic from heterokaryotypic individuals along PC1, which suggests that the inversions explain more of the variation in SNP allele frequencies than the phylogenetic history of the species. Genotypes are separated into AA (homozygous ancestral, AD (heterozygous), and DD (homozygous derived). c) The population-level inbreeding coefficient (FIS) of the three autosomal inversions is significantly lower in the heterokaryotypic individuals than in homokaryotypes.
Fig. 3.
Fig. 3.
Relative ages and geographic distributions of the four polymorphic inversions on chromosomes chr1, chr5, chr6, and chrZ. a) Relative inversion age between (turquoise) and within inversion type (ancestral: purple, derived: yellow) relative to the collinear parts of a chromosome. b) Distance tree and inversion frequencies across all 18 populations. The tree is rooted using L. striata as the outgroup, and individuals of the same population are collapsed if they are monophyletic. Three single individuals are represented as lines and belong to populations L. castaneothorax Q, L. castaneothorax WA, and L. castaneothorax MD, from left to right. Population L. castaneothorax WA consists of three edges, L. castaneothorax MB of two edges, and L. castaneothorax MD of three edges in total (black horizontal lines below encompass respective populations). The origins of all four inversions predate the Sahul and Bismarck radiations, depicted as a single yellow diamond on the distance tree (see also supplementary figs. S12 to S15, Supplementary Material online, and Table 1). c) Geographic distribution of the ancestral and derived inversion types with the predicted allele frequencies derived from spatially explicit mixed-effects models.
Fig. 4.
Fig. 4.
IBD (left column) and IBE (right column) on chr1 (see supplementary figs. S17 to S19, Supplementary Material online, for chromosomes chr5, chr6, and chrZ). The upper row displays IBD and IBE for the inversion. The bottom row displays those for the collinear part of the chromosome. In the center, differences in the two ecological variables, namely, precipitation (blue) and temperature (red), are shown in relation to geographic distance (ecospatial autocorrelation; Shafer and Wolf 2013). In the IBE plots, precipitation is used as the ecological variable.
Fig. 5
Fig. 5
MRM using randomly selected SNPs in the collinear parts of chr1, chr5, chr6, and chrZ. For each SNP, we fitted a model with SNP allele frequency in the 18 populations as our dependent variable and geographic distance and differences in precipitation and temperature as our explanatory variables. We then plotted the estimated effect of each of these explanatory variables on SNP allele frequency as a histogram. We fitted the same model using inversion frequency as our dependent variable and displayed the estimated effects of each of the three independent variables as vertical yellow lines. P-values were derived from the effect distributions of the SNPs and Bonferroni corrected for the four chromosomes being tested.

Similar articles

Cited by

References

    1. Anderson SC, Ward EJ, English PA, Barnett LAK. sdmTMB: an R package for fast, flexible, and user-friendly generalized linear mixed effects models with spatial and spatiotemporal random fields. 2022. bioRxiv 2022.03.24.485545. 10.1101/2022.03.24.485545. preprint: not peer reviewed. - DOI
    1. Andolfatto P, Depaulis F, Navarro A. Inversion polymorphisms and nucleotide variability in Drosophila. Genet Res. 2001:77(1):1–8. 10.1017/S0016672301004955. - DOI - PubMed
    1. Andrews S. FastQC: a quality control tool for high throughput sequence data. 2010. https://www.bioinformatics.babraham.ac.uk/projects/fastqc/.
    1. Ayala D, Guerrero RF, Kirkpatrick M. Reproductive isolation and local adaptation quantified for a chromosome inversion in a malaria mosquito. Evolution 2013:67(4):946–958. 10.1111/j.1558-5646.2012.01836.x. - DOI - PubMed
    1. Backström N, Forstmeier W, Schielzeth H, Mellenius H, Nam K, Bolund E, Webster MT, Ost T, Schneider M, Kempenaers B, et al. . The recombination landscape of the zebra finch Taeniopygia guttata genome. Genome Res. 2010:20(4):485–495. 10.1101/gr.101410.109. - DOI - PMC - PubMed