

Transcriptomics analysis highlights potential ways in human pathogenesis in Leishmania braziliensis infected with the viral endosymbiont LRV1
- PMID: 38743668
- PMCID: PMC11093365
- DOI: 10.1371/journal.pntd.0012126
Transcriptomics analysis highlights potential ways in human pathogenesis in Leishmania braziliensis infected with the viral endosymbiont LRV1
Abstract
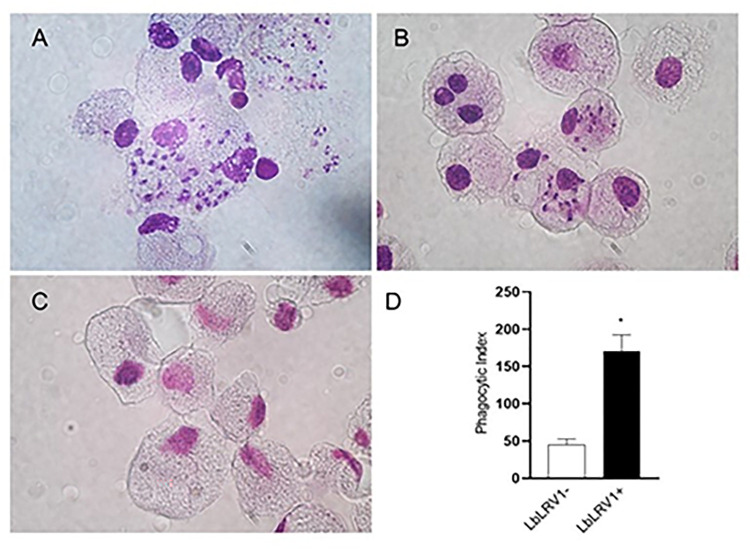
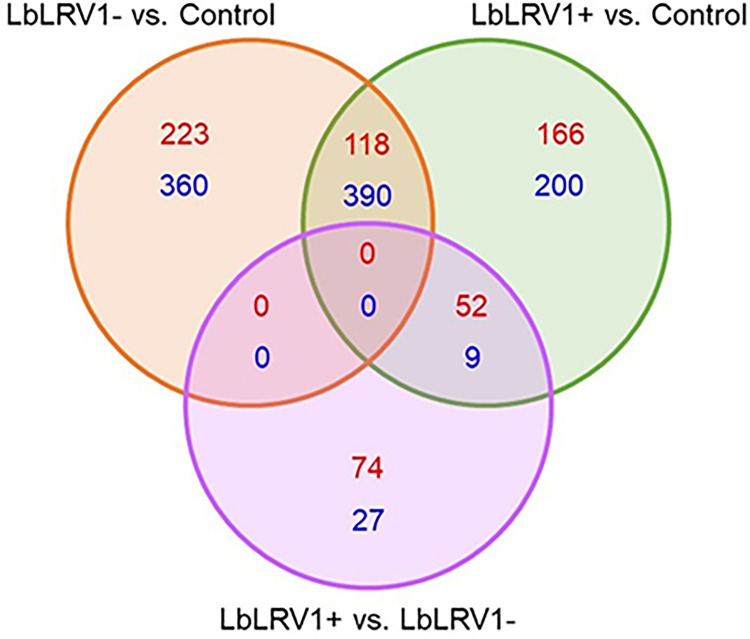
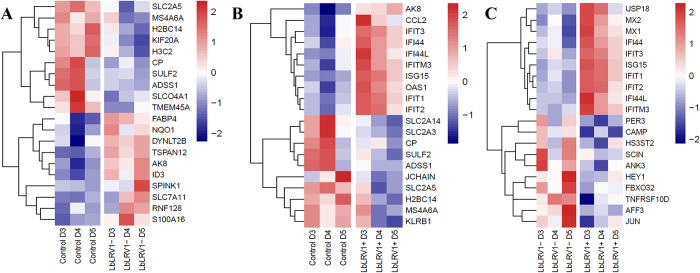
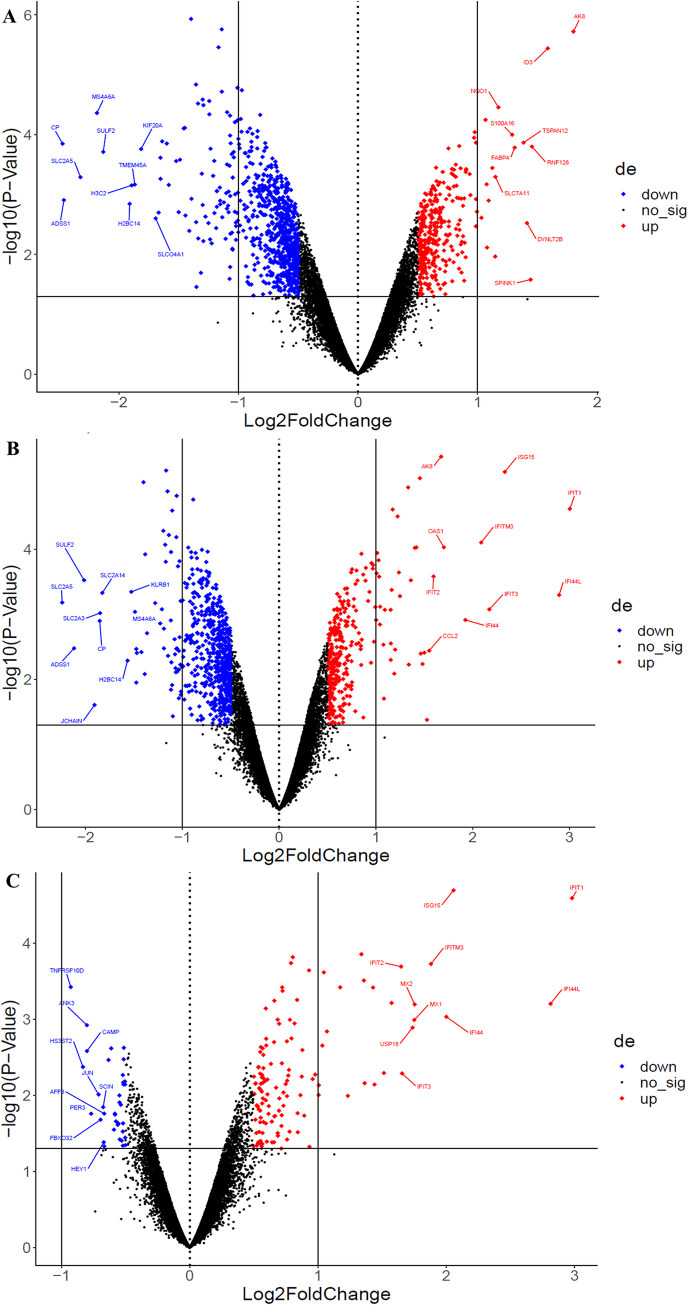
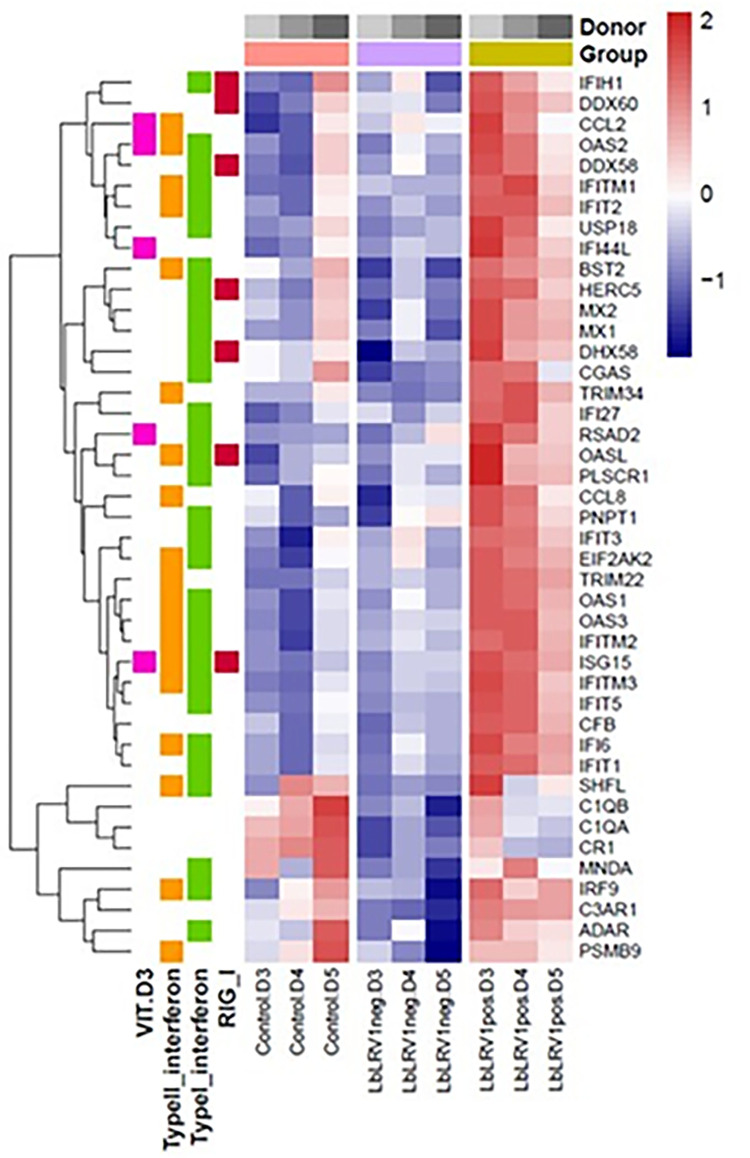
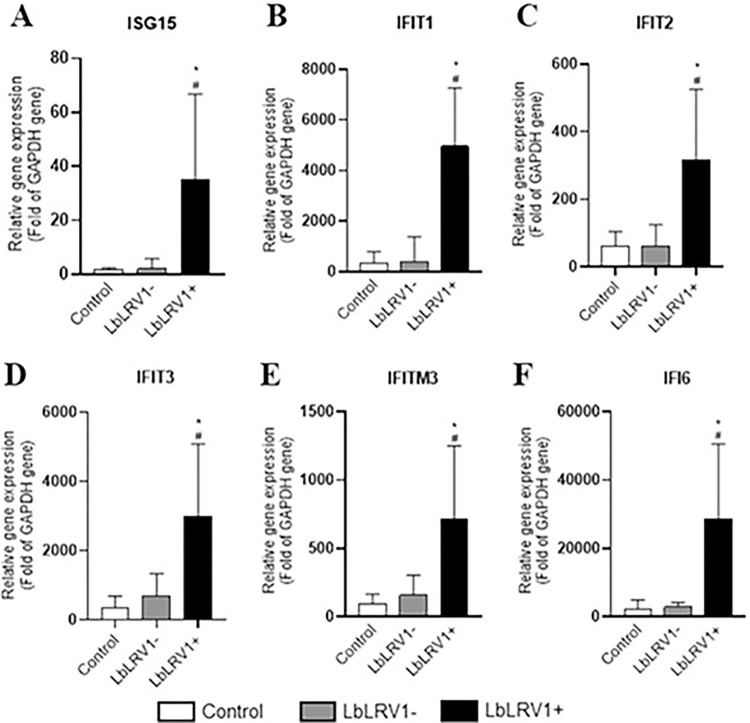
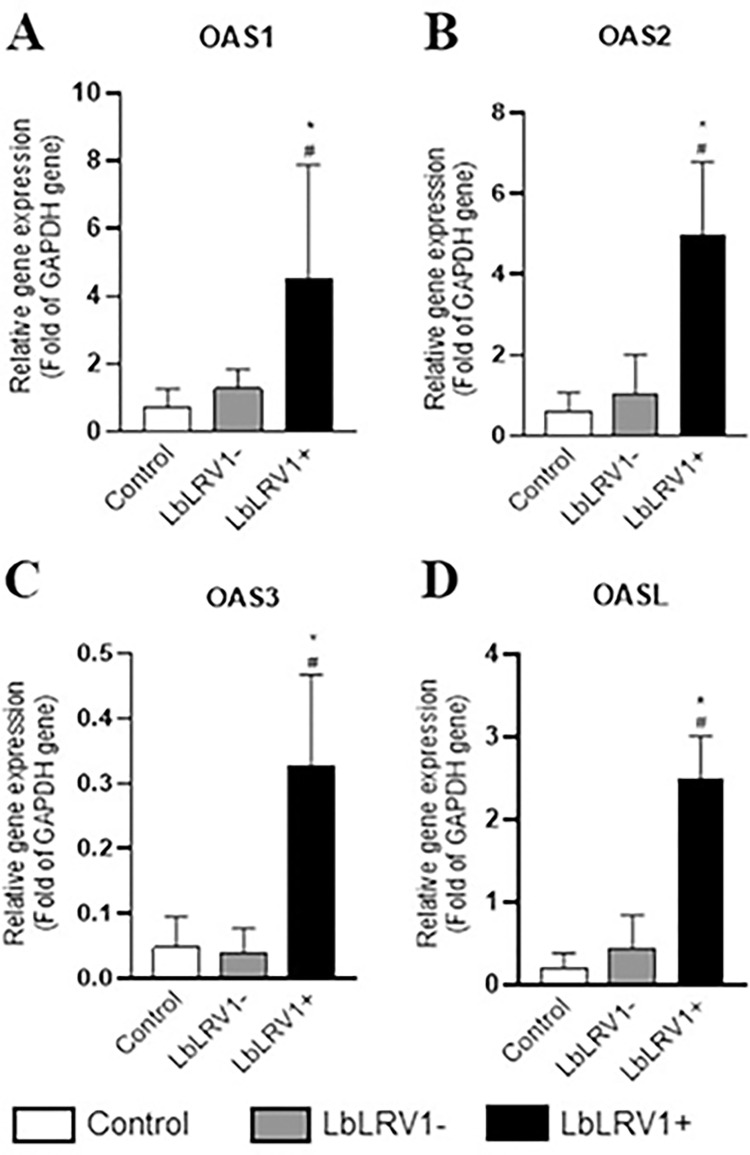
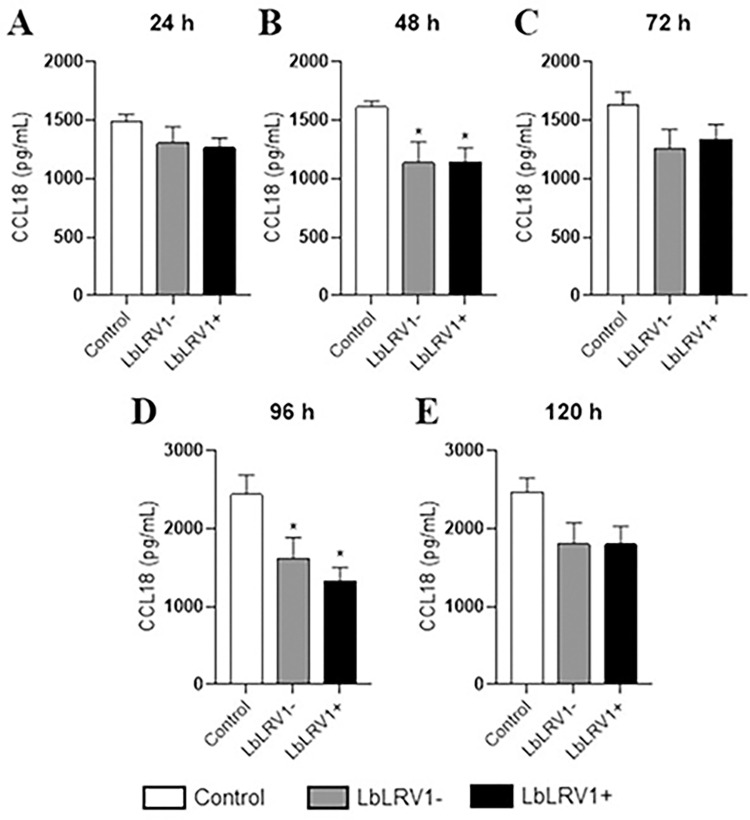
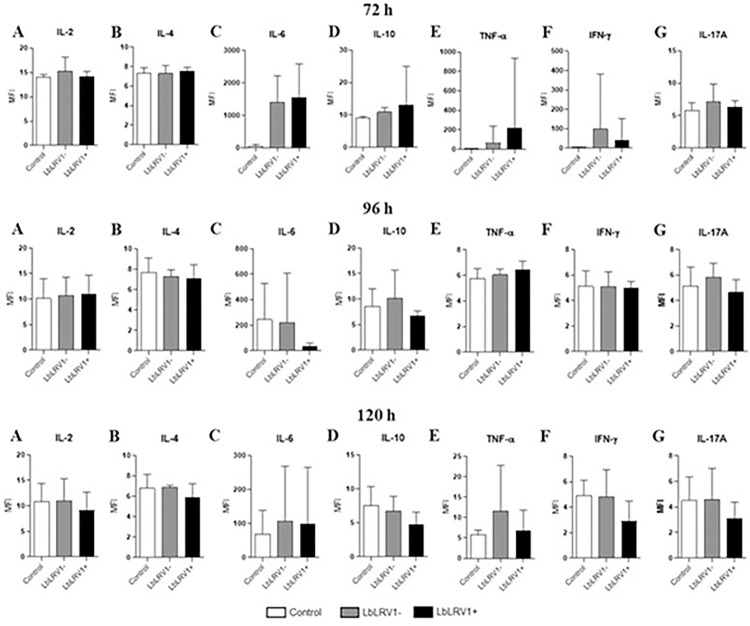
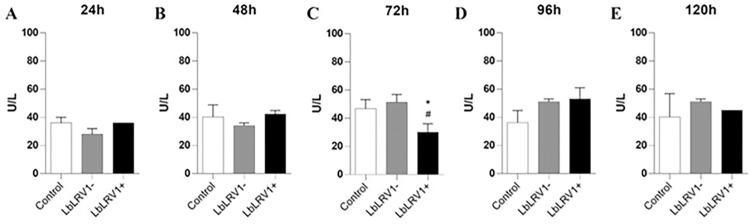
The parasite Leishmania (Viannia) braziliensis is widely distributed in Brazil and is one of the main species associated with human cases of different forms of tegumentary leishmaniasis (TL) such as cutaneous leishmaniasis (CL) and mucosal leishmaniasis (ML). The mechanisms underlying the pathogenesis of TL are still not fully understood, but it is known that factors related to the host and the parasite act in a synergistic and relevant way to direct the response to the infection. In the host, macrophages have a central connection with the parasite and play a fundamental role in the defense of the organism due to their ability to destroy intracellular parasites and present antigens. In the parasite, some intrinsic factors related to the species or even the strain analyzed are fundamental for the outcome of the disease. One of them is the presence of Leishmania RNA Virus 1 (LRV1), an endosymbiont virus that parasitizes some species of Leishmania that triggers a cascade of signals leading to a more severe TL phenotype, such as ML. One of the strategies for understanding factors associated with the immune response generated after Leishmania/host interaction is through the analysis of molecular patterns after infection. Thus, the gene expression profile in human monocyte-derived macrophages obtained from healthy donors infected in vitro with L. braziliensis positive (LbLRV1+) and negative (LbLRV1-) for LRV1 was evaluated. For this, the microarray assay was used and 162 differentially expressed genes were identified in the comparison LbLRV1+ vs. LbLRV1-, 126 upregulated genes for the type I and II interferons (IFN) signaling pathway, oligoadenylate synthase OAS/RNAse L, non-genomic actions of vitamin D3 and RIG-I type receptors, and 36 down-regulated. The top 10 downregulated genes along with the top 10 upregulated genes were considered for analysis. Type I interferon (IFNI)- and OAS-related pathways results were validated by RT-qPCR and Th1/Th2/Th17 cytokines were analyzed by Cytometric Bead Array (CBA) and enzyme-linked immunosorbent assay (ELISA). The microarray results validated by RT-qPCR showed differential expression of genes related to IFNI-mediated pathways with overexpression of different genes in cells infected with LbLRV1+ compared to LbLRV1- and to the control. No significant differences were found in cytokine levels between LbLRV1+ vs. LbLRV1- and control. The data suggest the activation of gene signaling pathways associated with the presence of LRV1 has not yet been reported so far. This study demonstrates, for the first time, the activation of the OAS/RNase L signaling pathway and the non-genomic actions of vitamin D3 when comparing infections with LbLRV1+ versus LbLRV1- and the control. This finding emphasizes the role of LRV1 in directing the host's immune response after infection, underlining the importance of identifying LRV1 in patients with TL to assess disease progression.
Copyright: © 2024 Felipin et al. This is an open access article distributed under the terms of the Creative Commons Attribution License, which permits unrestricted use, distribution, and reproduction in any medium, provided the original author and source are credited.
Conflict of interest statement
The authors have declared that no competing interests exist.
Figures
References
-
- WHO WHO, OPAS PAHO. Leishmaniasis: epidemiological report of the Americas. Rep Leishmaniases. 2019;March: 1–8.
-
- OPAS OP-A da S, WHO WHO. Leishmaniasis. 2021 [cited 7 Apr 2021]. Available from: https://www.paho.org/en/topics/leishmaniasis.
-
- Brasil M da saúde. Manual de Vigilância da Leishmaniose Tegumentar. Secretaria de Vigilância em Saúde. 2017.
-
- Silveira FT, Ishikawa EAY, de Souza AAA, Lainson R. An outbreak of cutaneous leishmaniasis among soldiers in Belém, Pará State, Brazil, caused by Leishmania (Viannia) lindenbergi n. sp. A new leishmanial parasite of man in the Amazon region. Parasite. 2002; 43–50. - PubMed
MeSH terms
Substances
LinkOut - more resources
Full Text Sources
Molecular Biology Databases
