. 2024 May 21;5(5):101559.
doi: 10.1016/j.xcrm.2024.101559. Epub 2024 May 13.

The adipose-neural axis is involved in epicardial adipose tissue-related cardiac arrhythmias

Affiliations

The adipose-neural axis is involved in epicardial adipose tissue-related cardiac arrhythmias

Yubao Fan et al. Cell Rep Med. .

Abstract

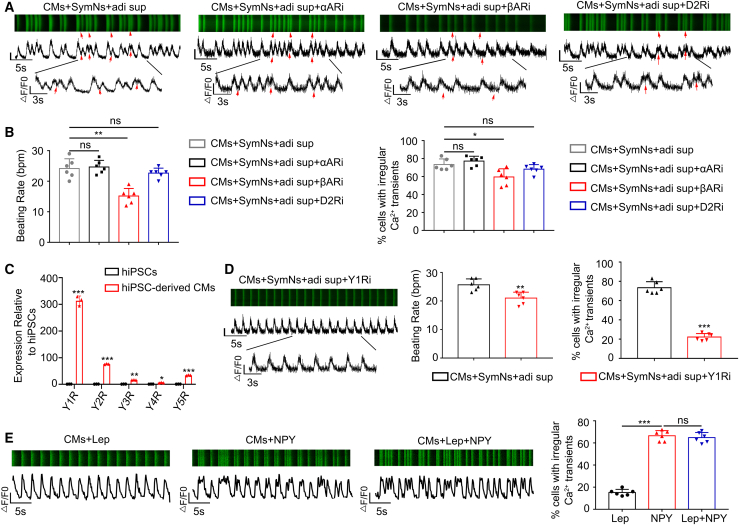
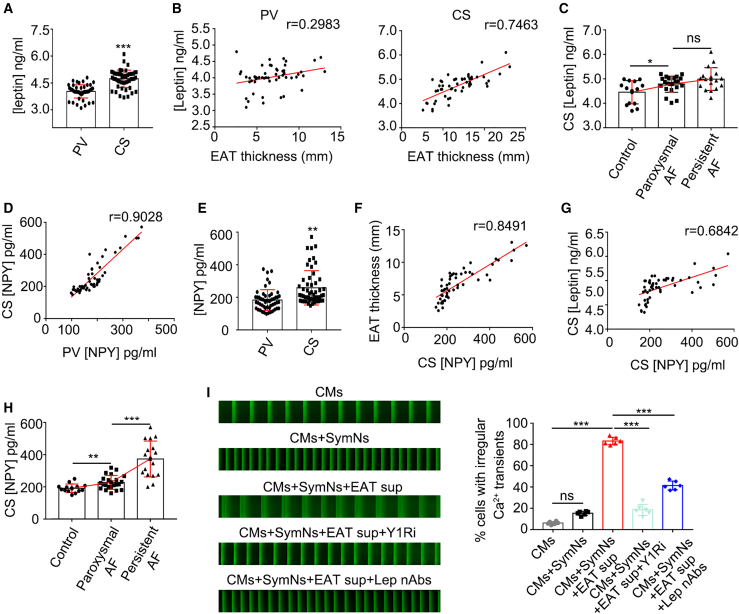
Dysfunction of the sympathetic nervous system and increased epicardial adipose tissue (EAT) have been independently associated with the occurrence of cardiac arrhythmia. However, their exact roles in triggering arrhythmia remain elusive. Here, using an in vitro coculture system with sympathetic neurons, cardiomyocytes, and adipocytes, we show that adipocyte-derived leptin activates sympathetic neurons and increases the release of neuropeptide Y (NPY), which in turn triggers arrhythmia in cardiomyocytes by interacting with the Y1 receptor (Y1R) and subsequently enhancing the activity of the Na+/Ca2+ exchanger (NCX) and calcium/calmodulin-dependent protein kinase II (CaMKII). The arrhythmic phenotype can be partially blocked by a leptin neutralizing antibody or an inhibitor of Y1R, NCX, or CaMKII. Moreover, increased EAT thickness and leptin/NPY blood levels are detected in atrial fibrillation patients compared with the control group. Our study provides robust evidence that the adipose-neural axis contributes to arrhythmogenesis and represents a potential target for treating arrhythmia.

Keywords: NPY; adipose-neural axis; arrhythmia; epicardial adipose tissue; leptin; sympathetic neurons.


Conflict of interest statement

Declaration of interests The authors declare no competing interests.

Figures

None
Graphical abstract
Figure 1
Figure 1
Arrhythmogenesis is positively correlated with EAT thickness and sympathetic neuron activity (A) EAT thickness measurement using CT. A1: horizontal long-axis plane of the right atrioventricular groove (AVG), left AVG, and anterior interventricular groove (IVG). A2: short-axis plane of periatrial EAT at the esophagus, main pulmonary artery, and descending thoracic aorta. A3: short-axis plane of the superior IVG, inferior IVG, and right ventricular free wall. The red arrows indicate the points of measurement, and A2 shows the field of EAT that was used in this study. (B) Correlation between EAT thickness and body mass index (BMI). (C) Correlation between EAT thickness and subcutaneous adipose tissue (SAT) thickness. (D) Correlation between the EAT thickness and abdominal fat (ABDF) thickness. (E) The EAT thickness was calculated and compared among patients without AF (control, n = 14), with paroxysmal AF (paroxysmal AF, n = 22), and with persistent AF (persistent AF, n = 17). Data are presented as the mean ± SEM. ∗p < 0.05, ∗∗∗p < 0.001, determined by one-way ANOVA test. (F) The LF/HF ratio was calculated and compared in patients with non-AF (n = 14), paroxysmal AF (n = 22), and persistent AF (n = 17). (G) The LF/HF ratio was calculated and compared between patients without AF (control, n = 8) and those with AF (n = 5) who were not taking β-blockers. Data are presented as the mean ± SEM.∗p < 0.05, determined by Student’s t test.
Figure 2
Figure 2
Adipocyte supernatant induces arrhythmia-like calcium transients in hiPSC-derived cardiomyocytes cocultured with hiPSC-derived sympathetic neurons (A) Schematic representation of the in vitro coculture system using hiPSC-CMs and hiPSC-SymNs (CMs+SymNs). (B) Schematic representation of the in vitro coculture system using hiPSC-CMs and the supernatant of ADSC-derived adipocytes (CMs+adi sup). (C) Schematic representation of the in vitro coculture system using hiPSC-CMs, hiPSC-SymNs, and the supernatant of ADSC-derived adipocytes (CMs+SymNs+adi sup). (D) Line-scan images of spontaneous Ca2+ transients and quantification of the beating rate and cells exhibiting irregular Ca2+ transients in hiPSC-CMs from the control group and CMs+SymNs group (n = 60 cells per group). Data are presented as the mean ± SEM. ns, not significant; ∗∗∗p < 0.001, determined by Student’s t test. (E) Line-scan images of spontaneous Ca2+ transients and quantification of the beating rate and cells exhibiting irregular Ca2+ transients in hiPSC-CMs from the control group and CMs+adi sup group (n = 60 cells per group). Data are presented as the mean ± SEM. ns, not significant; determined by Student’s t test. (F) Line-scan images of spontaneous Ca2+ transients and quantification of the beating rate and cells exhibiting irregular Ca2+ transients in hiPSC-CMs from the control group and CMs+SymNs+adi sup group. Red arrows indicate arrhythmia-like waveforms (n = 60 cells per group). Data are presented as the mean ± SEM. ∗∗∗p < 0.001, determined by Student’s t test. (G) Schematic representation of microelectrode array (MEA) recordings of cardiomyocytes on an MEA plate. Cells were seeded by placing a droplet of the cell suspension directly onto the array and within the space circumscribed by the reference electrodes. (H) Representative traces of MEA recordings of hiPSC-CMs in different groups. (I) The average FPD BVRs for each group were calculated and compared (n = 9 times per group). Data are presented as the mean ± SEM. ∗p < 0.05, ∗∗p < 0.01, ∗∗∗p < 0.001, determined by one-way ANOVA test. (J) Typical heatmaps of cardiomyocytes in different groups. The blue region represents the origin of beating (start electrode), while different colors show the propagation delay time. The black arrows indicate the conduction direction of the field action potential. (K) The conduction velocity of hiPSC-CMs in different groups was calculated (n = 6 times per group). Data are presented as the mean ± SEM. ns, not significant; ∗∗p < 0.01, determined by one-way ANOVA test. (L) The conduction time of hiPSC-CMs in different coculture systems was quantified (n = 6 times per group). Data are presented as the mean ± SEM. ∗p < 0.05, ∗∗∗p < 0.001, determined by one-way ANOVA test.
Figure 3
Figure 3
Leptin secreted by adipocytes causes an irregular rhythm of cardiomyocytes by activating sympathetic neurons via the leptin receptor (A) Quantification of cytokines in the adipocyte supernatant using a bead-based multiplex assay (n = 3 times per group). (B) Line-scan images of spontaneous Ca2+ transients in hiPSC-CMs treated with IL-1β or IL-6 with or without hiPSC-SymNs. (C) Line-scan images of spontaneous Ca2+ transients in hiPSC-CMs treated with IL-8 or TNF-α with or without hiPSC-SymNs. (D) Quantification of the beating rate and cells exhibiting irregular Ca2+ transients in hiPSC-CMs cocultured with sympathetic neurons and a single cytokine (n = 60 cells per group). Data are presented as the mean ± SEM. ns, not significant; ∗p < 0.05, ∗∗p < 0.01, ∗∗∗p < 0.001, determined by Student’s t test. (E) Line-scan images of spontaneous Ca2+ transients and quantification of the beating rate and cells exhibiting irregular Ca2+ transients in hiPSC-CMs treated with Lep with or without hipSC-SymNs (n = 60 cells per group). Data are presented as the mean ± SEM. ∗∗∗p < 0.001, determined by Student’s t test. (F) Line-scan images of spontaneous Ca2+ transients and quantification of the beating rate and cells exhibiting irregular Ca2+ transients in hiPSC-CMs treated with APN with or without hiPSC-SymNs (n = 60 cells per group). Data are presented as the mean ± SEM. ns, not significant; ∗∗p < 0.01, determined by Student’s t test. (G) Immunofluorescence staining for the sympathetic neuron marker TH and the leptin receptor (LepR). Scale bar, 50 μm. (H) Immunofluorescence assay for TH and the neuronal activity marker c-Fos in hiPSC-SymNs cultured with or without leptin. Scale bar, 50 μm. (I) The concentrations of neurotransmitters in the supernatant were analyzed using commercial ELISA kits before and after leptin administration (n = 3 times per group). (J) Western blot analysis and relative quantification of STAT3, p-STAT3, and SOCS3 in hiPSC-SymNs treated with leptin, adi sup, or adi sup plus a JAK2 inhibitor (AG490) (n = 3 times per group). (K) Line-scan images of spontaneous Ca2+ transients and quantification of cells exhibiting irregular Ca2+ transients in hiPSC-CMs from the triple coculture system with the addition of a leptin-neutralizing antibody (n = 60 cells per group). Data are presented as the mean ± SEM. ∗p < 0.05, ∗∗∗p < 0.001, determined by one-way ANOVA test.
Figure 4
Figure 4
Activation of sympathetic neurons leads to an irregular rhythm of cardiomyocytes via NPY/Y1R interactions (A) Line-scan images of spontaneous Ca2+ transients in hiPSC-CMs from the triple coculture system treated with a blocker of α-adrenergic receptor, β-adrenergic receptor, or dopamine receptor 2. Red arrows indicate arrhythmia-like waveforms. (B) Quantification of the beating rate and cells exhibiting irregular Ca2+ transients in hiPSC-CMs from the triple coculture system treated with a specific blocker (n = 60 cells per group). Data are presented as the mean ± SEM. ns, not significant; ∗p < 0.05, ∗∗p < 0.01, determined by one-way ANOVA test. (C) qRT-PCR analysis of the gene expression of NPY receptors in hiPSC-CMs (n = 3 times). (D) Line-scan images of spontaneous Ca2+ transients and quantification of the beating rate and cells exhibiting irregular Ca2+ transients in hiPSC-CMs from the triple coculture system treated with a Y1R blocker (BIBP3226) (n = 60 cells per group). Data are presented as the mean ± SEM. ∗∗p < 0.01, ∗∗∗p < 0.001, determined by Student’s t test. (E) Line-scan images of spontaneous Ca2+ transients and quantification of cells exhibiting irregular Ca2+ transients in hiPSC-CMs treated with leptin, NPY or leptin plus NPY (n = 60 cells per group). Data are presented as the mean ± SEM. ns, not significant; ∗∗∗p < 0.001, determined by one-way ANOVA test.
Figure 5
Figure 5
The NPY/Y1R interaction results in an arrhythmia-like phenotype in cardiomyocytes by increasing NCX or CaMKII activity (A) Representative recordings of APs in hiPSC-CMs from the indicated groups. (B) The average action potential durations (APDs) at the 30%, 50%, and 90% repolarization levels were measured and compared (n = 9 times per group). (C) Representative recordings of APs in hiPSC-CMs from the triple coculture system. Red arrows indicate typical DADs. (D) Quantification of the DAD incidence for hiPSC-CMs in different groups (n = 60 cells per group). (E) Representative NCX-mediated calcium efflux in hiPSC-CMs from different groups during the caffeine treatment. The peak represents the content of the SR Ca2+ loading. (F) Bar graph of the mean normalized NCX activity in the various groups compared with that in the control group (first bar). The y axis shows the ratio of calcium fluorescence intensity to time rather than the kinetics of Ca2+ decay. For each strain, 12–15 cardiomyocytes from 3 independent experiments were analyzed. (G) Line-scan images of spontaneous Ca2+ transients and quantification of cells exhibiting irregular Ca2+ transients in hiPSC-CMs from the triple coculture system treated with the NCX inhibitor (SEA0400; 2 μM, n = 60 per group) or the CaMKII inhibitor (KN93; 1 μM, n = 60 cells per group). Data are presented as the mean ± SEM. ∗p < 0.05, ∗∗p < 0.01, ∗∗∗p < 0.001, determined by one-way ANOVA test.
Figure 6
Figure 6
Arrhythmogenesis is positively correlated with leptin and NPY levels in coronary sinus blood from human patients with AF (A) Leptin concentrations in CS blood and PV blood were detected and compared. (B) Correlations between the PV or CS leptin concentrations and EAT thickness. (C) The coronary sinus leptin concentrations were detected and compared in patients without AF (n = 14), with paroxysmal AF (n = 22), or with persistent AF (n = 17). (D) Correlation between PV and CS NPY levels across all patients. (E) NPY concentrations in CS blood and PV blood were detected and compared (n = 53). (F) Correlation between EAT thickness and the CS NPY concentration. (G) Correlation between CS leptin and CS NPY concentrations. (H) The CS NPY concentrations were compared between AF patients with different disease severities. (I) Line-scan images of spontaneous Ca2+ transients and quantification of CMs from different groups of cells exhibiting irregular Ca2+ transients (n = 60 cells per group). Data are presented as the mean ± SEM. ns, not significant; ∗p < 0.05, ∗∗p < 0.01, ∗∗∗p < 0.001, determined by one-way ANOVA test.

References

    1. Thomas D., Christ T., Fabritz L., Goette A., Hammwöhner M., Heijman J., Kockskämper J., Linz D., Odening K.E., Schweizer P.A., et al. German Cardiac Society Working Group on Cellular Electrophysiology state-of-the-art paper: impact of molecular mechanisms on clinical arrhythmia management. Clin. Res. Cardiol. 2019;108:577–599. doi: 10.1007/s00392-018-1377-1. - DOI - PubMed
    1. Wong C.X., Sun M.T., Odutayo A., Emdin C.A., Mahajan R., Lau D.H., Pathak R.K., Wong D.T., Selvanayagam J.B., Sanders P., Clarke R. Associations of Epicardial, Abdominal, and Overall Adiposity With Atrial Fibrillation. Circ. Arrhythm. Electrophysiol. 2016;9 doi: 10.1161/CIRCEP.116.004378. - DOI - PubMed
    1. Shen M.J., Zipes D.P. Role of the autonomic nervous system in modulating cardiac arrhythmias. Circ. Res. 2014;114:1004–1021. doi: 10.1161/CIRCRESAHA.113.302549. - DOI - PubMed
    1. Hoang J.D., Salavatian S., Yamaguchi N., Swid M.A., David H., Vaseghi M. Cardiac sympathetic activation circumvents high-dose beta blocker therapy in part through release of neuropeptide Y. JCI Insight. 2020;5 doi: 10.1172/jci.insight.135519. - DOI - PMC - PubMed
    1. Wong C.X., Ganesan A.N., Selvanayagam J.B. Epicardial fat and atrial fibrillation: current evidence, potential mechanisms, clinical implications, and future directions. Eur. Heart J. 2017;38:1294–1302. doi: 10.1093/eurheartj/ehw045. - DOI - PubMed

MeSH terms