. 2024 May 21;5(5):101567.
doi: 10.1016/j.xcrm.2024.101567. Epub 2024 May 13.

IL-7-primed bystander CD8 tumor-infiltrating lymphocytes optimize the antitumor efficacy of T cell engager immunotherapy

Affiliations

IL-7-primed bystander CD8 tumor-infiltrating lymphocytes optimize the antitumor efficacy of T cell engager immunotherapy

Kun-Joo Lee et al. Cell Rep Med. .

Abstract

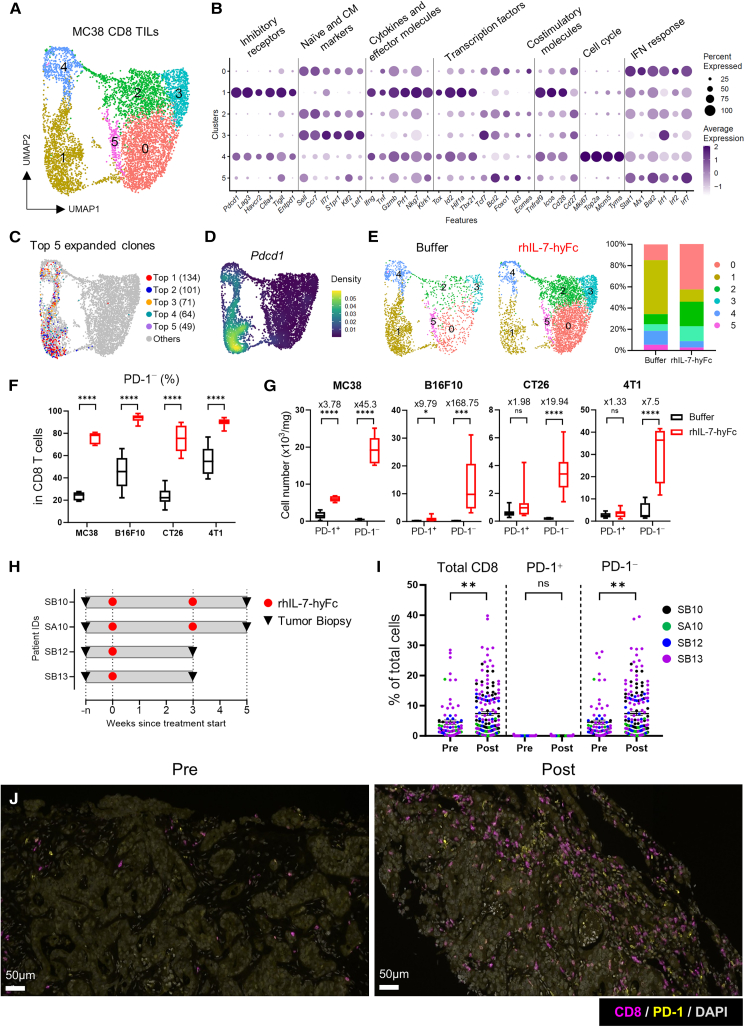
Bispecific T cell engagers (TCEs) show promising clinical efficacy in blood tumors, but their application to solid tumors remains challenging. Here, we show that Fc-fused IL-7 (rhIL-7-hyFc) changes the intratumoral CD8 T cell landscape, enhancing the efficacy of TCE immunotherapy. rhIL-7-hyFc induces a dramatic increase in CD8 tumor-infiltrating lymphocytes (TILs) in various solid tumors, but the majority of these cells are PD-1-negative tumor non-responsive bystander T cells. However, they are non-exhausted and central memory-phenotype CD8 T cells with high T cell receptor (TCR)-recall capacity that can be triggered by tumor antigen-specific TCEs to acquire tumoricidal activity. Single-cell transcriptome analysis reveals that rhIL-7-hyFc-induced bystander CD8 TILs transform into cycling transitional T cells by TCE redirection with decreased memory markers and increased cytotoxic molecules. Notably, TCE treatment has no major effect on tumor-reactive CD8 TILs. Our results suggest that rhIL-7-hyFc treatment promotes the antitumor efficacy of TCE immunotherapy by increasing TCE-sensitive bystander CD8 TILs in solid tumors.

Keywords: bispecific T cell engager; bystander CD8 T cell; cancer immunotherapy; combination therapy; interleukin-7; solid tumors; tumor microenvironment; tumor-infiltrating lymphocytes.


Conflict of interest statement

Declaration of interests M.L., S.-K.I., and D.C. are employees of the Research Institute of NeoImmuneTech, Inc., which supports the supply of rhIL-7-hyFc and its formulation buffer.

Figures

None
Graphical abstract
Figure 1
Figure 1
rhIL-7-hyFc treatment increases PD-1 bystander CD8 TILs (A‒E) scRNA-seq analysis of CD8 TILs. Mice bearing palpable MC38 tumors treated subcutaneously (s.c.) with rhIL-7-hyFc (10 mg kg−1). Tumors were collected 7 days after rhIL-7-hyFc treatment. Collected tumor tissues were pooled for analysis (n = 5–7 per group). Unless specified otherwise, the data include TILs from both buffer- and rhIL-7-hyFc-treated mice. (A) UMAP plots of six distinct CD8 TIL clusters from MC38-bearing mice, numbered and colored according to the transcriptional clusters. (B) Dot plot showing the expression of various T cell-related genes in the six different clusters. (C) UMAP plot of top five expanded clones. (D) UMAP showing the distribution of expression of Pdcd1 transcript. (E) UMAP showing CD8 TIL clusters from buffer- or rhIL-7-hyFc-treated mice (left) and bar graph depicting the proportion of six clusters in each treatment condition (right). (F and G) rhIL-7-hyFc (10 mg kg−1) were treated s.c. in mice bearing various palpable tumors. Tumors were collected 7 days after rhIL-7-hyFc treatment (n = 5–11 per group). (F) Frequency of PD-1 CD8 T cells among total CD8 TILs. (G) Number of PD-1+ CD8 T cells (left) and PD-1 CD8 T cells (right). Numbers on the bar indicate fold changes between buffer- and rhIL-7-hyFc-treated groups. Data are shown as mean ± SEM and representative of two independent experiments. (H) Schematic of clinical study design. Patients with metastatic colorectal and ovarian cancer were treated with rhIL-7-hyFc. Pre- and post-treatment tumor samples were collected during the screening period and at indicated time points. (I) Percentage of total CD8 T cells (left), PD-1+ CD8 T cells (middle), and PD-1 CD8 T cells (right) among the total cells. Each dot represents a single region of interest (ROI) in each patient’s sample. The ROIs were manually designated by pathologists. (J) Representative immunofluorescence images of tumor biopsies from patient SB13. Purple, CD8; yellow, PD-1; gray, DAPI. Magnification, ×200, scale bars, 50 μm ∗p < 0.05, ∗∗p < 0.01, ∗∗∗p < 0.001, and ∗∗∗∗p < 0.0001 by unpaired (F, G, and I) two-tailed Student’s t test. See also Figures S1; Table S1.
Figure 2
Figure 2
rhIL-7-hyFc treatment changes the transcriptome profiles of tumor-reactive and bystander CD8 TILs (A) UMAP of scTCR-seq data colored according to the clone size of expanded CD8 TILs from mice bearing MC38 tumors between groups (left) and a bar graph showing the proportion of CD8 TILs with each clone size between groups (right). (B) Number of DEGs in tumor-reactive and bystander CD8 TILs from tumor-bearing mice with rhIL-7-hyFc treatment compared with buffer treatment. (C) Top 5 enriched GO terms for up- or downregulated genes in tumor-reactive cells by rhIL-7-hyFc treatment. (D) Violin plots with an expression of genes related to T cell exhaustion, function, and TFs in tumor-reactive cells. (E) GSEA analysis with the gene set of exhausted vs. naive CD8 T cells (GEO: GSE9650), top TFs correlated with the dysfunctional program (Li et al.24), glycolysis (MSigDB: hallmark), and IFN-alpha response (MSigDB: hallmark) in tumor-reactive CD8 TILs. (F) Top 5 enriched GO terms for up- or downregulated genes in bystander cells by rhIL-7-hyFc treatment. (G) Violin plots with expression of genes related to ribosomal proteins, CM T cell, and T cell regulation in bystander cells. (H) GSEA analysis with the gene set of memory vs. exhausted CD8 T cells (GEO: GSE9650), positive regulation of TCR pathway (GO: 0050862), oxidative phosphorylation (MSigDB: hallmark), and IFN-alpha response (MSigDB: hallmark) in bystander CD8 TILs. Tumor-reactive cells are defined as cells with a clone size of 3 or greater, and bystander cells are defined as cells with a clone size of 1 or 2 and belonging to one of clusters 0, 2, 3, and 5. BIR., break-induced replication; DSBs., double-strand breaks; neg., negative; reg., regulation; sys., system; Pos., positive. See also Figures S2 and S3; Table S2.
Figure 3
Figure 3
TCE stimulation elicits tumoricidal activity of rhIL-7-hyFc-induced bystander CD8 TILs (A) Schematic protein structure of PD-L1×CD3 TCE. This figure was created with BioRender.com. (B) The cytotoxicity of PD-L1−/− splenocytes from naive PD-L1-deficient mice was evaluated. These splenocytes were co-cultured with CTV-labeled MC38WT or MC38ΔPD−L1 tumor cells in the presence of TCE at indicated concentrations for 48 h (n = 3 per group). (C‒F) Functional assay of PD-L1×CD3 TCE on rhIL-7-hyFc-induced tumor-reactive and bystander CD8 TILs (n = 3 per group). (C) Experimental scheme. (D) Expression of PD-1 and GzmB in PD-1+ or PD-1 CD8 T cells co-cultured with MC38 in the presence of TCE at indicated concentration (left) and frequencies of PD-1+GzmB+ cells among CD8 T cells. Black and blue dots indicate PD-1+ and PD-1 CD8 TILs before co-culture, respectively (right). (E) Frequencies of PD-1+Prf+ cells among CD8 T cells. (F) Cytotoxicity of PD-1+ and PD-1 CD8 T cells in the presence of TCE. The expression of ghost dye in tumor cells was measured by flow cytometry. CTV+Ghost dye+ cells are considered dead tumor cells. (G‒K) The functional changes and antitumor effects of rhIL-7-hyFc-expanded PD-1 bystander CD8 T cells were investigated (n = 5–7 per group). (G) Experimental scheme. MC38-bearing RAG1−/− mice were injected i.t. with 4 × 106 CD8+CD44+CD62L+PD-1 T cells sourced from the spleen and lymph nodes of C57BL/6 mice treated with rhIL-7-hyFc (10 mg kg−1). PD-L1×CD3 TCE (2 μg) or PBS was administered i.t. 5 times daily from the next day after T cell transfer. For flow cytometry analysis, tumors were collected 24 h after the second TCE treatment. (H) Average (left) and individual (right) tumor growth curves of MC38-bearing RAG1−/− mice. The timing of TCE or PBS administration is indicated by blue or gray columns, respectively. (I) Representative plots showing the expression of GzmB in CD8 T cells (left) and frequency of GzmB+ cells among CD8 T cells (right). (J) Representative plots showing the expression of Prf in CD8 T cells (left) and frequency of Prf+ cells among CD8 T cells (right). (K) Representative plots showing the expression of Ki-67 in CD8 T cells (left) and frequency of Ki-67+ cells among CD8 T cells (right). Data are shown as mean ± SEM and representative of two or three independent experiments (B, D-F, and H) or a summary of two independent experiments (I–K). ∗p < 0.05, ∗∗p < 0.01, ∗∗∗p < 0.001, and ∗∗∗∗p < 0.0001 by unpaired two-tailed Student’s t test (B, I, J, and K), by one-way ANOVA and Tukey’s multiple comparisons test (D–F), and by two-way ANOVA and Tukey’s multiple comparisons test (H). ns, not significant. See also Figures S3 and S4.
Figure 4
Figure 4
Combination therapy with rhIL-7-hyFc and TCE enhances antitumor responses (A‒D) Average (left) and individual (right) tumor growth after combination therapy in (A) palpable MC38, (B) palpable B16F10, (C) advanced MC38, and (D) palpable CT26hHER2 tumor models (n = 6–8 per group). Mice were s.c. treated with 1.25 mg kg−1 (A, C, and D) or 10 mg kg−1 (B) of rhIL-7-hyFc when the tumor was considered palpable (A, B, and D) or advanced (C). And then 0.4 μg of PD-L1×CD3 TCE (A and B), 1 μg of PD-L1×CD3 TCE (C), or 0.4 μg of HER2×CD3 TCE (D) was administered five times daily 3 days after rhIL-7-hyFc treatment. TCEs were injected intravenously (i.v.) for (A), (B), and (D) and i.t. for (C). The administration of rhIL-7-hyFc and TCE is indicated by red lines and blue columns, respectively. Data are shown as mean ± SEM and representative of two or three independent experiments. ∗p < 0.05, ∗∗p < 0.01, ∗∗∗p < 0.001, and ∗∗∗∗p < 0.0001 by two-way ANOVA and Tukey’s multiple comparisons test. See also Figures S5 and S6.
Figure 5
Figure 5
TCE combination promotes the cytotoxic activity of rhIL-7-hyFc-induced bystander CD8 TILs (A) Experimental scheme. Mice bearing palpable MC38 tumors were injected s.c. with rhIL-7-hyFc (1.25 mg kg−1). Three days after rhIL-7-hyFc treatment, mice were treated i.v. with PD-L1×CD3 TCE (0.4 μg) 2 times daily. Twenty-four hours after the last treatment, mice were analyzed for TILs (n = 4–6 per group). (B) Frequencies (left) and numbers (right) of CD8 T, CD4 Treg, CD4 non-Treg, and NK cells. (C) Frequencies of PD-1 cells (left) and numbers of PD-1+ and PD-1 cells among the total CD8 T cells (right). (D) Representative plots showing the expression of CD44 and CD62L in PD-1 CD8 T cells. (E) Frequencies of CD44+CD62L+ (left) and CD44+CD62L (right) cells among PD-1 CD8 T cells. (F, H, and I) Frequencies (left) and numbers (right) of GzmB+ cells (F), Prf+ cells (H), and Ki-67+ cells (I) among PD-1 CD8 T cells. (G) Histogram of GzmB expression in PD-1 CD8 T cells (left) and fold change of GzmB geometric mean fluorescence intensity (gMFI) compared with the buffer group in PD-1 CD8 T cells. Data are shown as mean ± SEM and summary of two independent experiments (B, C, F, G, and I) or representative of two independent experiments (E and H). ∗p < 0.05, ∗∗p < 0.01, ∗∗∗p < 0.001, and ∗∗∗∗p < 0.0001 by one-way ANOVA and Tukey’s multiple comparisons test. ns, not significant. See also Figures S7 and S8.
Figure 6
Figure 6
Transcriptome analysis of CD8 TIL subsets in combination therapy scRNA-seq results of CD8 TILs from mice bearing MC38 tumors treated with rhIL-7-hyFc alone or a combination of rhIL-7-hyFc and TCE. C57BL/6 mice bearing palpable MC38 tumors were injected s.c. with rhIL-7-hyFc (1.25 mg kg−1). Three days after rhIL-7-hyFc treatment, mice were treated i.v. with PD-L1×CD3 TCE (0.4 μg) three times daily. Tumors were collected 24 h after the last treatment. Collected tumor tissues were pooled for analysis (n = 12 rhIL-7-hyFc and n = 24 combination). (A) UMAP plot showing each CD8 TIL cluster. (B) Supervised clustering of CD8 TILs according to gene-expression characteristics (left) and bar graph depicting the proportion of three CD8 TIL subclusters in each treatment condition (right). (C) Heatmap showing the DEGs between supervised groups. (D) Featured plots showing the expression of Pdcd1 (left) and Tcf7 (right) genes. (E) UMAP plot of top six most expanded clones. (F) Number of DEGs in each supervised CD8 TIL subcluster from mice with combination therapy compared with the rhIL-7-hyFc-treated group. (G) Dot plots of GO enrichment analysis of upregulated DEGs by combination therapy in each CD8 TIL subcluster. (H) Violin plots showing the expression of genes related to exhaustion, CM-associated, cytotoxicity, T cell activation, glycolysis, and cell motility. See also Figures S9 and S10; Table S3.

References

    1. Raskov H., Orhan A., Christensen J.P., Gögenur I. Cytotoxic CD8(+) T cells in cancer and cancer immunotherapy. Br. J. Cancer. 2021;124:359–367. doi: 10.1038/s41416-020-01048-4. - DOI - PMC - PubMed
    1. Chen D.S., Mellman I. Oncology meets immunology: the cancer-immunity cycle. Immunity. 2013;39:1–10. doi: 10.1016/j.immuni.2013.07.012. - DOI - PubMed
    1. Ribas A., Wolchok J.D. Cancer immunotherapy using checkpoint blockade. Science. 2018;359:1350–1355. doi: 10.1126/science.aar4060. - DOI - PMC - PubMed
    1. Larkin J., Chiarion-Sileni V., Gonzalez R., Grob J.J., Rutkowski P., Lao C.D., Cowey C.L., Schadendorf D., Wagstaff J., Dummer R., et al. Five-Year Survival with Combined Nivolumab and Ipilimumab in Advanced Melanoma. N. Engl. J. Med. 2019;381:1535–1546. doi: 10.1056/NEJMoa1910836. - DOI - PubMed
    1. Chowell D., Morris L.G.T., Grigg C.M., Weber J.K., Samstein R.M., Makarov V., Kuo F., Kendall S.M., Requena D., Riaz N., et al. Patient HLA class I genotype influences cancer response to checkpoint blockade immunotherapy. Science. 2018;359:582–587. doi: 10.1126/science.aao4572. - DOI - PMC - PubMed

MeSH terms