. 2024 Jun 6;111(6):1184-1205.
doi: 10.1016/j.ajhg.2024.04.014. Epub 2024 May 13.

Missense variants in ANO4 cause sporadic encephalopathic or familial epilepsy with evidence for a dominant-negative effect

Affiliations

Missense variants in ANO4 cause sporadic encephalopathic or familial epilepsy with evidence for a dominant-negative effect

Fang Yang et al. Am J Hum Genet. .

Abstract

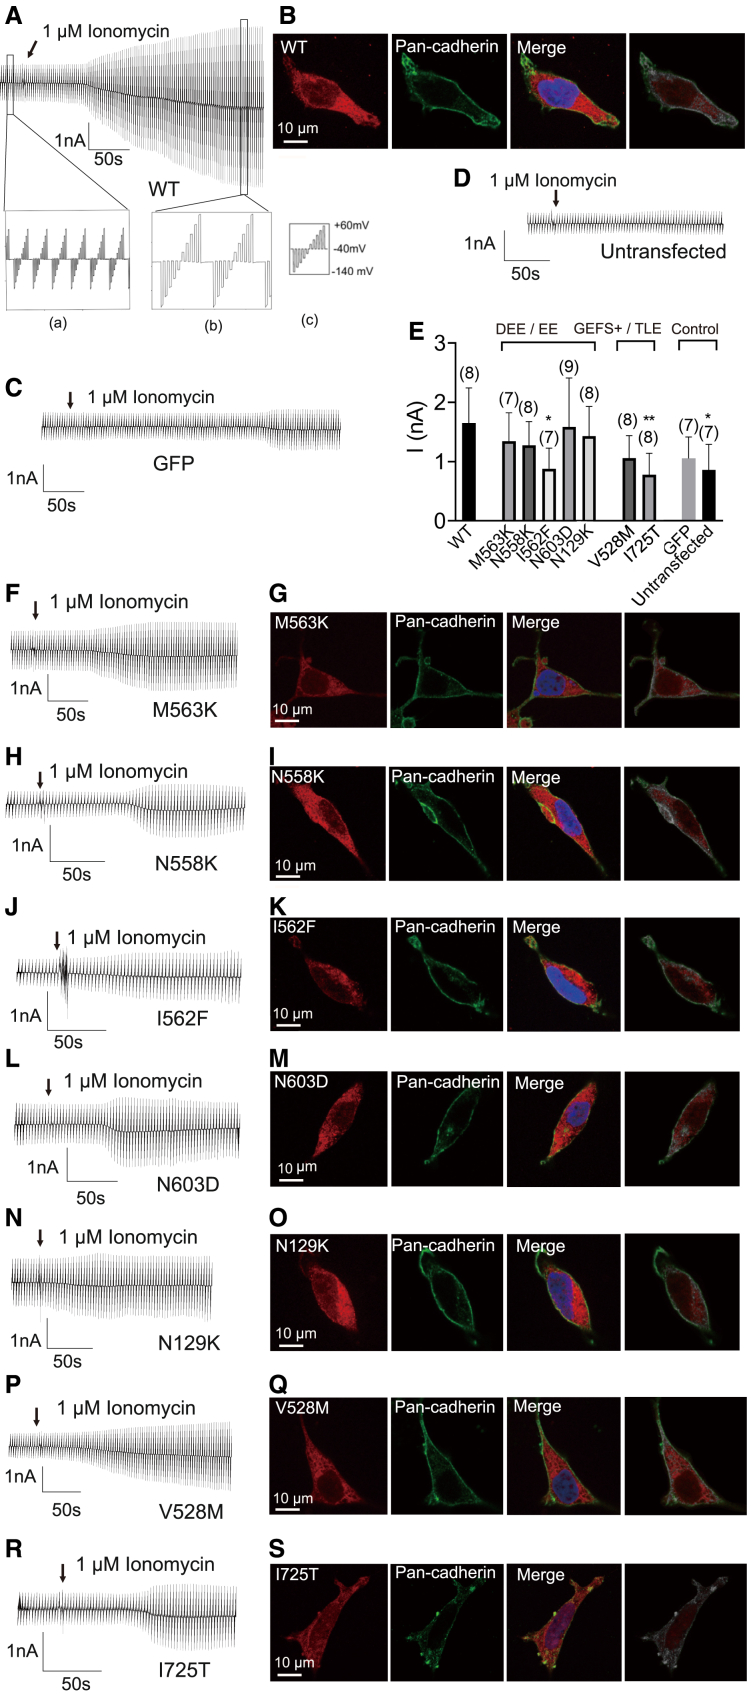
Anoctamins are a family of Ca2+-activated proteins that may act as ion channels and/or phospholipid scramblases with limited understanding of function and disease association. Here, we identified five de novo and two inherited missense variants in ANO4 (alias TMEM16D) as a cause of fever-sensitive developmental and epileptic or epileptic encephalopathy (DEE/EE) and generalized epilepsy with febrile seizures plus (GEFS+) or temporal lobe epilepsy. In silico modeling of the ANO4 structure predicted that all identified variants lead to destabilization of the ANO4 structure. Four variants are localized close to the Ca2+ binding sites of ANO4, suggesting impaired protein function. Variant mapping to the protein topology suggests a preliminary genotype-phenotype correlation. Moreover, the observation of a heterozygous ANO4 deletion in a healthy individual suggests a dysfunctional protein as disease mechanism rather than haploinsufficiency. To test this hypothesis, we examined mutant ANO4 functional properties in a heterologous expression system by patch-clamp recordings, immunocytochemistry, and surface expression of annexin A5 as a measure of phosphatidylserine scramblase activity. All ANO4 variants showed severe loss of ion channel function and DEE/EE associated variants presented mild loss of surface expression due to impaired plasma membrane trafficking. Increased levels of Ca2+-independent annexin A5 at the cell surface suggested an increased apoptosis rate in DEE-mutant expressing cells, but no changes in Ca2+-dependent scramblase activity were observed. Co-transfection with ANO4 wild-type suggested a dominant-negative effect. In summary, we expand the genetic base for both encephalopathic sporadic and inherited fever-sensitive epilepsies and link germline variants in ANO4 to a hereditary disease.

Keywords: ANO4; Ca(2+)-dependent ion channel; GEFS+; TMEM16D; anoctamin; developmental and epileptic encephalopathy; phospholipid scramblase; temporal lobe epilepsy.


Conflict of interest statement

Declaration of interests K.H. is currently employed by Janssen Research & Development, Janssen Pharmaceutica N.V., Turnhoutseweg 30, Beerse B-2340, Belgium.

Figures

Figure 1
Figure 1
Morphology of individuals with ANO4 variants Facial appearances of four individuals with de novo variants in ANO4 associated with DEE or EE (I1 at age 12 months and 12 years 2 months, I2 at age 15 months, I4 at age 9 years, 18 years, and 20 years, respectively, and I5 at age 22 years 9 months) and hands/feet of three individuals (I1 at age 12 years 2 months, I2 at age 15 months, and I5 at age 22 years 9 months).
Figure 2
Figure 2
Membrane topology and 3D structure of ANO4 indicating the disease-associated variants and selected population variants (A) Membrane topology of ANO4 based on experimental data in the N. haematococca ortholog, drawn using Biorender software. The TMs numbered from 1 to 10 are represented with barrels and located in the plasma membrane. The N-terminal dimerization domain is labeled in turquois. The disease-associated variants are colored according to the phenotype: Asn558Lys (N558K), Ile562Phe (I562F), Met563Lys (M563K) in red with DEE; Asn603Asp (N603D) and Asn129Lys (N129K) in orange with EE; and Val528Met (V528M) and Ile725Thr (I725T) in blue with TLE/GEFS+. The most frequent population variants with deleterious in silico predictions Gly115Ala (G115A), Ala535Thr (A535T), Tyr707Cys (Y707C), and Ala728Thr (A728T) are depicted in gray. (B) Overall structure of the ANO4 dimer with the subunits shown as white and purple ribbon. Residues affected by mutation are shown in yellow space-filled presentation and are labeled for one subunit. The position of bound Ca2+ ions is indicated by green balls. The disordered residues 1–40 have been omitted for clarity. (C) Enlargement of the ANO4 region that represents a mutational hotspot in the present study. The residues affected by mutation are shown in space-filled representation (atom-type coloring) and are labeled. The position of adjacent Ca2+ ions is indicated by green balls.
Figure 3
Figure 3
Analysis of the Ca2+-dependent cation conductance of heterologously expressed wild-type and mutant ANO4 (A) Raw current recording in HEK293 cells expressing wild-type ANO4 before and after application of ionomycin (1 μM; arrow); (a): the baseline currents before ionomycin application, (b): the currents after the application of 1 μM ionomycin, (c): stimulation protocol with 10 voltage steps between −140 mV and +60 mV, for a duration of 50 ms applied every 2.5 s. (B) Immunostaining of a HEK293 cell expressing wild-type ANO4 against ANO4 (red) and the membrane marker pan-cadherin (green). From the left panel: ANO4 only, pan-cadherin only, merged ANO4 and pan-cadherin, and display of pixels that co-localize red and green in white. (C and D) Control experiments using cells expressing GFP (C) and untransfected cells (D). Raw currents before and after application of ionomycin (arrow). (E, F, H, J, L, N, P, and R) Summary of maximal current amplitudes estimated from a voltage difference between −120 mV and +60 mV measured before application of ionomycin to compare basal membrane conductance between controls, wild-type ANO4, and seven mutant ANO4. Raw currents measured in a cell expressing ANO4 mutants Met563Lys (M563K; F), Asn558Lys (N558K; H), Ile562Phe (I562F; J), Asn603Asp (N603D; L), Asn129Lys (N129K; N), Val528Met (V528M; P), or Ile725Thr (I725T; R) before and after ionomycin application (arrow). (G, I, K, M, O, Q, and S) Immunostaining of a HEK293 cell expressing ANO4 mutants Met563Lys (M563K; G), Asn558Lys (N558K; I), Ile562Phe (I562F; K), Asn603Asp (N603D; M), Asn129Lys (N129K; O), Val528Met (V528M; Q), or Ile725Thr (I725T; S) with antibody against ANO4 (red) and the membrane marker pan-cadherin (green). From the left panel: ANO4 only, pan-cadherin only, merged ANO4 and pan-cadherin, and display of pixels that co-localize red and green in gray. Values are given as mean ± SEM. Multiple comparisons were performed by ANOVA with Dunn’s post hoc test. Data points that were statistical outliers were eliminated by the Grubbs outlier test. p < 0.05; ∗∗p < 0.01; n is given in parentheses. DAPI was used to counterstain the nucleus (blue) in (B, G, I, K, M, O, Q, and S).
Figure 4
Figure 4
Comparison of ANO4-dependent membrane conductance and ANO4 surface expression (A) Comparison of changes in membrane conductance estimated as currents of a voltage difference between −140 mV and +60 mV from cells with different conditions of heterologous expression after reaching a maximal steady-state level of the ionomycin effect, given as fold increase from baseline. (B) Comparison of Pearson’s correlation coefficient (PCC) of ANO4 and pan-cadherin positive pixels from immunostainings of HEK293 cells expressing ANO4 wild-type or mutants Met563Lys (M563K), Asn558Lys (N558K), Ile562Phe (I562F), Asn603Asp (N603D), Asn129Lys (N129K), Val528Met (V528M), or Ile725Thr (I725T). Values are given as mean ± SEM. Multiple comparisons were performed by ANOVA with Dunn’s post hoc test. Data points that were statistical outliers were eliminated by the Grubbs outlier test. p < 0.05; ∗∗∗∗p < 0.0001; ns, not significant; n is given in parentheses; in (B), n gives the number of analyzed cells from three independent experiments.
Figure 5
Figure 5
The Ca2+-dependent cation current elicited by heterologously expressed mutant ANO4 is blocked by the application of the flufenamic acid (A–C, G–I, and M–O) When ionomycin-mediated current density of HEK293 cells expressing wild-type or mutant ANO4 reached its peak, the flufenamic acid (100 μM) was applied to the bath solution (arrows). Raw current recordings of cells before and after the application of ionomycin and flufenamic acid (FFA) are shown. The HEK293 cells over-expressing wild-type ANO4 (A) showed increased current density after extracellular application of 1 μM ionomycin, which can be blocked by 100 μM FFA; the same result can be observed in the cells expressing ANO4 with the mutations Met563Lys (M563K; B), Asn558Lys (N558K; C), Ile562Phe (I562F; G), Asn603Asp (N603D; H), Asn129Lys (N129K; I), Val528Met (V528M; M), and Ile725Thr (I725T; N). GFP alone transfected cells in (O). (D–F, J–L, and P–R) X axis indicates the baseline, presence of ionomycin and flufenamic acid; y axis shows the raw currents in nanoampere (nA). Effects of ionomycin and flufenamic acid (FFA) on each cell can be seen. The effect plots from HEK293 cells expressing ANO4 wild-type (D), ANO4 mutant Met563Lys (M563K; E), Asn558Lys (N558K; F), Ile562Phe (I562F; J), Asn603Asp (N603D; K), Asn129Lys (N129K; L), Val528Met (V528M; P), Ile725Thr (I725T; Q), and cells transfected with GFP alone (R).
Figure 6
Figure 6
Co-localization of wild-type and mutant ANO4 with the early endosome marker EEA1 in HEK293 cells (A–H) HEK293 cells expressing wild-type (A) and various mutated ANO4 constructs were stained with antibodies for ANO4 (left, red) and EEA1 (left-middle, yellow). Merged images (right-middle) show the co-localization of mutant ANO4 and EEA1. The gray dot images (right) represent the density of co-localization of mutant ANO4 and EEA1. Nuclei were stained with DAPI. ANO4 mutants included Met563Lys (M563K; B), Asn558Lys (N558K; C), Ile562Phe (I562F; D), Asn603Asp (N603D; E), Asn129Lys (N129K; F), Val528Met (V528M; G) and Ile725Thr (I725T; H). Scale bar represents 10 μm. (I) PCC analysis of EEA1 and mutant ANO4 (transfection and immunostaining according to A–H). The number inside the parentheses represents n per group. Whiskers represent SEM. Values are given as mean ± SEM. Multiple comparisons were performed by ANOVA with Dunn’s post hoc test. Data points that were statistical outliers were eliminated by the Grubbs outlier test. ∗∗∗p < 0.001; ∗∗∗∗p < 0.0001; ns, not significant; the number in parentheses represents the number of analyzed cells from three independent experiments.
Figure 7
Figure 7
Scramblase activity in HEK293 cells expressing wild-type or mutant ANO4 at physiological Ca2+ levels (A–I) Scramblase activity was assessed by FACS sorting of annexin A5-labeled HEK293 cells that were not treated by ionomycin and transfected with GFP alone (A), with wildtype ANO4 plus GFP (B) and ANO4 mutants plus GFP under control conditions. ANO4 mutants included Met563Lys (M563K; C), Asn558Lys (N558K; D), Ile562Phe (I562F; E), Asn603Asp (N603D; F), Asn129Lys (N129K; G), Val528Met (V528M; H), and Ile725Thr (I725T; I). X axis indicates fluorescence intensity of Anx A5-6S-IDCC (log); y axis indicates fluorescence intensity of GFP (log). The right-upper square represents the ANO4 transfected, annexin A5-positive cell fraction. (J) Comparison of annexin A5 surface expression between different transfection conditions. The experiments were carried out four times (n = 4). Values are given as mean ± SEM. Multiple comparisons were performed by ANOVA with Dunn’s post hoc test. Data points that were statistical outliers were eliminated by the Grubbs outlier test. p < 0.05; ∗∗p < 0.01.
Figure 8
Figure 8
Ca2+-dependent scramblase activity in HEK293 cells expressing wild-type or mutant ANO4 Ca2+-dependent scramblase activity was assessed by FACS sorting of annexin A5-labeled HEK293 cells that were incubated with ionomycin (Iono, 1 μM) for 10 min and prior to the experiment transfected with GFP alone (A), with wild-type ANO4 plus GFP (B), and ANO4 mutations plus GFP: Met563Lys (M563K; C), Asn558Lys (N558K; D), Ile562Phe (I562F; E), Asn603Asp (N603D; F), Asn129Lys (N129K; G), Val528Met (V528M; H), and Ile725Thr (I725T; I). X axis indicates fluorescence intensity of annexin A5-6S-IDCC (log); y axis indicates fluorescence intensity of GFP (log). The right-upper square represents the ANO4 transfected, annexin A5-positive cell fraction. (J) Comparison of annexin A5 surface expression between different transfection conditions. The experiments were carried out four times (n = 4). Values are given as mean ± SEM. Multiple comparisons were performed by ANOVA with Dunn’s post hoc test. Data points that were statistical outliers were eliminated by the Grubbs outlier test. ns, not significant
Figure 9
Figure 9
ANO4 currents and ion channel surface expression in co-expression experiments HEK293 cells were co-transfected with either wild-type and DEE mutant Asn558Lys (N588K) or wild-type and GEFS+ mutant Val528Met (V528M) ANO4 and compared to wild-type or mutant transfection alone. (A and B) (A) Raw current recording in HEK293 cells expressing wild-type ANO4 before and after application of ionomycin (1 μM; arrow) and (B) in wild-type/Val528Met and wild-type/Asn558Lys co-expression. (C and D) Immunostaining of a HEK293 cell co-expressing wild-type/Val528Met or wild-type/Asn558Lys against ANO4 (red) and the membrane marker pan-cadherin (green); from the top: ANO4 only, pan-cadherin only, merged ANO4 and pan-cadherin. (E and F) (E) Comparison of peak current densities at physiological Ca2+ conditions from cells with different transfection paradigm and (F) changes in membrane conductance after reaching a maximal steady-state level of the ionomycin effect; given as fold increase from baseline. (G) Comparison of Pearson’s correlation coefficient (PCC) of ANO4 and pan-cadherin-positive pixels from immunostainings of HEK293 cells expressing wild-type alone, mutant alone, or co-expressing wild-type/Val528Met or wild-type/Asn558Lys. Values are given as mean ± SEM. Multiple comparisons were performed by ANOVA with Dunn’s post hoc test. Data points that were statistical outliers were eliminated by the Grubbs outlier test. n is given in parentheses. p < 0.05; ∗∗p < 0.01; ∗∗∗p < 0.001; ∗∗∗∗p < 0.0001; ns, not significant.

References

    1. Sheidley B.R., Malinowski J., Bergner A.L., Bier L., Gloss D.S., Mu W., Mulhern M.M., Partack E.J., Poduri A. Genetic testing for the epilepsies: A systematic review. Epilepsia. 2022;63:375–387. doi: 10.1111/epi.17141. - DOI - PubMed
    1. Grether A., Ivanovski I., Russo M., Begemann A., Steindl K., Abela L., Papik M., Zweier M., Oneda B., Joset P., Rauch A. The current benefit of genome sequencing compared to exome sequencing in patients with developmental or epileptic encephalopathies. Mol. Genet. Genomic Med. 2023;11 doi: 10.1002/mgg3.2148. - DOI - PMC - PubMed
    1. Musante L., Costa P., Zanus C., Faletra F., Murru F.M., Bianco A.M., La Bianca M., Ragusa G., Athanasakis E., d'Adamo A.P., et al. The Genetic Diagnosis of Ultrarare DEEs: An Ongoing Challenge. Genes. 2022;13 doi: 10.3390/genes13030500. - DOI - PMC - PubMed
    1. Papuc S.M., Abela L., Steindl K., Begemann A., Simmons T.L., Schmitt B., Zweier M., Oneda B., Socher E., Crowther L.M., et al. The role of recessive inheritance in early-onset epileptic encephalopathies: a combined whole-exome sequencing and copy number study. Eur. J. Hum. Genet. 2019;27:408–421. doi: 10.1038/s41431-018-0299-8. - DOI - PMC - PubMed
    1. Brunner J.D., Lim N.K., Schenck S., Duerst A., Dutzler R. X-ray structure of a calcium-activated TMEM16 lipid scramblase. Nature. 2014;516:207–212. doi: 10.1038/nature13984. - DOI - PubMed

Publication types

LinkOut - more resources