. 2024 Jun 25;34(5):740-756.
doi: 10.1101/gr.277843.123.

Semiconservative transmission of DNA N 6-adenine methylation in a unicellular eukaryote

Affiliations

Semiconservative transmission of DNA N 6-adenine methylation in a unicellular eukaryote

Yalan Sheng et al. Genome Res. .

Abstract

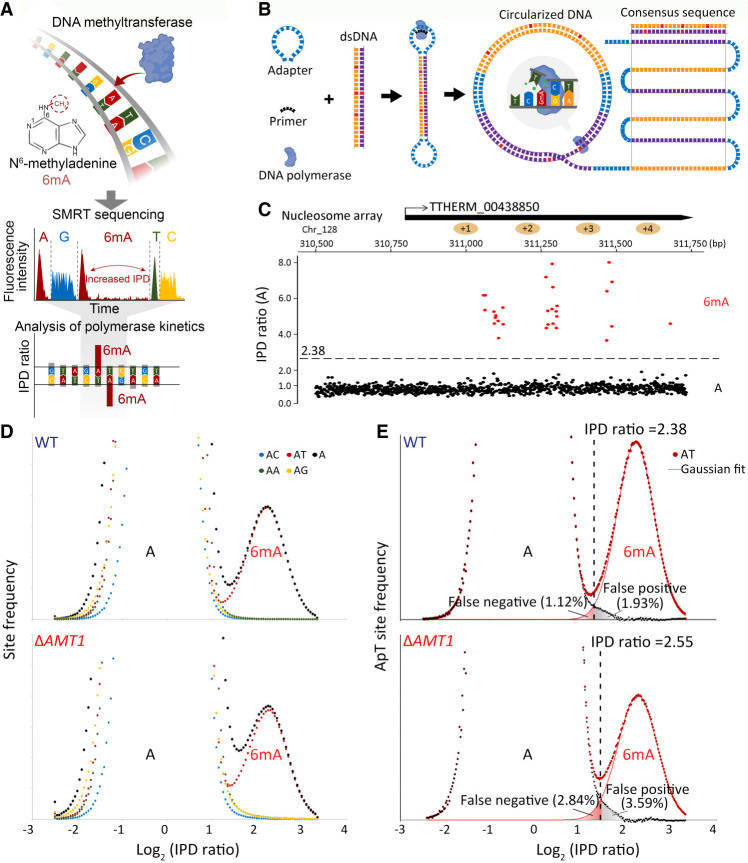
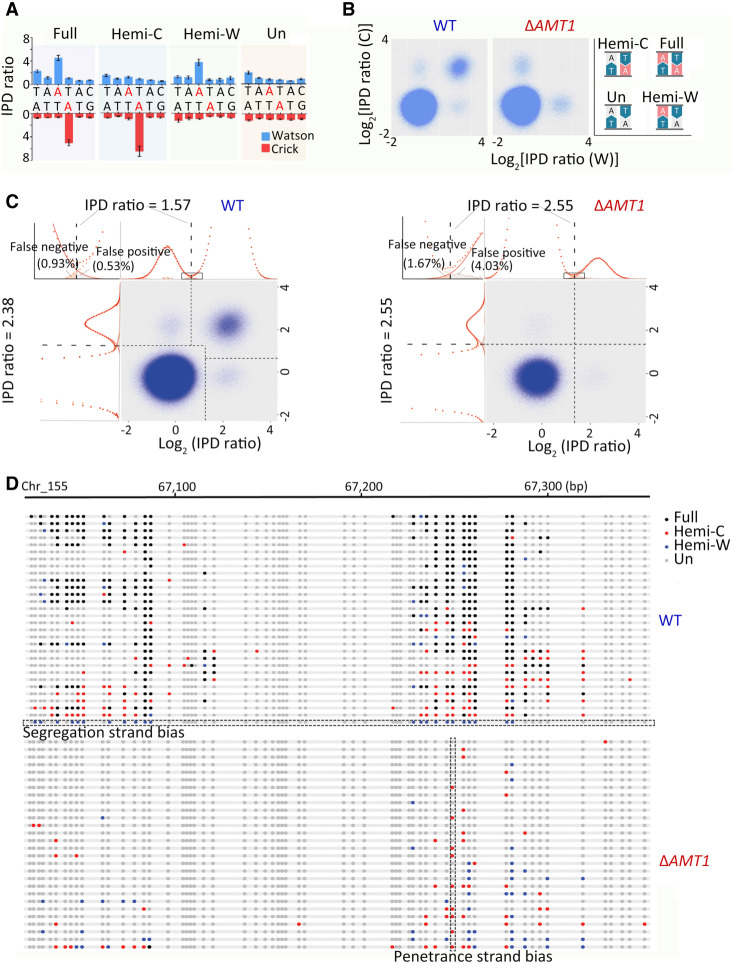
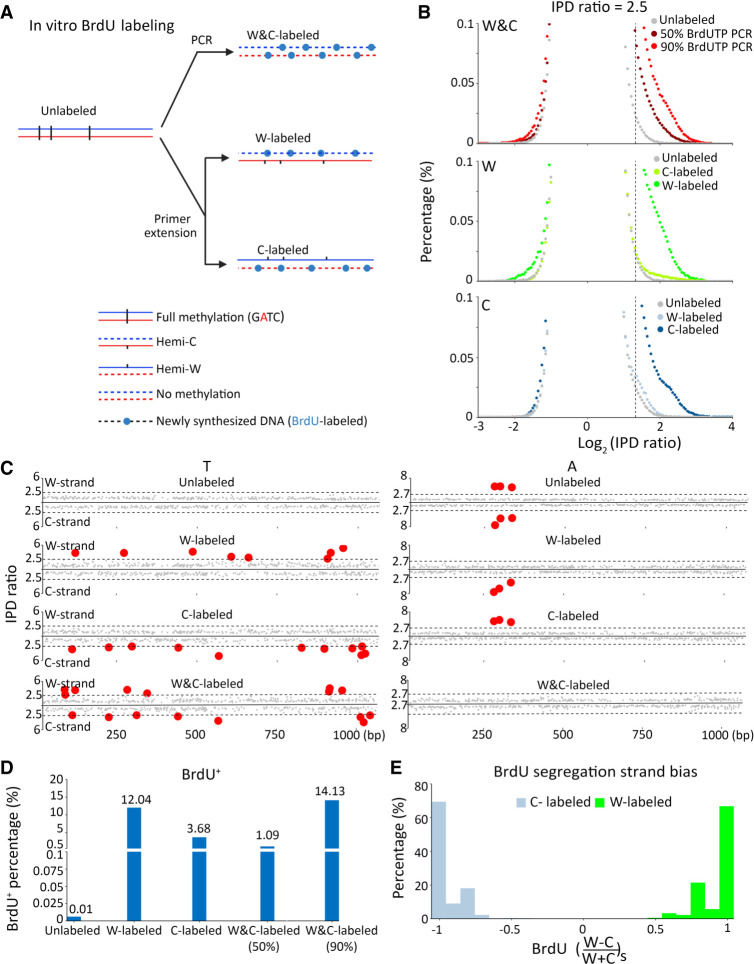
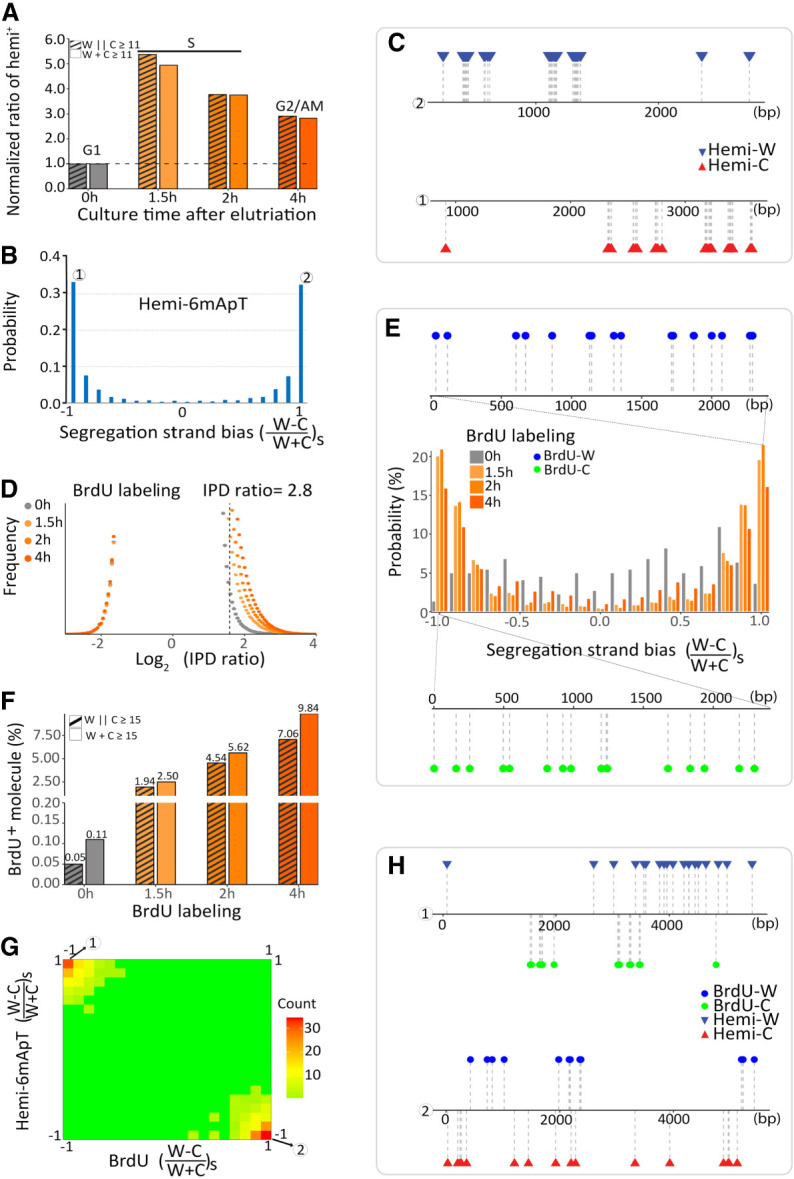
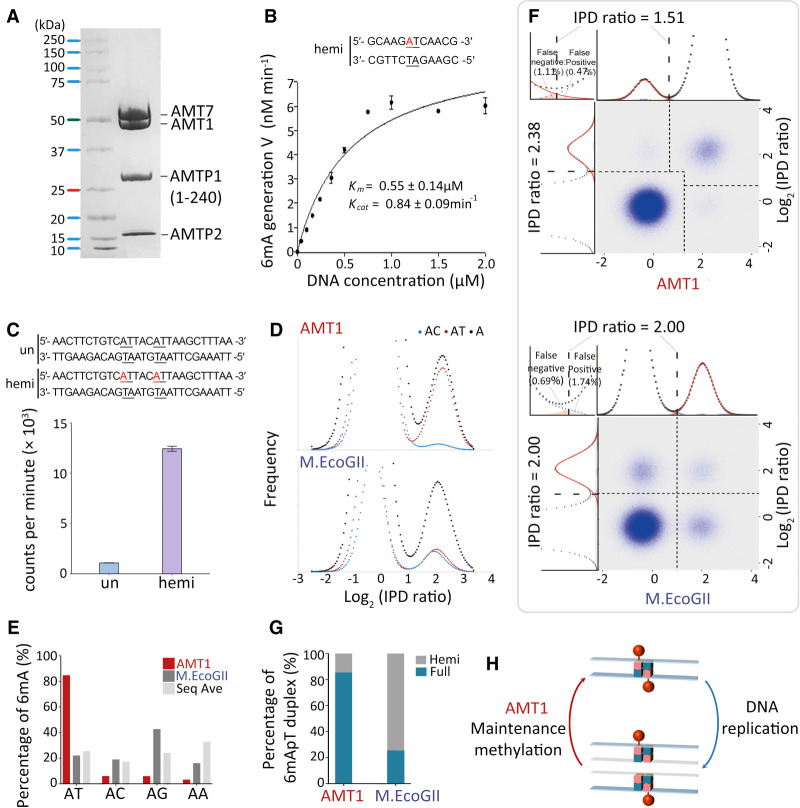
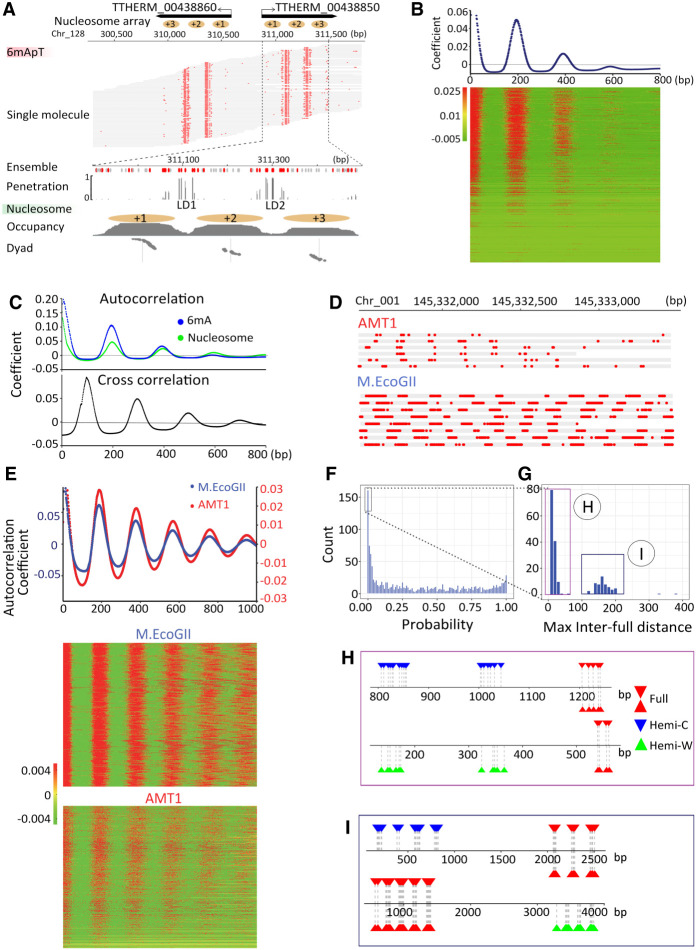
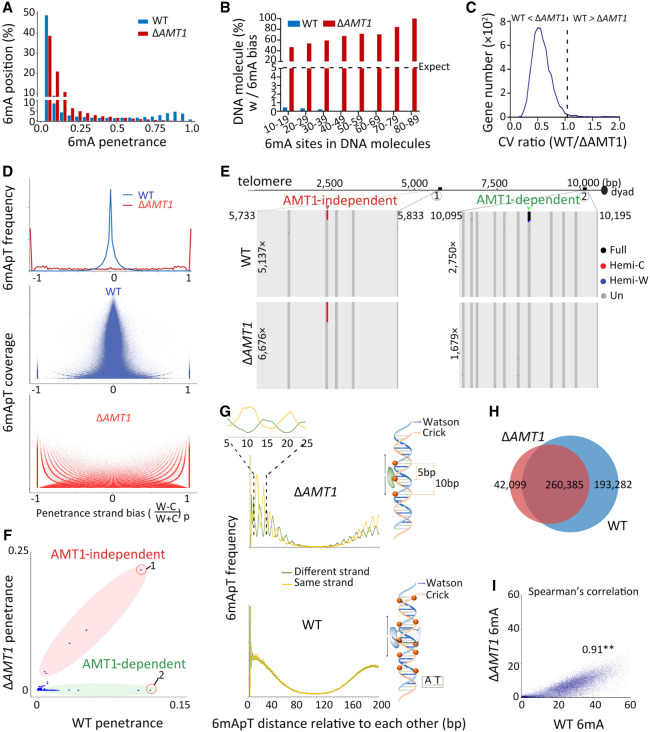
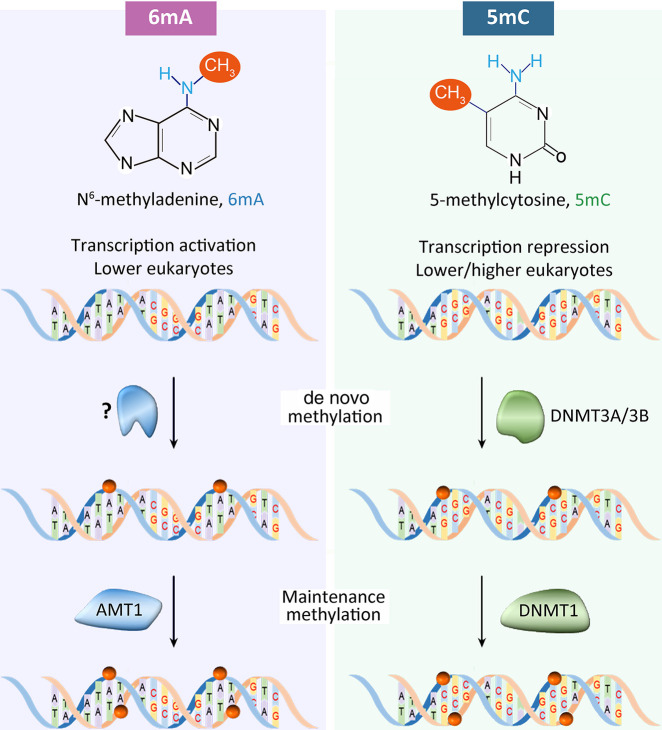
Although DNA N 6-adenine methylation (6mA) is best known in prokaryotes, its presence in eukaryotes has recently generated great interest. Biochemical and genetic evidence supports that AMT1, an MT-A70 family methyltransferase (MTase), is crucial for 6mA deposition in unicellular eukaryotes. Nonetheless, the 6mA transmission mechanism remains to be elucidated. Taking advantage of single-molecule real-time circular consensus sequencing (SMRT CCS), here we provide definitive evidence for semiconservative transmission of 6mA in Tetrahymena thermophila In wild-type (WT) cells, 6mA occurs at the self-complementary ApT dinucleotide, mostly in full methylation (full-6mApT); after DNA replication, hemi-methylation (hemi-6mApT) is transiently present on the parental strand, opposite to the daughter strand readily labeled by 5-bromo-2'-deoxyuridine (BrdU). In ΔAMT1 cells, 6mA predominantly occurs as hemi-6mApT. Hemi-to-full conversion in WT cells is fast, robust, and processive, whereas de novo methylation in ΔAMT1 cells is slow and sporadic. In Tetrahymena, regularly spaced 6mA clusters coincide with the linker DNA of nucleosomes arrayed in the gene body. Importantly, in vitro methylation of human chromatin by the reconstituted AMT1 complex recapitulates preferential targeting of hemi-6mApT sites in linker DNA, supporting AMT1's intrinsic and autonomous role in maintenance methylation. We conclude that 6mA is transmitted by a semiconservative mechanism: full-6mApT is split by DNA replication into hemi-6mApT, which is restored to full-6mApT by AMT1-dependent maintenance methylation. Our study dissects AMT1-dependent maintenance methylation and AMT1-independent de novo methylation, reveals a 6mA transmission pathway with a striking similarity to 5-methylcytosine (5mC) transmission at the CpG dinucleotide, and establishes 6mA as a bona fide eukaryotic epigenetic mark.


Figures

Figure 1.
Figure 1.
Exclusive methylation at the ApT dinucleotide in Tetrahymena. (A) Overview of 6mA detection by SMRT sequencing. (B) A schematic diagram for SMRT CCS. (C) IPD ratios (IPDr) for all A sites in a typical SMRT CCS read mapped to the Tetrahymena MAC reference genome. The IPDr threshold was set at 2.38, separating 6mA from unmodified A. Note the localization of 6mA clusters in linker DNA between the canonical nucleosome array within the gene body. (D) IPDr distributions (log2) of all A sites in wild-type (WT) (top) and ΔAMT1 cells (bottom). Also plotted were distributions for A sites at the ApA, ApC, ApG, and ApT dinucleotide, respectively. (E) Deconvolution of the 6mA peak and the unmodified A peak for IPDr distributions (log2) at the ApT dinucleotide. Note the low false positive and false negative rates of 6mA calling in WT (top) and ΔAMT1 cells (bottom).
Figure 2.
Figure 2.
Distinguishing hemi- and full-6mApT. (A) Four states of ApT duplexes: full methylation, hemi-W, hemi-C, and unmethylated, distinguished by IPDr of adenine sites on W and C, respectively. (B) Distribution of ApT duplexes according to IPDr of adenine sites on W and C, respectively. Note the abundance of the full methylation state in WT and its absence in ΔAMT1 cells. (C) Demarcation of the four methylation states of ApT duplexes in WT (left) and ΔAMT1 cells (right) by their IPDr on W and C, respectively. (Left) For bulk ApT duplexes, the IPDr threshold for 6mA calling was set at 2.38, according to deconvolution based on Gaussian fitting of the small 6mA peak. For ApT duplexes with one 6mA as defined above, the IPDr threshold for calling 6mA on the opposite strand was set at 1.57, according to deconvolution based on Gaussian fitting of the small unmodified A peak. (Right) For bulk ApT duplexes, the IPDr threshold for 6mA calling was set at 2.55, according to deconvolution based on Gaussian fitting of the small 6mA peak. For ApT duplexes with one 6mA as defined above, the IPDr threshold for calling 6mA on the opposite strand was also set at 2.55, according to deconvolution based on Gaussian fitting of the small 6mA peak. (D) Typical DNA molecules from Tetrahymena WT (top) and ΔAMT1 cells (bottom). Note ApT duplexes with distinct methylation states (colored dots) distributed along individual DNA molecules (gray line). A DNA molecule with strong segregation strand bias in WT cells and a genomic position with strong penetrance strand bias in ΔAMT1 cells were marked.
Figure 3.
Figure 3.
SMRT CCS detection of BrdU incorporation into newly synthesized DNA. (A) In vitro BrdU labeling. Specific labeling of either strand (W-labeled or C-labeled) was achieved by primer extension, whereas labeling of both strands (W&C-labeled) was achieved by PCR. A plasmid fragment containing three fully methylated GATC sites (6mA) was used as the template, as well as the unlabeled control for SMRT CCS. (B) IPDr distributions (log2) of all T sites from: both strands in unlabeled and W&C-labeled DNA (50% or 90% BrdUTP; top); only W in unlabeled, W-labeled, and C-labeled DNA (middle); only C in unlabeled, W-labeled, and C-labeled DNA (bottom). IPDr threshold was set at 2.5 for separating BrdU from T. (C) IPDr for all T (left) or A sites (right) in typical SMRT CCS reads for unlabeled, W-labeled, C-labeled, and W&C-labeled DNA (90% BrdUTP). IPDr thresholds were set at 2.5 for separating BrdU from T, and at 2.7 for separating 6mA from A. (D) Percentage of BrdU+ molecules in unlabeled, W-labeled, C-labeled, and W&C-labeled DNA (50% and 90% BrdUTP, respectively). BrdU+ molecules were defined as DNA molecules with no less than eight BrdU sites on one strand (W||C ≥ 8). (E) Segregation strand biases of BrdU sites in BrdU+ molecules. Segregation strand bias for BrdU was defined as the difference-sum ratio between BrdU sites on W and C: [(W − C)/(W + C)]s.
Figure 4.
Figure 4.
Segregation of hemi-6mApT to the parental strand after DNA replication. (A) Hemi+ molecules are enriched in S phase. Tetrahymena cells were synchronized at G1 phase by centrifugal elutriation and released for growth in the fresh medium (Liu et al. 2021b). Four time points were taken (0, 1.5, 2, and 4 h after release) for SMRT CCS. Hemi+ molecules were defined as DNA molecules with a total count of no less than 11 hemi sites (W + C ≥ 11) or with no less than 11 hemi sites on one strand (W||C ≥ 11). The count of hemi+ molecules was normalized first against the counts of total DNA molecules and then against the 0 h (G1 phase) value. (B) Hemi-6mApT sites in hemi+ molecules exhibit strong segregation strand bias. Segregation strand bias for hemi-6mApT is defined as the difference-sum ratio between hemi-W and hemi-C: [(W − C)/(W + C)]s. (C) Typical DNA molecules with hemi-6mApT fully segregated to W or C, corresponding to segregation strand bias of +1 and −1, as marked in B. (D) IPDr distributions of T sites in genomic DNA samples of synchronized Tetrahymena cells with BrdU labeling (1.5 h, 2 h, and 4 h) or without (0 h). The IPDr threshold for calling BrdU was set at 2.8. (E) BrdU sites in BrdU+ molecules exhibit strong segregation strand biases. BrdU+ molecules were defined as DNA molecules with a total count of no less than 15 BrdU sites (W + C ≥ 15). Segregation strand bias for BrdU was defined as the difference-sum ratio between BrdU sites on W and C: [(W − C)/(W + C)]s. Also shown are typical BrdU+ molecules with BrdU fully segregated to W or C, corresponding to segregation strand bias of +1 and −1, respectively. (F) Correlation between BrdU labeling and BrdU+ molecules. BrdU+ molecules were alternatively defined as DNA molecules with a total count of no less than 15 BrdU sites (W + C ≥ 15), or with no less than 15 BrdU sites on one strand (W||C ≥ 15). The latter is more selective for DNA molecules with strong strand segregation bias. (G) Hemi-6mApT and BrdU are segregated to opposite strands of the DNA duplex. Distribution of hemi+/BrdU+ molecules (hemi-6mApT: W||C ≥ 11; BrdU: W||C ≥ 15) according to their segregation strand bias for hemi-6mApT and BrdU, respectively. (H) Typical hemi+/BrdU+ molecules with hemi-6mApT and BrdU fully segregated to opposite strands, corresponding to segregation strand bias of (−1, +1) and (+1, −1), as marked in G.
Figure 5.
Figure 5.
In vitro MTase activity of AMT1 complex. (A) SDS-PAGE of in vitro reconstituted AMT1 complex comprising AMT1, AMT7, AMTP1 (1–240 aa), and AMTP2. (B) The steady-state kinetics of AMT1 complex on a hemi-methylated substrate (hemi), determined by a 3H-SAM-based MTase assay. The substrate contains a single ApT duplex (underlined), which is hemi-methylated (red). (C) Methylation of the unmodified (un) and hemi-methylated (hemi) substrates. Both contain two ApT duplexes (underlined), which are either unmodified or hemi-methylated (red). (D) IPDr distributions for total adenine, adenine at the ApT dinucleotide, and adenine in ApC dinucleotide, after in vitro methylation of human chromatin by either AMT1 complex (top) or M.EcoGII (bottom). (E) 6mA distribution at all four ApN dinucleotides, after in vitro methylation of human chromatin by either AMT1 complex or M.EcoGII. ApN frequencies in SMRT CCS read are also plotted for comparison (Sequence Average). (F) Demarcation of the four methylation states of ApT duplexes by their IPDr on W and C, in human chromatin methylated by AMT1 complex (top) or M.EcoGII (bottom). AMT1 complex methylation pattern is reminiscent of that in WT Tetrahymena cells, with a strong preference for full-6mApT, as indicated by a shift in the IPDr threshold for calling full-6mApT relative to calling bulk 6mA. M.EcoGII methylation pattern is reminiscent of that in ΔAMT1 cells, with no preference for full-6mApT, as indicated by the same IPDr threshold for calling bulk 6mA or full-6mApT. (G) Relative abundance of hemi-6mApT and full-6mApT in human chromatin methylated by either AMT1 complex or M.EcoGII. (H) Model: AMT1-dependent semiconservative transmission of 6mA.
Figure 6.
Figure 6.
Chromatin-guided 6mA transmission. (A) 6mA and nucleosome distributions in Tetrahymena. A typical genomic region is shown with SMRT CCS reads mapped across it, as well as annotations of genes and canonical nucleosome arrays (Xiong et al. 2016). Note that 6mApT sites (in either full or hemi-methylation, red dot) distributed along individual DNA molecules (gray line) are clustered in linker DNA (LD). LD1 is between the +1 and +2 nucleosome (the first and second nucleosome downstream from TSS); LD2 and beyond are defined iteratively further downstream from the gene body. (B) Periodic 6mA distribution at the single-molecule level in Tetrahymena. Autocorrelation between 6mA sites was calculated for individual DNA molecules, ranked by their median absolute deviations, and plotted as a heat map (bottom) and an aggregated correlogram (top). (C) Autocorrelation of 6mA and nucleosome distributions at the ensemble level in Tetrahymena (top), revealing a ∼200 bp periodicity. Cross-correlation between 6mA and nucleosome distributions (bottom), revealing an ∼100 bp phase difference between them. (D) Typical DNA molecules from human chromatin, after in vitro methylation by AMT1 complex and M.EcoGII, respectively. Note clusters of 6mA sites (red dot) distributed at regular intervals along individual DNA molecules (gray line). The difference in 6mA density is mostly due to the much lower density of the ApT dinucleotide that is preferred by the AMT1 complex, relative to essentially all A sites that can be targeted by M.EcoGII. Additionally, the AMT1 complex may also have reduced chromatin accessibility relative to M.EcoGII, due to its much larger size. (E) Periodic 6mA distributions at the single-molecule level, after in vitro methylation by AMT1 complex and M.EcoGII, respectively. Autocorrelation between 6mA sites was calculated for individual DNA molecules, ranked by their median absolute deviations, and plotted as heat maps (bottom) and aggregated correlograms (top). DNA molecules with regularly spaced 6mA clusters were found across euchromatic and heterochromatic regions. Heterochromatin is known to have low nucleosome positioning, which means at the ensemble level, nucleosomes can occupy alternative genomic positions. However, at the single-molecule level, nucleosomes are still regularly spaced, which is only obvious in long-read, single-molecule sequencing results. (F) Congregation of full-6mApT in DNA molecules undergoing hemi-to-full conversion. Their max inter-full distances were often very small, thus rarely represented (probability ≤0.01) in simulations with permutated full and hemi positions (box); x-axis: the probability for simulated max interfull distances to be no greater than the observed value; y-axis: the count of DNA molecules with the corresponding probability. (G) Distribution of max interfull distances for DNA molecules with strong full-6mApT congregation (probability ≤0.01, Fig. 5F, box). Note the two peaks corresponding to DNA molecules with full-6mApT congregation within an LD (Fig. 5H) and across adjacent LDs (Fig. 5I), respectively. (H) Full-6mApT congregation within an LD. (I) Full-6mApT congregation across adjacent LDs.
Figure 7.
Figure 7.
AMT1-independent de novo methylation. (A) Depletion of high penetrance 6mA positions in ΔAMT1 relative to WT cells. (B) Strong 6mA segregation strand biases in ΔAMT1 cells. Chi-squared analysis was performed on DNA molecules with the specified number of total 6mA (full-6mApT counted as two, hemi-6mApT counted as one; x-axis), the percentage of DNA molecules with a strong bias for 6mA segregation to one strand was indicated (expectance <5%, assuming random distribution; y-axis). WT cells were also analyzed as a negative control. (C) Increased 6mA variability at the gene level in ΔAMT1 relative to WT cells. For each gene, we calculated the coefficient of variance (CV) of 6mA counts from individual DNA molecules fully covering the gene, for WT and ΔAMT1 cells, respectively. We then plotted the distribution of the ratio between the two CV values (WT/ΔAMT1) across all genes. Note that for most genes, the ratio is <1 (i.e., 6mA variability is higher in ΔAMT1 than WT cells). (D) Penetrance strand bias of 6mA in WT and ΔAMT1 cells. 6mA penetrance strand bias is defined for an ApT position in the genome as the difference-sum ratio between the number of DNA molecules supporting 6mA on W and C, respectively: [(W − C)/(W + C)]p. We plotted the distribution of ApT genomic positions according to their penetrance strand bias (top). We also plotted their distribution according to both penetrance strand bias and 6mApT coverage (middle: WT; bottom: ΔAMT1). In WT cells, most ApT positions had penetrance strand bias values around 0 (i.e., similar numbers of 6mA on W and C), whereas few had values at +1 (6mA only on W) or −1 (6mA only on C). The latter most likely corresponds to genomic positions exclusive for AMT1-independent methylation (Fig. 6F, left panel). The opposite was true for ΔAMT1 cells. (E) Representative genomic positions in Tetrahymena rDNA (top schematic: only the left half of the palindromic dimer, from telomere to dyad, is shown) targeted by AMT1-independent (left) and AMT1-dependent methylation (right). Note that 6mA occurs only on one strand in AMT1-independent methylation, but on both strands in AMT1-dependent methylation. (F) 6mA penetrance of individual genomic positions in WT and ΔAMT1 cells. Note the two distinct groups corresponding to (1) AMT1-independent and (2) AMT1-dependent methylation. (G) 10 bp cycle of 6mA penetrance strand bias in ΔAMT1 cells (top left), suggesting that the dedicated de novo 6mA-MTase can only approach the DNA substrate from one side (top right). Lack of such a pattern in WT cells (bottom left) supports that the AMT1 complex can approach from different sides (bottom right). (H) Overlap in ApT positions methylated in WT or ΔAMT1 cells (6mA penetrance ≥0.1). (I) 6mA levels of individual genes in WT and ΔAMT1 cells are strongly correlated. Each gene is assigned a coordinate: the sum of 6mA penetrance values for all methylated ApT positions in the gene body (ΣP) for WT (x-axis) and ΔAMT1 cells (y-axis). The Spearman's rank correlation coefficient is significant: (**) P < 0.01.
Figure 8.
Figure 8.
Comparison of 6mA and 5mC pathways in eukaryotes. See text for details.

Similar articles

Cited by

References

    1. Abdulhay NJ, McNally CP, Hsieh LJ, Kasinathan S, Keith A, Estes LS, Karimzadeh M, Underwood JG, Goodarzi H, Narlikar GJ, et al. 2020. Massively multiplex single-molecule oligonucleosome footprinting. eLife 9: e59404. 10.7554/eLife.59404 - DOI - PMC - PubMed
    1. Altemose N, Maslan A, Smith OK, Sundararajan K, Brown RR, Mishra R, Detweiler AM, Neff N, Miga KH, Straight AF, et al. 2022. DiMeLo-seq: a long-read, single-molecule method for mapping protein–DNA interactions genome wide. Nat Methods 19: 711–723. 10.1038/s41592-022-01475-6 - DOI - PMC - PubMed
    1. Beh LY, Debelouchina GT, Clay DM, Thompson RE, Lindblad KA, Hutton ER, Bracht JR, Sebra RP, Muir TW, Landweber LF. 2019. Identification of a DNA N6-adenine methyltransferase complex and its impact on chromatin organization. Cell 177: 1781–1796.e25. 10.1016/j.cell.2019.04.028 - DOI - PMC - PubMed
    1. Bestor TH. 2000. The DNA methyltransferases of mammals. Hum Mol Genet 9: 2395–2402. 10.1093/hmg/9.16.2395 - DOI - PubMed
    1. Bochtler M, Fernandes H. 2021. DNA adenine methylation in eukaryotes: enzymatic mark or a form of DNA damage? Bioessays 43: e2000243. 10.1002/bies.202000243 - DOI - PubMed

Publication types

MeSH terms