

Biophysics of Frequency-Dependent Variation in Paresthesia and Pain Relief during Spinal Cord Stimulation
- PMID: 38744531
- PMCID: PMC11211721
- DOI: 10.1523/JNEUROSCI.2199-23.2024
Biophysics of Frequency-Dependent Variation in Paresthesia and Pain Relief during Spinal Cord Stimulation
Abstract
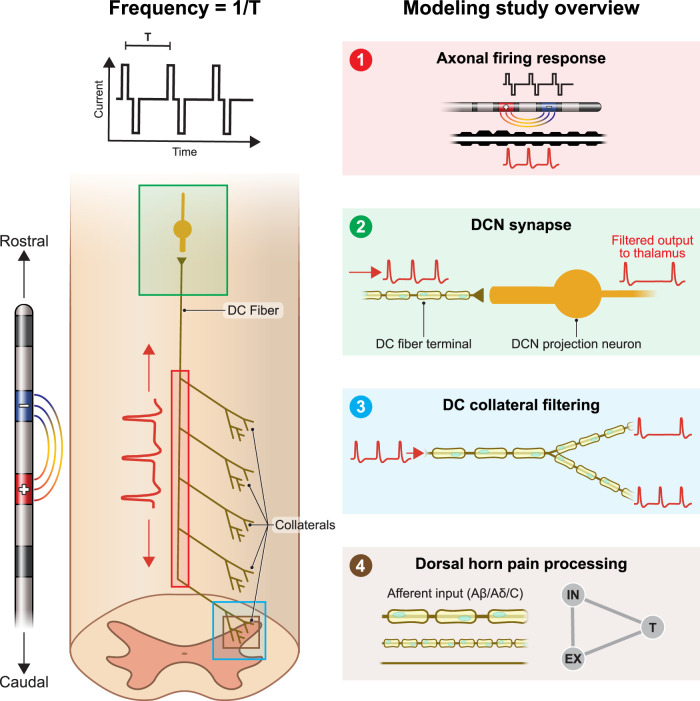
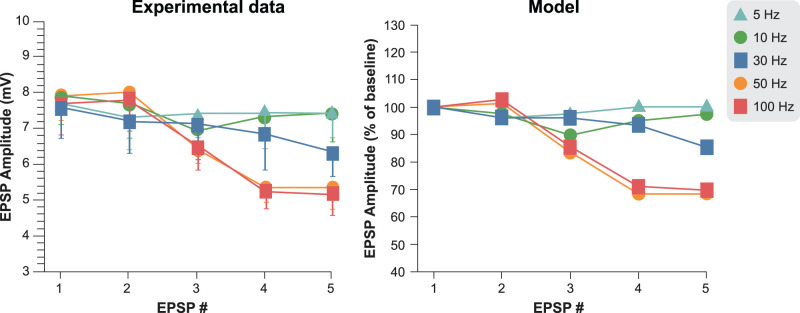
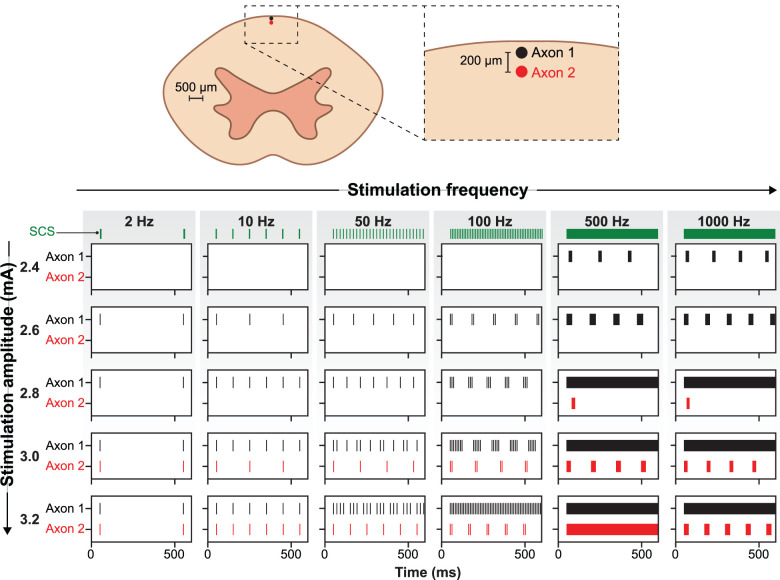
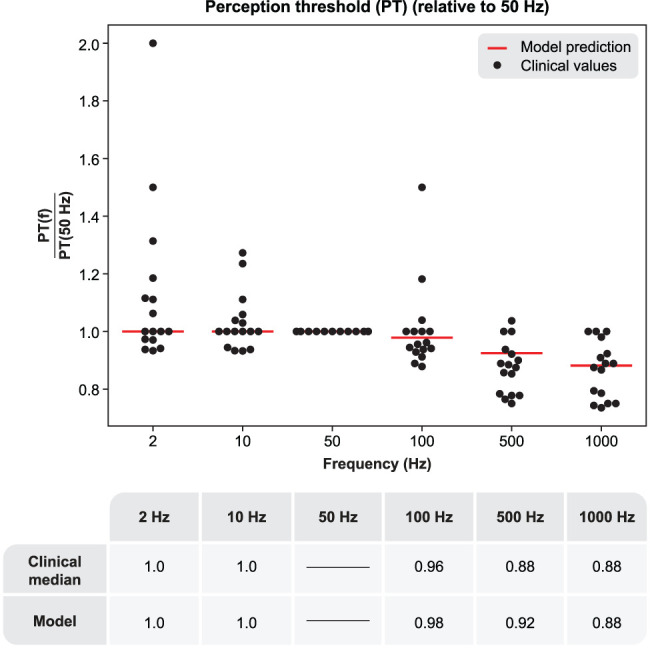
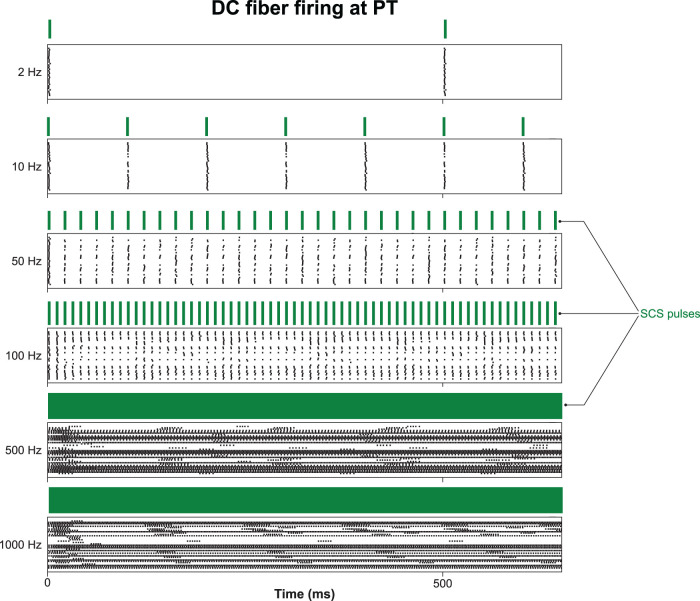
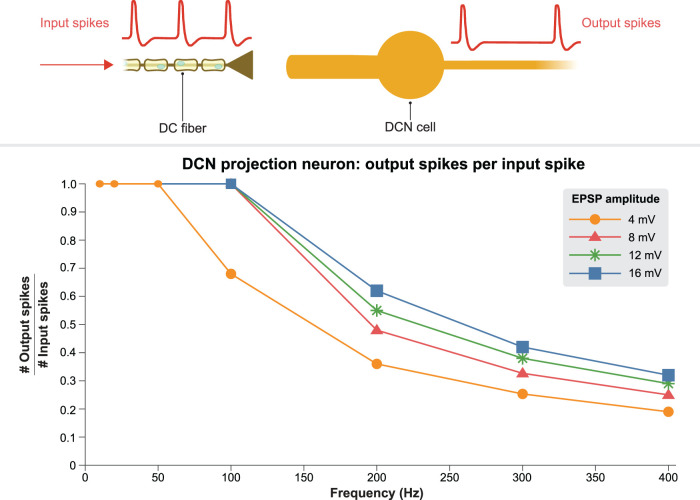
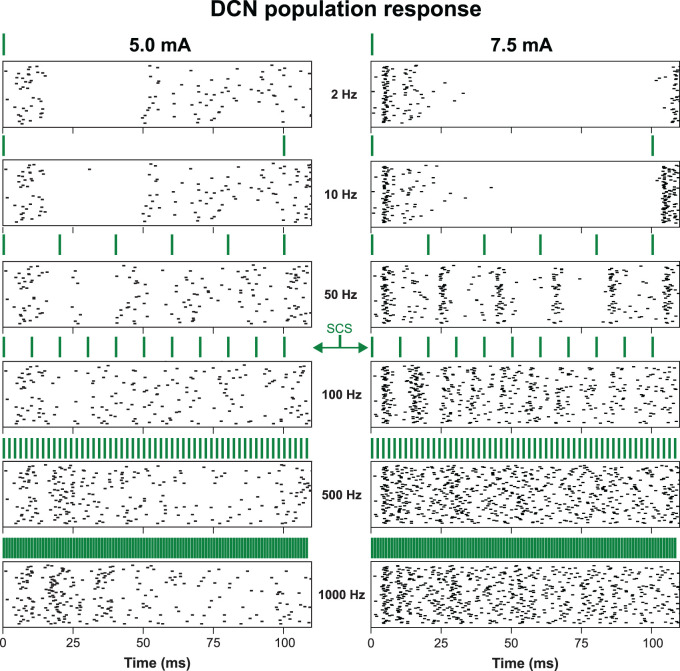
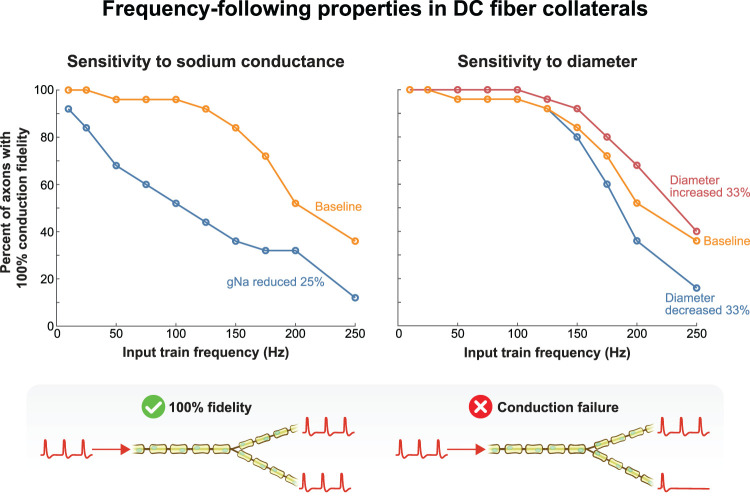
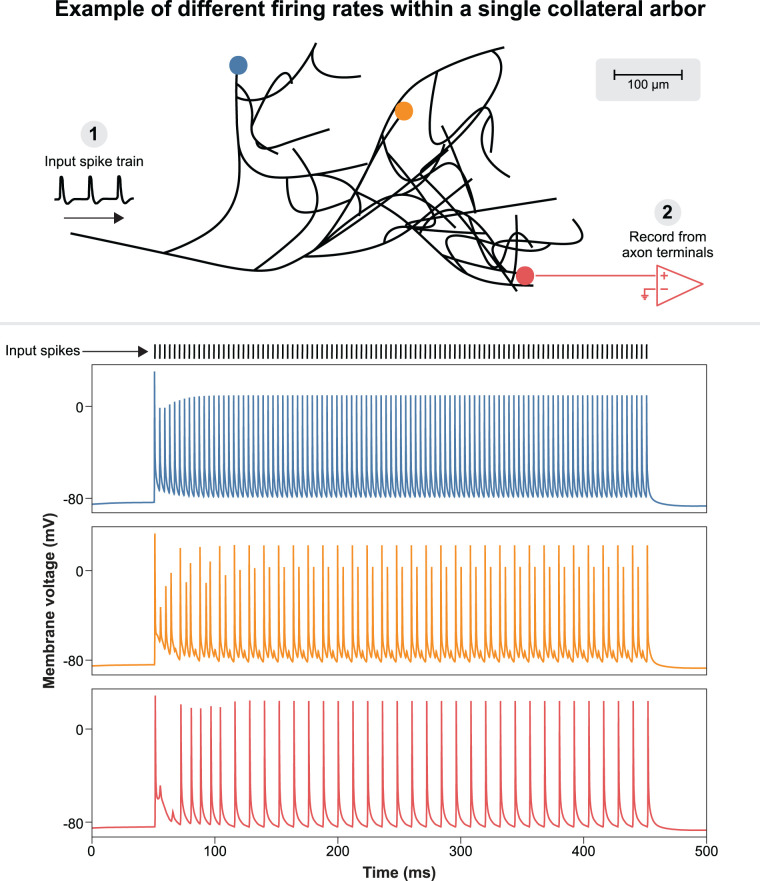
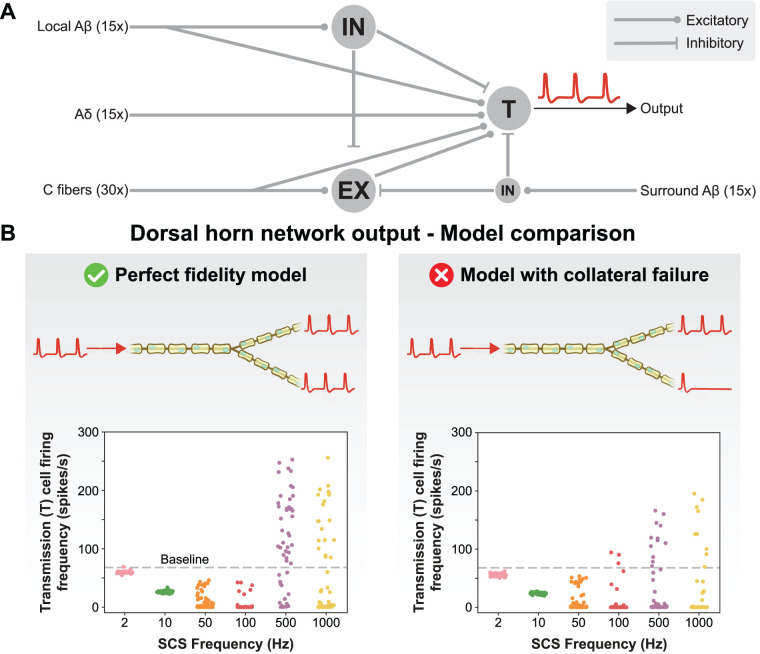
The neurophysiological effects of spinal cord stimulation (SCS) for chronic pain are poorly understood, resulting in inefficient failure-prone programming protocols and inadequate pain relief. Nonetheless, novel stimulation patterns are regularly introduced and adopted clinically. Traditionally, paresthetic sensation is considered necessary for pain relief, although novel paradigms provide analgesia without paresthesia. However, like pain relief, the neurophysiological underpinnings of SCS-induced paresthesia are unknown. Here, we paired biophysical modeling with clinical paresthesia thresholds (of both sexes) to investigate how stimulation frequency affects the neural response to SCS relevant to paresthesia and analgesia. Specifically, we modeled the dorsal column (DC) axonal response, dorsal column nucleus (DCN) synaptic transmission, conduction failure within DC fiber collaterals, and dorsal horn network output. Importantly, we found that high-frequency stimulation reduces DC fiber activation thresholds, which in turn accurately predicts clinical paresthesia perception thresholds. Furthermore, we show that high-frequency SCS produces asynchronous DC fiber spiking and ultimately asynchronous DCN output, offering a plausible biophysical basis for why high-frequency SCS is less comfortable and produces qualitatively different sensation than low-frequency stimulation. Finally, we demonstrate that the model dorsal horn network output is sensitive to SCS-inherent variations in spike timing, which could contribute to heterogeneous pain relief across patients. Importantly, we show that model DC fiber collaterals cannot reliably follow high-frequency stimulation, strongly affecting the network output and typically producing antinociceptive effects at high frequencies. Altogether, these findings clarify how SCS affects the nervous system and provide insight into the biophysics of paresthesia generation and pain relief.
Keywords: chronic pain; computer simulation; electric stimulation; paresthesia; somatosensation; spinal cord stimulation.
Copyright © 2024 the authors.
Conflict of interest statement
S.F.L. has equity in CereGate, Hologram Consultants, Neuronoff, and Presidio Medical, is a member of the scientific advisory boards for CereGate and Presidio Medical, and receives research support from Abbott Neuromodulation, Medtronic, Neuromodulation Specialists, and Presidio Medical. E.R.R. and M.C. declare no competing financial interests.
Figures
Similar articles
-
Modulation of activity and conduction in single dorsal column axons by kilohertz-frequency spinal cord stimulation.J Neurophysiol. 2017 Jan 1;117(1):136-147. doi: 10.1152/jn.00701.2016. Epub 2016 Oct 19. J Neurophysiol. 2017. PMID: 27760823 Free PMC article.
-
Two-year outcomes using fast-acting sub-perception therapy for spinal cord stimulation: results of a real-world multicenter study in the United States.Expert Rev Med Devices. 2025 Jan-Feb;22(2):155-164. doi: 10.1080/17434440.2025.2453554. Epub 2025 Jan 16. Expert Rev Med Devices. 2025. PMID: 39819320
-
Low-intensity, Kilohertz Frequency Spinal Cord Stimulation Differently Affects Excitatory and Inhibitory Neurons in the Rodent Superficial Dorsal Horn.Neuroscience. 2020 Jan 21;428:132-139. doi: 10.1016/j.neuroscience.2019.12.031. Epub 2020 Jan 7. Neuroscience. 2020. PMID: 31917342
-
Conventional and Novel Spinal Stimulation Algorithms: Hypothetical Mechanisms of Action and Comments on Outcomes.Neuromodulation. 2017 Aug;20(6):525-533. doi: 10.1111/ner.12624. Epub 2017 May 31. Neuromodulation. 2017. PMID: 28568898 Review.
-
Spinal Cord Stimulation for Treating Chronic Pain: Reviewing Preclinical and Clinical Data on Paresthesia-Free High-Frequency Therapy.Neuromodulation. 2018 Jan;21(1):10-18. doi: 10.1111/ner.12721. Epub 2017 Nov 3. Neuromodulation. 2018. PMID: 29105244 Free PMC article. Review.
References
-
- Brown AG (1981) Organization in the spinal cord: the anatomy and physiology of identified neurones. Berlin: Springer-Verlag.
MeSH terms
Grants and funding
LinkOut - more resources
Full Text Sources
Miscellaneous