. 2024 May 14;15(1):4074.
doi: 10.1038/s41467-024-47619-4.

Disentangling oncogenic amplicons in esophageal adenocarcinoma

Collaborators, Affiliations

Disentangling oncogenic amplicons in esophageal adenocarcinoma

Alvin Wei Tian Ng et al. Nat Commun. .

Erratum in

  • Author Correction: Disentangling oncogenic amplicons in esophageal adenocarcinoma.
    Ng AWT, McClurg DP, Wesley B, Zamani SA, Black E, Miremadi A, Giger O, Hoopen RT, Devonshire G, Redmond AM, Grehan N, Jammula S, Blasko A, Li X, Aparicio S, Tavaré S; Oesophageal Cancer Clinical and Molecular Stratification (OCCAMS) Consortium; Nowicki-Osuch K, Fitzgerald RC. Ng AWT, et al. Nat Commun. 2024 May 28;15(1):4533. doi: 10.1038/s41467-024-48912-y. Nat Commun. 2024. PMID: 38806493 Free PMC article. No abstract available.

Abstract

Esophageal adenocarcinoma is a prominent example of cancer characterized by frequent amplifications in oncogenes. However, the mechanisms leading to amplicons that involve breakage-fusion-bridge cycles and extrachromosomal DNA are poorly understood. Here, we use 710 esophageal adenocarcinoma cases with matched samples and patient-derived organoids to disentangle complex amplicons and their associated mechanisms. Short-read sequencing identifies ERBB2, MYC, MDM2, and HMGA2 as the most frequent oncogenes amplified in extrachromosomal DNAs. We resolve complex extrachromosomal DNA and breakage-fusion-bridge cycles amplicons by integrating of de-novo assemblies and DNA methylation in nine long-read sequenced cases. Complex amplicons shared between precancerous biopsy and late-stage tumor, an enrichment of putative enhancer elements and mobile element insertions are potential drivers of complex amplicons' origin. We find that patient-derived organoids recapitulate extrachromosomal DNA observed in the primary tumors and single-cell DNA sequencing capture extrachromosomal DNA-driven clonal dynamics across passages. Prospectively, long-read and single-cell DNA sequencing technologies can lead to better prediction of clonal evolution in esophageal adenocarcinoma.


Conflict of interest statement

R.C.F is named on patents related to Cytosponge and related assays which have been licensed by the Medical Research Council to Covidien GI Solutions (now Medtronic) and is a co-founder of CYTED Ltd. These are not directly involved in the topic of this paper. R.C.F. has received consulting and/or speaker fees from Medtronic, Roche, and Bristol Myers Squibb. The remaining authors declare no competing interests.

Figures

Fig. 1
Fig. 1. Study design and overview.
Primary tumors (n = 710) and patient-derived organoids (n = 24) sequenced on Illumina short reads and Oxford Nanopore Technologies (ONT) long-read sequenced tumor, matched normal and organoids (n = 9, 3 and 3 respectively) were used in this study. A single-cell DNA sequenced DLP+ library was generated for an organoid at 2 time points. Short-read data was used to profile copy numbers in each sample, reconstruct amplicons using Amplicon Architect and identify amplicon hotspots in the genome. Long reads were used to carry out the de-novo assembly of amplicons and used for ecDNA clone tracing in combination with scDNA-seq data. BioRender was used to generate Fig. 1.
Fig. 2
Fig. 2. Landscape of amplicons in 710 EAC.
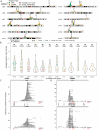
A Frequency of genomic regions amplified in 710 EAC tumors and associated driver genes in chromosomes with amplicons. The height of peaks shows the number of patients with an amplification in the genomic region. Events were classified by Amplicon Architect into BFB, ecDNA, complex non-cyclic amplicons, and linear amplification. B Distribution of amplicon copy numbers affecting oncogenes in EAC. Individual points show each amplicon per patient. The recurrence of each oncogenic event is shown above each violin plot. C Regions amplified in KRAS amplicons in ecDNA and BFB events. Each horizontal line shows the genomic region amplified per patient. H3K27Ac and gene annotations are shown below. The density plot (gray) shows the regions amplified aggregated across the cohort. Previously identified driver genes are highlighted in red. D Regions amplified in ERBB2 associated amplicons in ecDNA and BFB events. Source data are provided as a Source Data file.
Fig. 3
Fig. 3. Long-read assemblies resolve complex amplicons and identify amplicon-initiating processes.
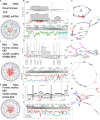
AN Three patient profiles with ecDNA were identified in their tumor genomes with clinical (gender M = male or F = female, age, T and N stage) and molecular features. A Profile of Patient 43 with the TDP phenotype and ERBB2 ecDNA. B CN profiles of BE (43B) and tumor (43T) containing amplicons with breaks in CDK12 and spanning ERBB2. C Assembly graphs of patient P43, 43B, and D 43T showing CN and position of genes amplified. 43T contains a segment of keratin genes (CN = 13) in addition to segments shared with 43B. E Methylation profiles of the amplified regions in 43T showing the fraction of reads methylated with gene annotations above. F Profile of tumor of patient P18 with a CCNE1 ecDNA and ERBB2 BFB. G CN profile of a complex ecDNA and BFB event. H Assembly graph of complex amplicon spanning three chromosomes: chr17,18 & 19. I Methylation profiles of regions spanning CCNE1 and J Assembly of CCNE1 ecDNA deconvoluted based on hypomethylated reads. K Profile of tumor from Patient P139 driven by LINE-1 insertions. L CN profile of a complex amplicon containing a CCND3 amplicon, CDK6 ecDNA, and KRAS BFB. Arrows indicate LINE-1 insertions identified using TraFic and TLDR. M Assembly graph of amplicon included 2 segments containing LINE-1 sequences (CN = 84). N Methylation profile of LINE-1 containing amplicon.
Fig. 4
Fig. 4. Organoid models as preclinical models for characterizing complex amplicons.
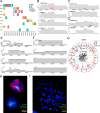
A Oncoplot showing amplicons identified in organoid (O) and paired tumor (T) tissue from the same patient, classified by Amplicon Architect. B Copy number profile of a BFB event in the primary tumor and organoid CAM296 sequenced at passages (P) 4, 8 and 11. C Copy number profile of an ecDNA event detected only in the organoid CAM453 containing the MYC oncogene. D Copy number profile of a BFB event in CAM408 enriched in the organoid compared to the tumor. E Copy number profile of an ecDNA spanning KRAS in the tumor, CAM277 organoids at passage 0, 8, and 14. F Copy number profile of a second ecDNA on chromosome 12 in CAM277 that diminished across passages. G Circos plot showing overlap of SV and CNA profiles of CAM277 (red) and primary tumor (gray). H Interphase FISH of CAM277 showing KRAS ecDNA against centromere labeling for chromosome 12 (CEN12q). I Metaphase FISH of organoid CAM277 with additional DAPI staining for DNA. 60X magnification was used for the interphase and metaphase FISH. The Metaphase FISH was carried with 2 replicates and shown with 10μm scale bars. Source data are provided as a Source Data file.
Fig. 5
Fig. 5. Single-cell analysis disentangles complex amplicon and identifies ecDNA-containing clones.
AB UMAP clustering of DLP+ sequenced single cells into subclonal populations in Passage 4 and 15. C Heatmap of the segmented genomic copy landscape in single cells across 2 passages in CAM277. Genomic regions are binned into 0.5Mbp bins. D Assembly graph of complex amplicon containing BFB sequences (edges 13, 14, and 17) and complex amplicon sequences (red box). E Line graph showing CN of bulk short-read WGS from normal squamous epithelium, tumor, and organoids at passage 0, 8, and 14 aligned to assembly graph and a correlation matrix of scDNA-sequenced clone CN. Two clusters mapping to ecDNA sequences and BFB sequences were identified. F Distribution of ecDNA containing KRAS and C12orf77 in individual single-cell clones at passages 4 and 15. Distribution of CN values in the IFTLD1 BFB with no clonal shift shown as a comparison. A total of 354 cells for passage 4 and 580 cells for passage 15 were included in the analysis. G Heatmap showing CN values of scDNA clones mapped to assembly graph sequences. Edge 25 (e25) is the graph edge containing the KRAS sequence. Source data are provided as a Source Data file.

References

    1. Bignell GR, et al. Architectures of somatic genomic rearrangement in human cancer amplicons at sequence-level resolution. Genome Res. 2007;17:1296–1303. doi: 10.1101/gr.6522707. - DOI - PMC - PubMed
    1. Campbell PJ, et al. Identification of somatically acquired rearrangements in cancer using genome-wide massively parallel paired-end sequencing. Nat. Genet. 2008;40:722. doi: 10.1038/ng.128. - DOI - PMC - PubMed
    1. Storlazzi CT, et al. Gene amplification as doubleminutes or homogeneously staining regions in solid tumors: Origin and structure. Genome Res. 2010;20:1198–1206. doi: 10.1101/gr.106252.110. - DOI - PMC - PubMed
    1. Hung, K. L. et al. EcDNA hubs drive cooperative intermolecular oncogene expression. Nature600, 731–736 (2021). - PMC - PubMed
    1. Wu S, et al. Circular ecDNA promotes accessible chromatin and high oncogene expression. Nature. 2019;575:699–703. doi: 10.1038/s41586-019-1763-5. - DOI - PMC - PubMed