. 2024 May 14;15(1):3678.
doi: 10.1038/s41467-024-47197-5.

Global projections of heat exposure of older adults

Affiliations

Global projections of heat exposure of older adults

Giacomo Falchetta et al. Nat Commun. .

Abstract

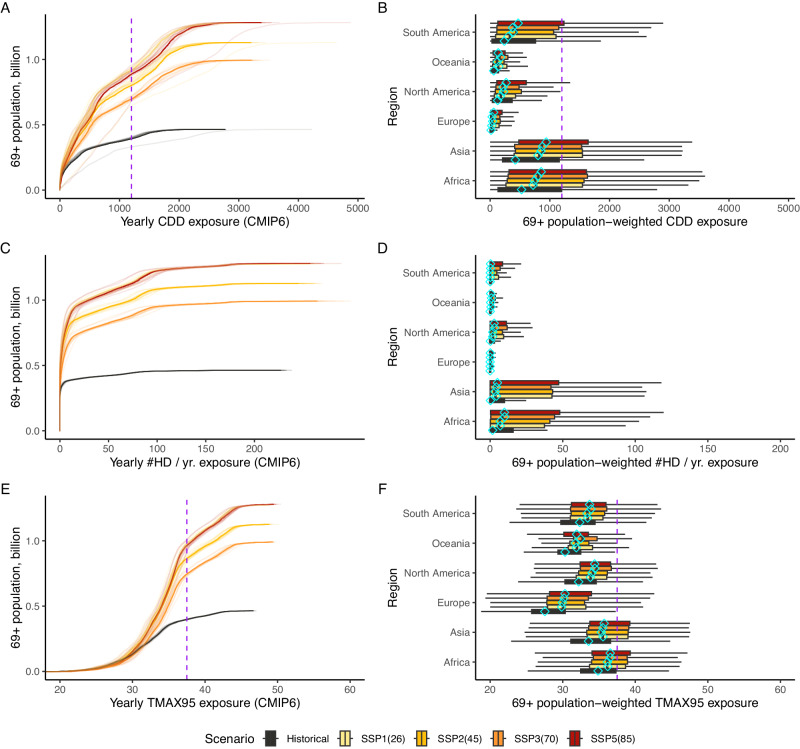
The global population is aging at the same time as heat exposures are increasing due to climate change. Age structure, and its biological and socio-economic drivers, determine populations' vulnerability to high temperatures. Here we combine age-stratified demographic projections with downscaled temperature projections to mid-century and find that chronic exposure to heat doubles across all warming scenarios. Moreover, >23% of the global population aged 69+ will inhabit climates whose 95th percentile of daily maximum temperature exceeds the critical threshold of 37.5 °C, compared with 14% today, exposing an additional 177-246 million older adults to dangerous acute heat. Effects are most severe in Asia and Africa, which also have the lowest adaptive capacity. Our results facilitate regional heat risk assessments and inform public health decision-making.


Conflict of interest statement

The authors declare no competing interests.

Figures

Fig. 1
Fig. 1. Global intersection of aging and heat exposure in the current climate (left column) and circa 2050, SSP2(45) (right column).
A, B Proportion of population aged 69+ exposed to annual Cooling Degree Days (CDDs). C, D Annual temperatures corresponding to the 95th percentile of local extreme heat exposure (TMAX95). E, F Annual days with TMAX > 37.5° C (#HD). Figures SI-13–SI-15 in the SI Appendix present similar figures for SSP1(26), 3(70), and 5(85).
Fig. 2
Fig. 2. Age 69+ heat exposures: global cumulative distributions (left column) and regional frequency distributions (right column).
Panels (A, C, E): cumulative counts of aged 69+ individuals worldwide exposed to a given amount of median Cooling Degree Days in a year (CDDs), the number of Hot Days, #HD, and the corresponding to 95th percentile of acute extreme heat exposure (TMAX95). Historical vs. 2050 for SSPs 1(26), 2(45), 3(70), and 5(85), CMIP6 global climate models (GCMs) (hot models excluded) range; multi-model median in bold lines. Panels (B, D, F): boxplots of region-specific older individuals-weighted exposure to a given amount of median CDDs, #HD, and TMAX95. Historical vs. 2050 for SSPs 1(26), 2(45), 3(70), and 5(85), CMIP6 GCMs (hot models excluded). Range and multi-model median (diamond). Purple lines in panels (A) and (C) and (E) and (F) identify critical thresholds of 1200 CDDs/yr and 37.5° C (dangerous temperature even under short exposure).
Fig. 3
Fig. 3. Regional and age-group-specific trends in the cumulative and intensity of acute exposure of population groups: 2020–2050.
Top row: global trends; lower rows: regional trends. Panel (A): GCM uncertainty range for the count of individuals exposed to a given CDD exposure level, age stratification, faceted by region, difference between SSP2(45) and current population. Panel (B): GCM uncertainty range for the count of individuals exposed to a given number of annual days with TMAX95 > 37.5 °C, age stratification, faceted by region, difference between SSP2(45) and current population. Panel (C): GCM uncertainty range for the count of individuals exposed to a given 95th percentile maximum temperature exposure level, age stratification, faceted by region, difference between SSP2(45) and current population. Figures SI-19–SI-21 in the SI Appendix present similar figures for SSP1(26), 3(70). and 5(85).
Fig. 4
Fig. 4. Decomposition of projected determinants of exposure by region and SSP scenario.
Panel (A, B): Billion Person Degree Days (PDDs) decomposition, by region and global. Panel (C, D): Billion Person Hot Days (PHDs) decomposition, by region and global. Panel (E, F): Billion Person Degrees (PD95th) decomposition, by region and global.

References

    1. IPCC. Climate Change 2022: Impacts, Adaptation, and Vulnerability. Contribution of Working Group II to the Sixth Assessment Report of the Intergovernmental Panel on Climate Change (Cambridge University Press, New York, 2022).
    1. Meade RD, et al. Physiological factors characterizing heat-vulnerable older adults: a narrative review. Environ. Int. 2020;144:105909. doi: 10.1016/j.envint.2020.105909. - DOI - PubMed
    1. Asseng S, Spänkuch D, Hernandez-Ochoa IM, Laporta J. The upper temperature thresholds of life. Lancet Planet. Health. 2021;5:e378–e385. doi: 10.1016/S2542-5196(21)00079-6. - DOI - PubMed
    1. Khatana SAM, Werner RM, Groeneveld PW. Association of extreme heat and cardiovascular mortality in the United States: a county-level longitudinal analysis from 2008 to 2017. Circulation. 2022;146:249–261. doi: 10.1161/CIRCULATIONAHA.122.060746. - DOI - PMC - PubMed
    1. Gamble JL, et al. Climate change and older Americans: state of the science. Environ. Health Perspect. 2013;121:15–22. doi: 10.1289/ehp.1205223. - DOI - PMC - PubMed