. 2024 May 14;15(1):4061.
doi: 10.1038/s41467-024-48443-6.

Transcription stress at telomeres leads to cytosolic DNA release and paracrine senescence

Affiliations

Transcription stress at telomeres leads to cytosolic DNA release and paracrine senescence

Athanasios Siametis et al. Nat Commun. .

Abstract

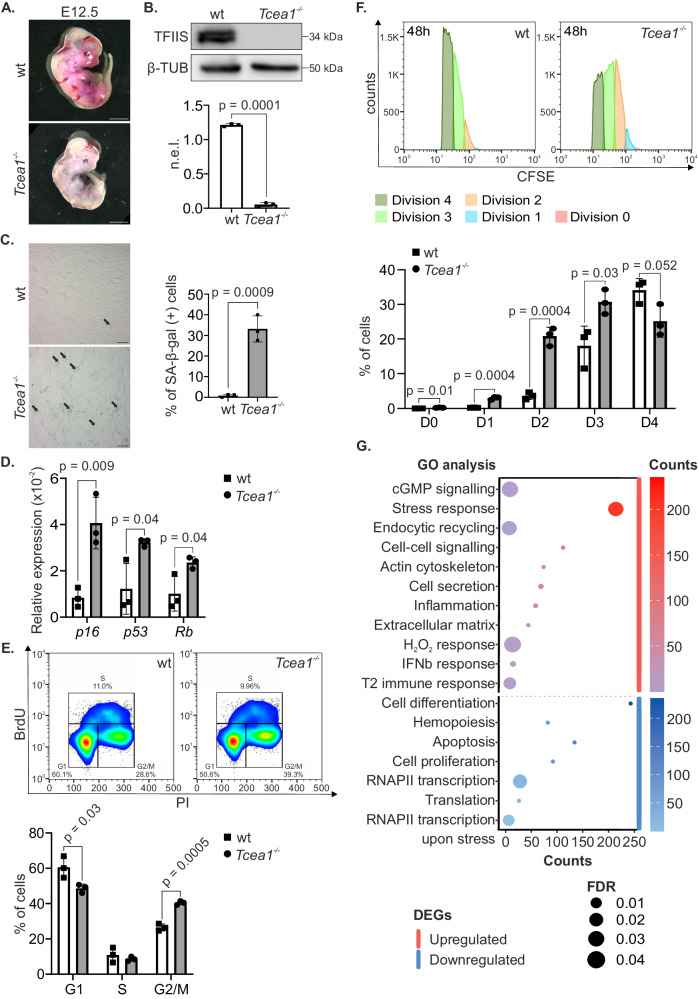
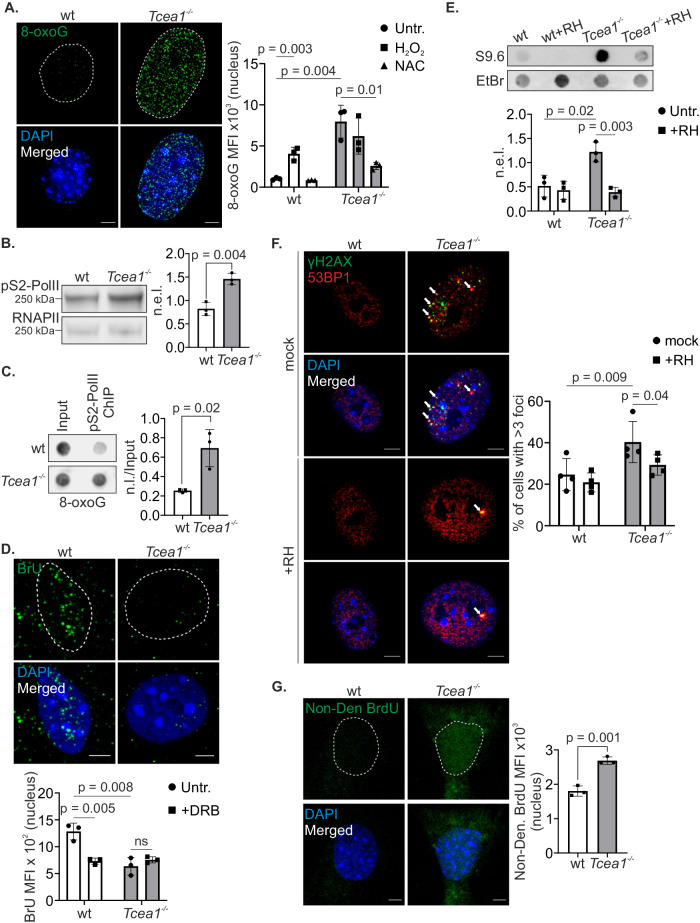
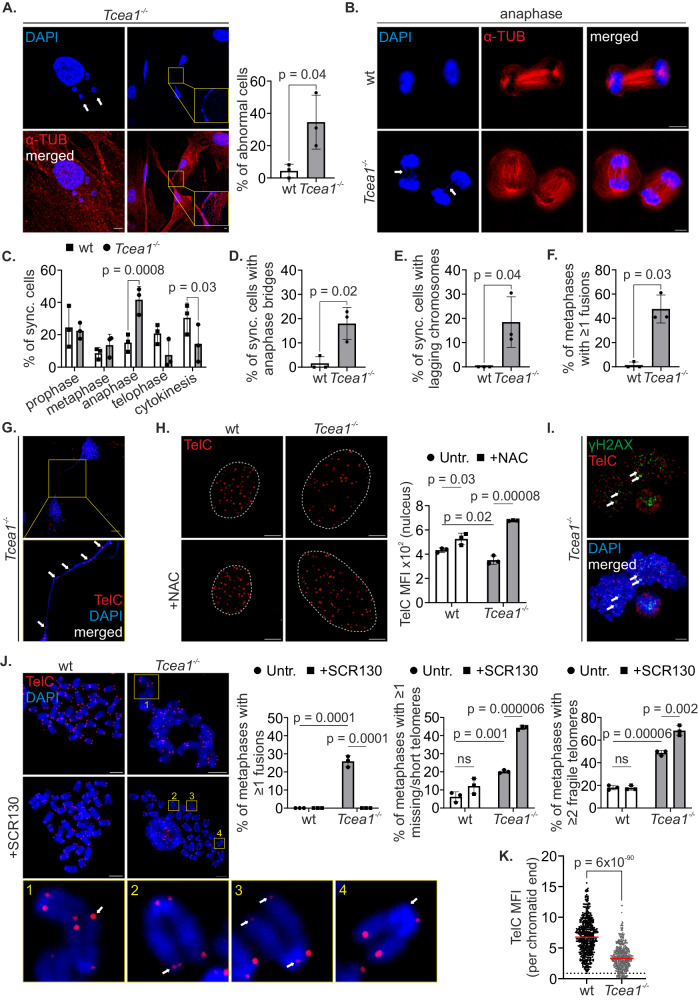
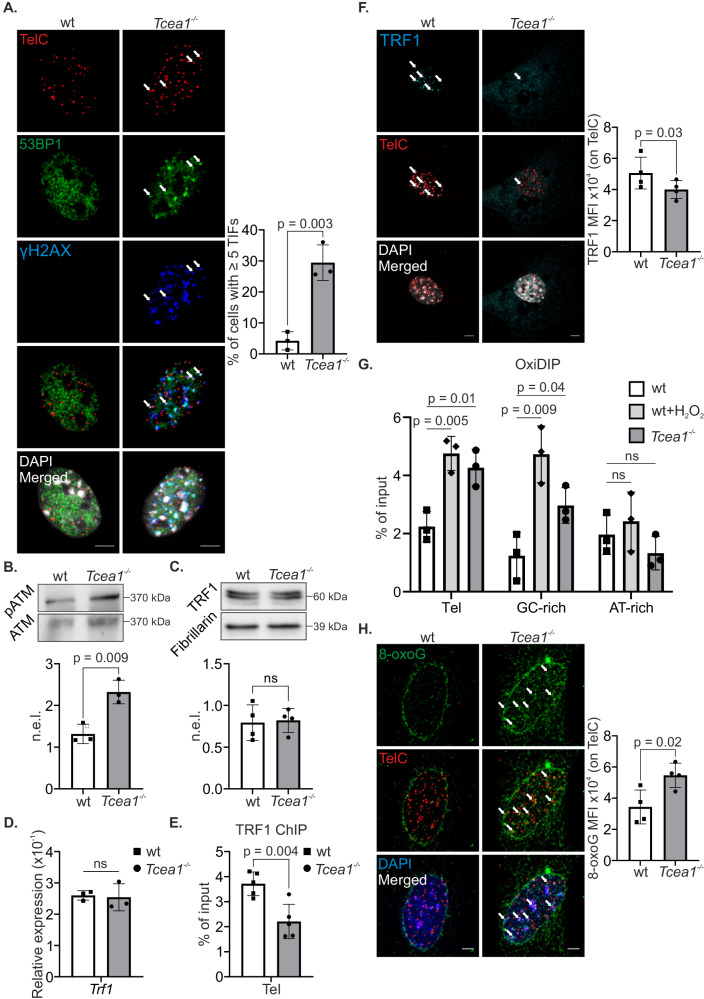
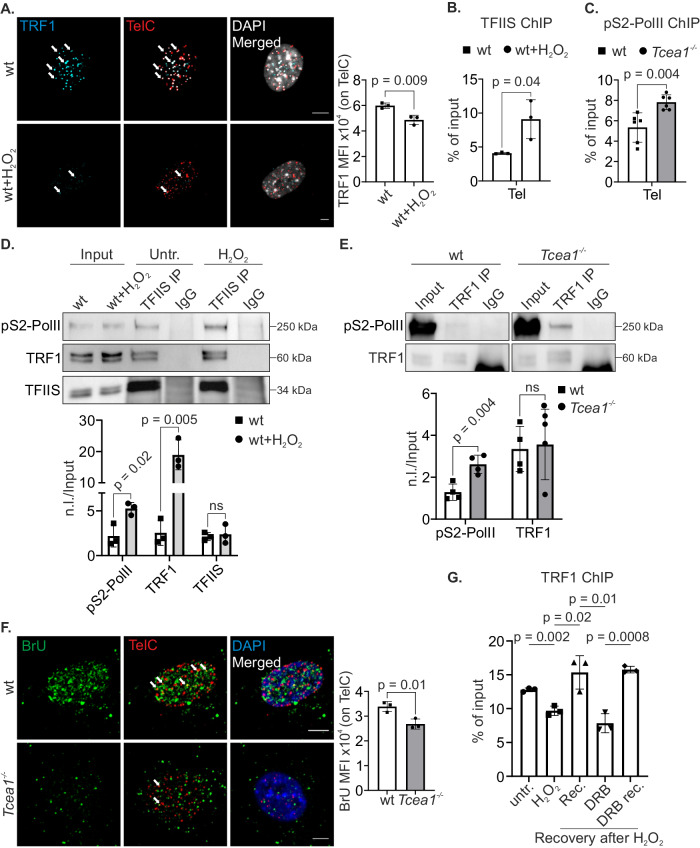
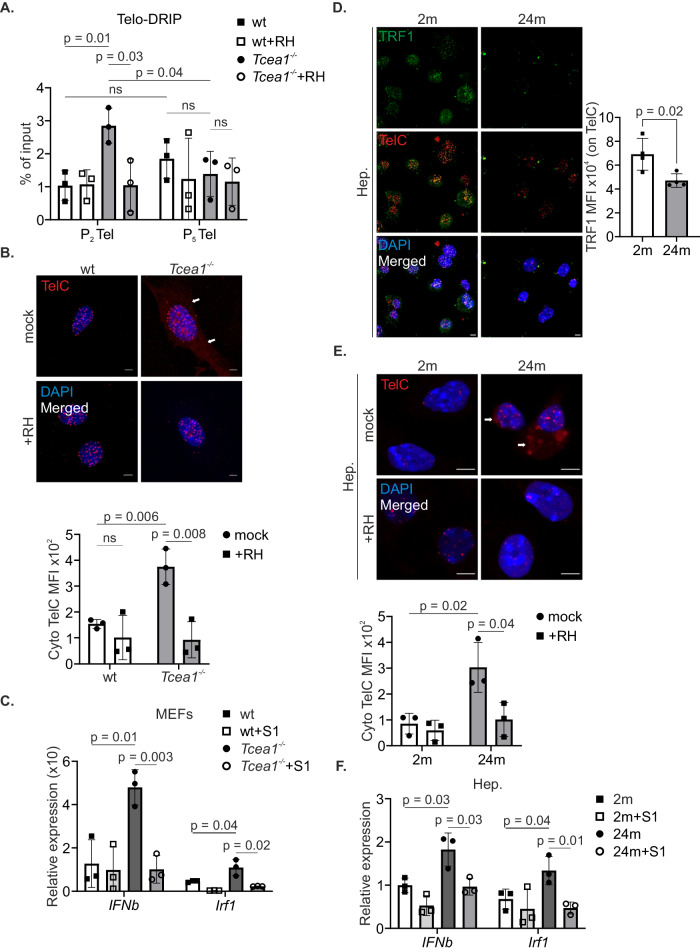
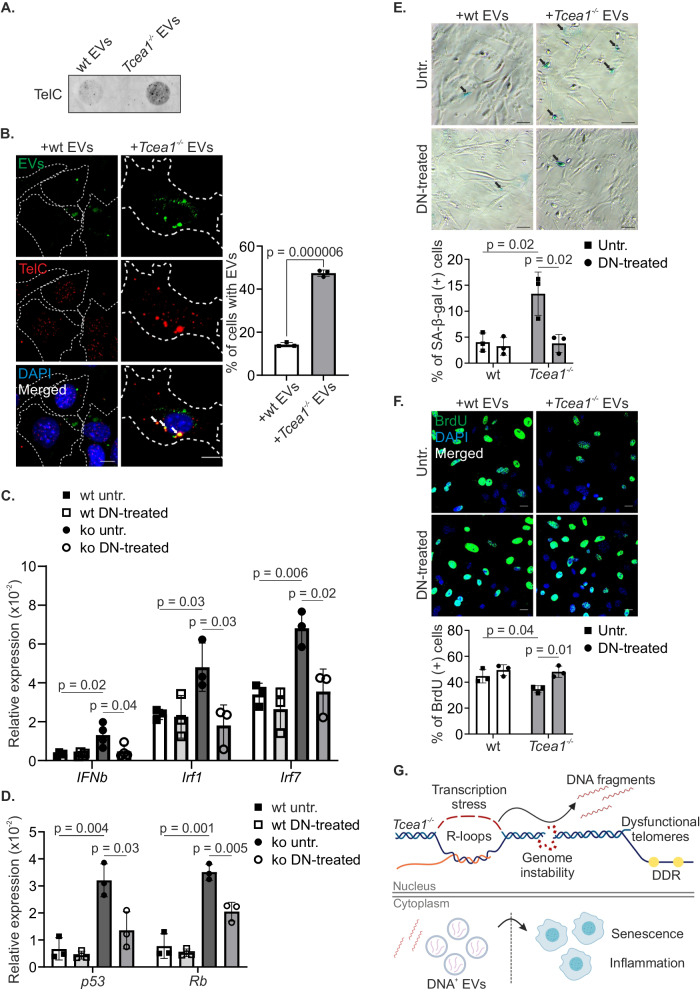
Transcription stress has been linked to DNA damage -driven aging, yet the underlying mechanism remains unclear. Here, we demonstrate that Tcea1-/- cells, which harbor a TFIIS defect in transcription elongation, exhibit RNAPII stalling at oxidative DNA damage sites, impaired transcription, accumulation of R-loops, telomere uncapping, chromatin bridges, and genome instability, ultimately resulting in cellular senescence. We found that R-loops at telomeres causally contribute to the release of telomeric DNA fragments in the cytoplasm of Tcea1-/- cells and primary cells derived from naturally aged animals triggering a viral-like immune response. TFIIS-defective cells release extracellular vesicles laden with telomeric DNA fragments that target neighboring cells, which consequently undergo cellular senescence. Thus, transcription stress elicits paracrine signals leading to cellular senescence, promoting aging.


Conflict of interest statement

The authors declare no competing interest.

Figures

Fig. 1
Fig. 1. Tcea1–/– MEFs exhibit a senescent phenotype.
A Representative images of E12.5 wt and Tcea1–/– embryos. B TFIIS protein levels in whole-cell extracts from wt and Tcea1–/– MEFs. β-TUBULIN (β-TUB) was used to normalize protein expression levels (n.e.l., n = 3 biologically independent replicates). C SA-β-gal assay in wt and Tcea1–/– MEFs (n = 3). Scale bar is set at 20 μM. D p16, p53 and Rb mRNA levels in wt and Tcea1–/– MEFs (n = 3). E Cell cycle profiling and representative images of FACS analysis of wt and Tcea1–/– MEFs. The graph shows the percentage of wt and Tcea1–/– MEFs in each cell cycle phase (n = 3). F Carboxyfluorescein Diacetate Succinimidyl Ester (CFSE) proliferation assay and representative images of FACS analysis of wt and Tcea1–/– MEFs. The graph represents the percentage of cells that divided 0 to 4 times (D0-D4), during a 48 h time-period, according to CFSE fluorescence intensity analysis (n = 3). G Bubble plot of the Panther pathway enrichment analysis. The significantly enriched Gene Ontology (GO) terms of differentially expressed genes (DEGs) in Tcea1–/– compared to wt MEFs [meta–false discovery rate (FDR) ≤ 0.05, fold change ≥ ±1.3, n = 4] are indicated. The color scale indicates the number of genes in each corresponding pathway (up-regulated: red scale, down-regulated: blue scale) and the dot size indicates the FDR threshold. Data analysis was performed using two-tailed Student’s t test. All data are presented as mean values ± SEM. Unless otherwise indicated, n = biologically independent experiments and scale bars are set at 5μm. Source data are provided as a Source Data file.
Fig. 2
Fig. 2. Transcription stress in Tcea1–/– MEFs leads to genomic instability.
A Immunostaining of 8-Oxoguanine (8-oxoG) in untreated wt and Tcea1–/– MEFs (n = 3). The graph depicts the 8-oxoG MFI per cell nucleus for untreated, H2O2-treated and NAC-treated cells. B Serine 2 (pS2)-phosphorylated RNAPII (pS2-PolII) in whole-cell extracts from wt and Tcea1–/– MEFs. The graph depicts the total RNAPII-normalized protein expression levels (n.e.l., n = 3). C Dot blot against 8-oxoG in pS2-PolII ChIP samples from wt and Tcea1–/– MEFs. The graph represents pS2-PolII ChIP samples normalized over input samples (n.l./Input, n = 3). D BrU incorporation in untreated wt and Tcea1–/– MEFs. The graph shows the BrU MFI per cell nucleus for untreated and DRB-treated cells (n = 3). E Dot blot against s9.6 in untreated and Rnase H-treated genomic DNA from wt and Tcea1–/– MEFs. The graph represents input samples normalized over Ethidium Bromide (EtBr) labeling, as a loading control (n = 3). F Immunofluorescence detection of γH2AX and 53BP1 co-localized foci in Tcea1–/– MEFs, in the presence or absence of transfected recombinant RNase H. The graph represents the percentage of cells with >3 co-localized γH2AX/53BP1 foci per cell nucleus (n = 4). G BrdU immunostaining under non-denaturing (Non-Den) conditions in wt and Tcea1–/– MEFs. The graph depicts the BrdU MFI per cell nucleus (n = 3). Data analysis was performed using two-tailed Student’s t test. All data are presented as mean values ± SEM. Unless otherwise indicated, n = biologically independent experiments and scale bars are set at 5 μm. Source data are provided as a Source Data file.
Fig. 3
Fig. 3. Impaired cell cycle progression due to telomere end fusions and telomere attrition in Tcea1–/– MEFs.
A Immunostaining of α-TUBULIN (α-TUB) in Tcea1–/– MEFs (n = 3). Graph depicts the percentage of cells with at least one abnormality (micronuclei – white arrows, chromatin bridge – yellow insert). B Immunofluorescence of cell cycle-synchronized wt and Tcea1–/– MEFs. Images show cells during the anaphase of the cell cycle (lagging chromosome - left arrow, chromatin bridge - right arrow). C Percentage of wt and Tcea1–/– MEFs at each cell cycle phase (n = 3). Percentage of wt and Tcea1–/– MEFs with (D). Anaphase bridges (n = 3). E Lagging chromosomes (n = 3). F At least one fusion event (n = 3, metaphases >20/genotype). G Telomeric sequences on a chromatin bridge of Tcea1–/– MEFs (white arrows). H Quantitative FISH of untreated and NAC-treated wt and Tcea1–/– MEFs for telomeric DNA (n = 3). The graph depicts the mean fluorescence intensity (MFI) per cell nucleus. I Immunostaining of γΗ2ΑΧ with FISH for telomeric DNA in Tcea1–/– metaphase spreads. White arrows denote γH2AX signal on telomeres. J Wt and Tcea1–/– metaphase spreads, in the presence or absence of SCR130 inhibitor. Telomeric DNA was detected by FISH (n = 3, metaphases >50/condition). White arrow in yellow frames: 1: chromosomes with telomere fusion. 2: chromosome with fragile telomere. 3: chromosome with short telomere. 4: chromosome with missing telomere. The graphs depict the percentage of metaphases with at least one fusion event (left), missing/short telomere (middle) or fragile telomere (right). K Telomeric DNA MFI per chromatid end of wt and Tcea1–/– MEFs. Dotted line represents the shortest wt telomere (n = 3). Data analysis was performed using two-tailed Student’s t test. All data are presented as mean values ± SEM. Unless otherwise indicated, n = biologically independent experiments and scale bars are set at 5 μm. Source data are provided as a Source Data file.
Fig. 4
Fig. 4. TRF1 release from Tcea1–/– telomeres is associated with telomere dysfunction induced foci (TIFs).
A Immunofluorescence of 53BP1 and γH2AX with in situ hybridization of telomeric DNA (TelC) in wt and Tcea1–/– MEFs. Arrows denote TIFs on telomeres. The graph depicts the mean percentage of cells presenting ≥5 TIFs (n = 3). B pATM protein levels in wt and Tcea1-/- MEFs whole-cell extracts (n = 3). The graph depicts the total ATM-normalized protein expression levels (n.e.l.). C TRF1 protein levels in whole-cell extracts from wt and Tcea1–/– MEFs. Fibrillarin was used to normalize protein expression levels (n.e.l., n = 4). D Trf1 mRNA levels in wt and Tcea1-/- MEFs (n = 3). E ChIP signals of TRF1 protein (shown as percentage of input after IgG normalization) on telomeres of wt and Tcea1-/- MEFs (n = 5). F Immunofluorescence of TRF1 with in situ hybridization of telomeric DNA (TelC) in wt and Tcea1–/– MEFs. The graph depicts the mean fluorescence intensity (MFI) of TelC in Tcea1–/– MEFs and wt controls (n = 4). G OxiDIP signals of 8-oxoG (shown as percentage of input after IgM normalization) on telomeres, GC-rich and AT-rich regions of untreated wt, H2O2-treated wt and untreated Tcea1–/– MEFs (n = 3). H Immunofluorescence against 8-oxoG with in situ hybridization of telomeric DNA (TelC) in wt and Tcea1–/– MEFs. White arrows indicate 8-oxoG signal on telomeres (n = 4). The graph depicts the 8-oxoG mean fluorescence intensity (MFI) on telomeric DNA (TelC) in Tcea1–/– and wt MEFs. Data analysis was performed using two-tailed Student’s t test. All data are presented as mean values ± SEM. Unless otherwise indicated, n = biologically independent experiments and scale bars are set at 5μm. Source data are provided as a Source Data file.
Fig. 5
Fig. 5. Transcription-associated TRF1 recruitment on telomeres.
A Immunofluorescence of TRF1 with in situ hybridization of telomeric DNA (TelC) in untreated and H2O2-treated wt MEFs. White arrows indicate cells with reduced TRF1 signal on telomeres. The graph shows the TRF1 MFI on telomeric DNA (TelC) in untreated and H2O2-treated wt MEFs (n = 3). B ChIP signals of TFIIS protein (shown as percentage of input after IgG normalization) on telomeres of untreated and H2O2-treated wt MEFs (n = 3). C ChIP signals of pS2-PolII protein on telomeres of wt and Tcea1–/– MEFs (n = 6). D Co-immunoprecipitation experiments using anti-TFIIS in nuclear extracts of untreated and H2O2-treated wt MEFs, analyzed by western blotting for pS2-PolII and TRF1. The graph represents normalized levels of IP samples over input samples (n.l./Input, n = 3). E Co-immunoprecipitation experiments using anti-TRF1 in nuclear extracts of wt and Tcea1–/– MEFs, analyzed by western blotting for pS2-PolII. The graph represents normalized levels of IP samples over input samples (n.l./Input, n = 3). F BrU incorporation in telomeres (Cy3-PNA TelC probe) of wt and Tcea1–/– MEFs (n = 3). The graph shows the BrU MFI per telomere. G ChIP signals of TRF1 protein on telomeres of wt MEFs (untr: untreated, H2O2: treatment with H2O2, Rec: H2O2-treated, washed and incubated for 16 h, DRB: H2O2-treated, washed and incubated with DRB for 16 h, DRB rec: H2O2-treated, washed, incubated with DRB for 16 h, washed and incubated for 6 h, n = 3). Data analysis was performed using two-tailed Student’s t test. All data are presented as mean values ± SEM. Unless otherwise indicated, n = biologically independent experiments and scale bars are set at 5 μm. Source data are provided as a Source Data file.
Fig. 6
Fig. 6. R-loop-derived cytosolic telomeric fragments in Tcea1–/– MEFs.
A DNA-RNA hybrids immunoprecipitation signals using the s9.6 antibody (shown as percentage of input after IgG normalization) on telomeres of wt and Tcea1–/– MEFs, cultured for two (P2) or five (P5) passages (n = 3). B Fluorescence in situ hybridization using a Cy3-PNA TelC probe in wt and Tcea1–/– MEFs, either untreated or transfected with RNase H (RH). The graph depicts the mean fluorescence intensity (MFI) of TelC in the cytoplasm of cells (n = 3). C Ifnβ and Irf1 mRNA levels wt and Tcea1–/– MEFs, untransfected or incubated with vesicle-delivered S1 nuclease (n = 3). D Immunofluorescence of TRF1 with in situ hybridization of telomeric DNA (TelC) in hepatocytes from 2-month- and 24-month-old mice. The graph depicts the mean fluorescence intensity (MFI) of TRF1 on telomeres of hepatocytes (n = 4). E Fluorescence in situ hybridization using a Cy3-PNA TelC probe in primary hepatocytes from 2-month- and 24-month-old mice, either untreated or transfected with RNase H (RH). The graph depicts the mean fluorescence intensity (MFI) of TelC in the cytoplasm of hepatocytes (n = 3). F Ifnβ and Irf1 mRNA levels in hepatocytes from 2-month and 24-month-old mice, untransfected or incubated with vesicle-delivered S1 nuclease (n = 3). Data analysis was performed using two-tailed Student’s t test. All data are presented as mean values ± SEM. Unless otherwise indicated, n = biologically independent experiments and scale bars are set at 5 μm. Source data are provided as a Source Data file.
Fig. 7
Fig. 7. Tcea1–/–-secreted, TelC-loaded EVs trigger bystander senescence.
A Dot blot using an Alexa488-PNA TelC probe in EVs isolated from wt and Tcea1–/– MEFs. B Immunofluorescence of ExoFlow-stained EVs with in situ hybridization of telomeric DNA (TelC) in wt and Tcea1–/– MEFs. White arrows indicate the presence of ExoFlow+;TelC+ EVs in the cytoplasm of cells. The white dashed line marks the cytoplasm of cells. The graph shows the percentage of wt and Tcea1–/– cells with ExoFlow+;TelC+ EVs (n = 3). C Ifnβ, Irf1 and Irf7 mRNA levels in wt MEFs incubated with untreated or DNase I-treated EVs from wt and Tcea1–/– MEFs (Ifnβ n = 4, Irf1 n = 3, Irf7 n = 3). D p53 and Rb mRNA levels in wt MEFs incubated with untreated or DNase I-treated (DN-treated) EVs from wt and Tcea1–/– MEFs (n = 3). E SA-β-gal assay in wt MEFs incubated with untreated or DNase I-treated EVs from wt and Tcea1–/– MEFs. The graph shows the percentage of SA-β-gal+ cells (n = 3). Scale bar is set at 20 μM. F BrdU incorporation in wt MEFs incubated with untreated or DNase I-treated EVs from wt and Tcea1–/– MEFs. The graph shows the percentage of BrdU+ cells (n = 3). G Transcription stress in Tcea1–/– cells, leads to impaired transcription, accumulation of R-loops, telomere uncapping, and genome instability, ultimately resulting in cellular senescence. The formation of R-loops contributes to the release of DNA fragments in the cytoplasm of cells, which, packed in EVs can trigger an immune response in neighboring cells, which consequently undergo cellular senescence. Data analysis was performed using two-tailed Student’s t test. All data are presented as mean values ± SEM. Unless otherwise indicated, n = biologically independent experiments and scale bars are set at 5 μm. Panel (G) created with BioRender.com released under a Creative Commons Attribution-NonCommercial-NoDerivs 4.0 International license. Source data are provided as a Source Data file.

Similar articles

Cited by

References

    1. Noe Gonzalez M, Blears D, Svejstrup JQ. Causes and consequences of RNA polymerase II stalling during transcript elongation. Nat. Rev. Mol. Cell Biol. 2021;22:3–21. doi: 10.1038/s41580-020-00308-8. - DOI - PubMed
    1. Lans H, Hoeijmakers JHJ, Vermeulen W, Marteijn JA. The DNA damage response to transcription stress. Nat. Rev. Mol. Cell Biol. 2019;20:766–784. doi: 10.1038/s41580-019-0169-4. - DOI - PubMed
    1. Schumacher B, et al. Delayed and accelerated aging share common longevity assurance mechanisms. PLoS Genet. 2008;4:e1000161. doi: 10.1371/journal.pgen.1000161. - DOI - PMC - PubMed
    1. Garinis GA, van der Horst GT, Vijg J, Hoeijmakers JH. DNA damage and ageing: New-age ideas for an age-old problem. Nat. Cell Biol. 2008;10:1241–1247. doi: 10.1038/ncb1108-1241. - DOI - PMC - PubMed
    1. Kamileri I, Karakasilioti I, Garinis GA. Nucleotide excision repair: new tricks with old bricks. Trends Genet. 2012;28:566–573. doi: 10.1016/j.tig.2012.06.004. - DOI - PubMed