. 2024 May 14;15(1):4067.
doi: 10.1038/s41467-024-48310-4.

Systematic dissection of tumor-normal single-cell ecosystems across a thousand tumors of 30 cancer types

Affiliations

Systematic dissection of tumor-normal single-cell ecosystems across a thousand tumors of 30 cancer types

Junho Kang et al. Nat Commun. .

Erratum in

Abstract

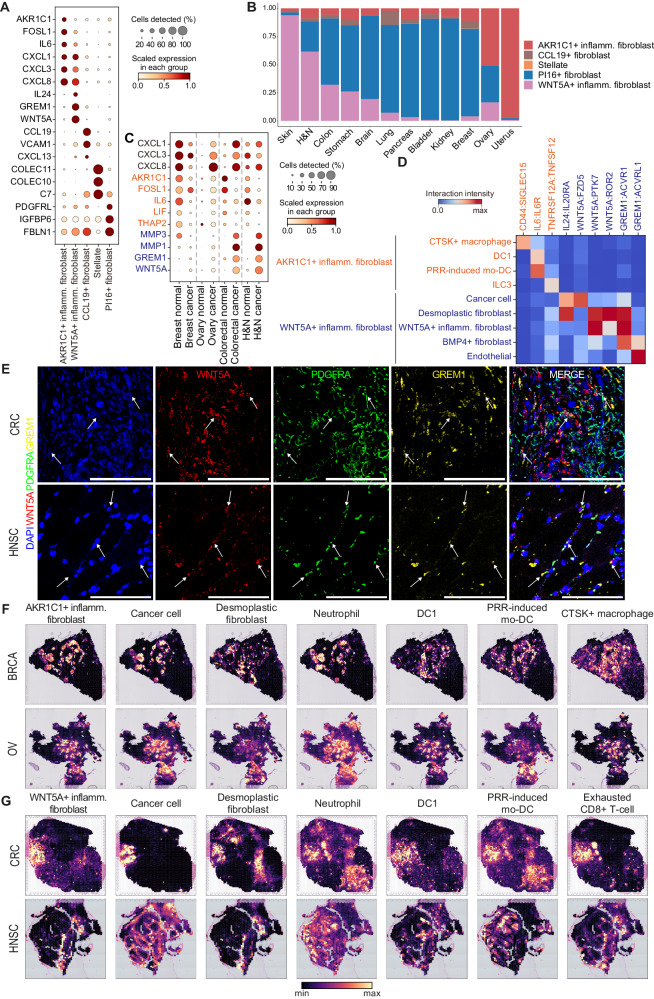
The complexity of the tumor microenvironment poses significant challenges in cancer therapy. Here, to comprehensively investigate the tumor-normal ecosystems, we perform an integrative analysis of 4.9 million single-cell transcriptomes from 1070 tumor and 493 normal samples in combination with pan-cancer 137 spatial transcriptomics, 8887 TCGA, and 1261 checkpoint inhibitor-treated bulk tumors. We define a myriad of cell states constituting the tumor-normal ecosystems and also identify hallmark gene signatures across different cell types and organs. Our atlas characterizes distinctions between inflammatory fibroblasts marked by AKR1C1 or WNT5A in terms of cellular interactions and spatial co-localization patterns. Co-occurrence analysis reveals interferon-enriched community states including tertiary lymphoid structure (TLS) components, which exhibit differential rewiring between tumor, adjacent normal, and healthy normal tissues. The favorable response of interferon-enriched community states to immunotherapy is validated using immunotherapy-treated cancers (n = 1261) including our lung cancer cohort (n = 497). Deconvolution of spatial transcriptomes discriminates TLS-enriched from non-enriched cell types among immunotherapy-favorable components. Our systematic dissection of tumor-normal ecosystems provides a deeper understanding of inter- and intra-tumoral heterogeneity.


Conflict of interest statement

The authors declare no competing interests.

Figures

Fig. 1
Fig. 1. Overview of the pan-cancer tumor-normal landscape at single-cell resolution.
A Overview of the scRNA-seq cohort across the 30 cancer types collected in this study. B Workflow of the tumor-normal single-cell transcriptomic atlas and NMF processing. UMAP visualization of a subset of the tumor-normal single-cell atlas colored by (C) cell types and (D) organ origins. E Graphical clustering schematics of NMF modules with automatized soup-effect detection algorithm and subsequent analyses.
Fig. 2
Fig. 2. Landscape of hallmark genes of tissue ecosystems across organs.
A Characterization of hallmark genes in tumor and normal ecosystems across organs. Cell type is noted on top of the heatmap and only the genes that are upregulated in four or more cancer types are depicted. Each box in the heatmap represents log2 fold-change values with positive values indicating upregulation in tumors. H&N, head and neck; DC, dendritic cell; NK, natural killer cell; Treg, regulatory T cell. B Detailed heatmap of hallmark genes identified in Fig. 2A across cancer and cell types. Each color in the heatmap represents log2 fold-change values with positive values indicating upregulation in tumors. H&N, head and neck; DC, dendritic cell; NK, natural killer cell; Treg, regulatory T cell. C Gene ontology analysis of tumor hallmark genes of diverse cell types using Enrichr. The color and size of the dot represent the odds ratio and p value from two-sided Fisher’s exact test, adjusted with the Benjamini-Hochberg method, respectively. PRR, pattern recognition receptor.
Fig. 3
Fig. 3. Deconvolution of the tumor-normal ecosystem into heterogeneous cell states.
UMAP visualization of (A) myeloid cell states and (B) corresponding reference component analysis of myeloid cells. NMF modules were graphically clustered and colored according to cell states (A). Then, cells were mapped to the reference components composed of myeloid cell state genes (B). DC, dendritic cell; mono-derived MΦ, monocyte-derived macrophage; mo-DC, monocyte-derived dendritic cell; pDC, plasmacytoid dendritic cell; PRR, pattern recognition receptor. UMAP visualization of (C) mesenchymal cell states and (D) corresponding reference component analysis of mesenchymal cells. NMF modules were graphically clustered and colored according to cell states (C). Then, cells were mapped to the reference components composed of mesenchymal cell state genes (D). E Ro/e analysis of tissue enrichments in mesenchymal cell states. The dotted vertical line represents where Ro/e is zero. F Circos plot illustrating co-occurrences between the cell states in normal (blue) and tumor (yellow) tissues. The length of the arcs represents the sum of co-occurrences with other cell states in adjacency. A longer arc indicates more frequent co-occurrence with other cell states. Basal sq, basal squamous state. DC, dendritic cell; Tex, exhausted CD8+ T cell; T-exclusion, T cell exclusion program; Treg, regulatory T cell. Source data are provided as a Source Data file.
Fig. 4
Fig. 4. Characterization of AKR1C1+ and WNT5A+ inflammatory fibroblasts.
A Dot plot of marker gene expressions of inflammatory fibroblast subtypes. Inflamm., inflammatory. B Distribution of inflammatory fibroblasts across organs where the y-axis represents the proportion of inflammatory fibroblasts in tumor tissues. H&N, head and neck; Inflamm., inflammatory. C Dot plot showing gene expression of AKR1C1+ and WNT5A+ inflammatory fibroblast marker genes in normal and tumor tissues of relevant organs. H&N, head and neck. D Ligand-receptor interactions of AKR1C1+ and WNT5A+ inflammatory fibroblasts with other cell types. The interaction intensity was calculated by multiplying the normalized expression values of ligands and receptors in each cell-cell pair. DC, dendritic cell; Inflamm., inflammatory; ILC3, type 3 innate lymphoid cells; mo-DC, monocyte-derived dendritic cell; PRR, pattern recognition receptor. E Representative (n = 3) images of in situ RNA smFISH detection of WNT5A (red), PDGFRA (green), and GREM1 (yellow) in the desmoplastic stroma of CRC (top) and HNSC (bottom) tissues. scale bar: 100 μm. Magnification: 20X. Spatial co-localization patterns of (F) AKR1C1+ and (G) WNT5A+ inflammatory fibroblast with other cell types in relevant organs, with colors representing cell abundance. DC, dendritic cell; Inflamm., inflammatory; mo-DC, monocyte-derived dendritic cell; PRR, pattern recognition receptor. Source data are provided as a Source Data file.
Fig. 5
Fig. 5. Tumor-specific occurrence of interferon-enriched and pro-tumorigenic community and determination of immunotherapy-predictive cell states.
Co-occurrence network in the (A) tumor, (B) normal, and (C) adjacent normal tissues. The color of the nodes and edges corresponds to the modularity community and the thickness of the edges corresponds to the magnitude of adjacency. DC, dendritic cell; EMT, epithelial-to-mesenchymal transition; ILC3, type 3 innate lymphoid cells; NK, natural killer cell; pDC, plasmacytoid dendritic cell; PRR, pattern recognition receptor; Texclusion, T cell exclusion program; Tfh, T follicular helper cells; Th17, T helper type 17; Treg, regulatory T cell. D Summary of the immunotherapy-treated bulk RNA-seq cohorts with response data used in this study. * indicates newly generated data. E Forest plot of immunotherapy-response predictive cell states and gene signatures from other studies through meta-analysis of immunotherapy-treated bulk RNA-seq cohorts (n = 1261 patients). The x-axis represents the odds ratio, in which the dotted vertical line represents an odds ratio of 1, and the y-axis denotes cell states and previously defined gene signatures. For each cell state, rectangles and extended lines represent odds ratios and 95% confidence intervals, respectively, calculated through meta-analysis from logistic regression for clinical response across immunotherapy-treated cohorts. Only cell states that achieved statistical significance are depicted. Cell states with odds ratios greater than 1 are those associated with favorable responses to immunotherapy. The colors correspond to the cell type categories of each cell state. APM, antigen-presenting machinery; DC, dendritic cell; EMT, epithelial-to-mesenchymal transition; IFNG, interferon-gamma; NK, natural killer cell; pDC, plasmacytoid dendritic cell; Treg, regulatory T cell. Source data are provided as a Source Data file.
Fig. 6
Fig. 6. Spatial transcriptome analysis of tumor ecosystems across multiple cancer types.
A Overview of pan-cancer spatial transcriptome analyzed in this study. B Boxplot comparing TLS signature scores between TLS and non-TLS spots. Statistical significance was calculated with the two-sided Wilcoxon rank sum test (p = 1.5e−5, n = 17). In the box plot, the center line, upper box limit, lower box limit, and whiskers represent the median, first quartile, third quartile, and 1.5x interquartile range, respectively. C Predictive power of TLS signature for immunotherapy response in bulk RNA-seq cohorts treated with immunotherapy. The rectangle and extended lines represent the odds ratio and 95% confidence interval, respectively, calculated using TLS signature scores through meta-analysis from logistic regression for clinical response across immunotherapy-treated cohorts (p = 1.4e−5, n = 1261). Nominal two-sided p-values were obtained from the meta-analysis results of the logistic regression analysis. D Barplot of TLS-enriched cell types using TLS-labeled RCC spatial transcriptomes. The statistical significance of the enrichment or depletion was calculated using the two-sided Wilcoxon rank sum test and adjusted with the Benjamini-Hochberg method. Only the cell types reaching statistical significance are presented. DC, dendritic cell; ILC3, type 3 innate lymphoid cells; mono-MΦ, monocyte-derived macrophage; NK, natural killer cell; Tfh, T follicular helper cells; Th17, T helper type 17; Treg, regulatory T cell, Trm; Tissue-resident memory. E Spatial co-localizations of TLS signatures with diverse cell types across cancer types. DC, dendritic cell; Treg, regulatory T cell. Source data are provided as a Source Data file.

References

    1. Hanahan, D. & Weinberg, R. A. Hallmarks of cancer: the next generation. Cell144, 646–674 (2011). - PubMed
    1. Patel, A. P. et al. Single-cell RNA-seq highlights intratumoral heterogeneity in primary glioblastoma. Science344, 1396–1401 (2014). - PMC - PubMed
    1. Puram, S. V. et al. Single-cell transcriptomic analysis of primary and metastatic tumor ecosystems in head and neck cancer. Cell171, 1611–1624.e24 (2017). - PMC - PubMed
    1. Bassez, A. et al. A single-cell map of intratumoral changes during anti-PD1 treatment of patients with breast cancer. Nat. Med.27, 820–832 (2021). - PubMed
    1. Cheng, S. et al. A pan-cancer single-cell transcriptional atlas of tumor infiltrating myeloid cells. Cell184, 792–809.e23 (2021). - PubMed