. 2024 Jun;25(6):2662-2697.
doi: 10.1038/s44319-024-00152-3. Epub 2024 May 14.

Conserved role of hnRNPL in alternative splicing of epigenetic modifiers enables B cell activation

Affiliations

Conserved role of hnRNPL in alternative splicing of epigenetic modifiers enables B cell activation

Poorani Ganesh Subramani et al. EMBO Rep. 2024 Jun.

Abstract

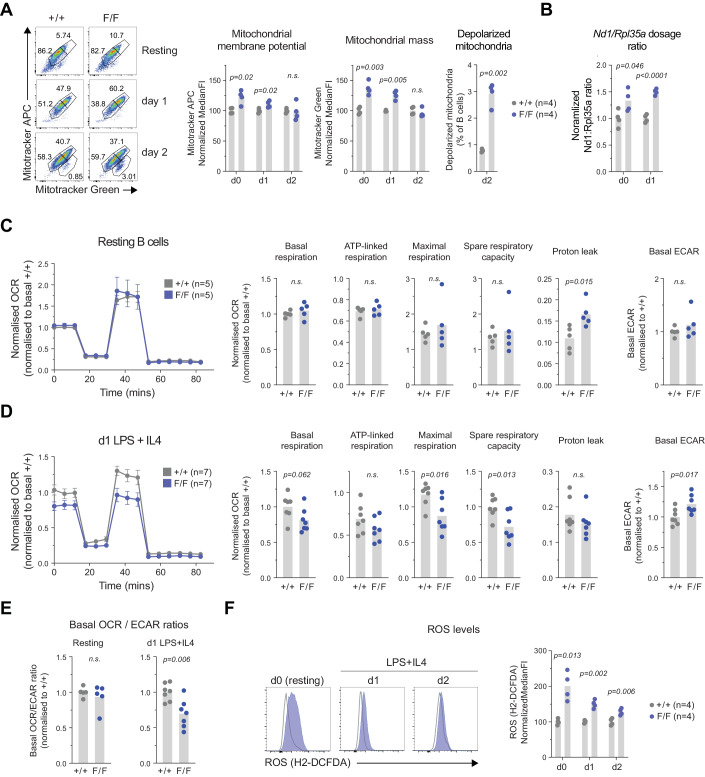
The multifunctional RNA-binding protein hnRNPL is implicated in antibody class switching but its broader function in B cells is unknown. Here, we show that hnRNPL is essential for B cell activation, germinal center formation, and antibody responses. Upon activation, hnRNPL-deficient B cells show proliferation defects and increased apoptosis. Comparative analysis of RNA-seq data from activated B cells and another eight hnRNPL-depleted cell types reveals common effects on MYC and E2F transcriptional programs required for proliferation. Notably, while individual gene expression changes are cell type specific, several alternative splicing events affecting histone modifiers like KDM6A and SIRT1, are conserved across cell types. Moreover, hnRNPL-deficient B cells show global changes in H3K27me3 and H3K9ac. Epigenetic dysregulation after hnRNPL loss could underlie differential gene expression and upregulation of lncRNAs, and explain common and cell type-specific phenotypes, such as dysfunctional mitochondria and ROS overproduction in mouse B cells. Thus, hnRNPL is essential for the resting-to-activated B cell transition by regulating transcriptional programs and metabolism, at least in part through the alternative splicing of several histone modifiers.

Keywords: Alternative Splicing; Antibody Response; B Cell Activation; RNA Binding Protein; hnRNP.


Conflict of interest statement

The authors declare no competing interests.

Figures

Figure 1
Figure 1. hnRNPL loss in peripheral B cells leads to a cell-intrinsic defect in antibody response.
(A) Expression levels of Hnrnpl, Hnrnpll, and Ptbp1 in mature B cell subpopulations. Follicular (Fo), marginal zone (MZ), centrocyte (CC), and centroblast (CB) germinal center (GC) B cells, plasmablasts (PB), and plasma cells (PC) from Immgen (GSE127267), as well as in in vitro activated B cells (mean of four samples, GSE120309). (B) Splenocyte counts (B) in CD21-cre (+/+) (n = 6), CD21-cre HnrnplF/+ (F/+) (n = 9) and CD21-cre HnrnplF/F (F/F) (n = 12) mice 11 days post-immunization with NP-OVA. (C) Splenic B and T cell proportions for the mice in (B) (n = 6 +/+, n = 12 F/+, n = 12 F/F). (D) Serum anti-NP IgG1 titers for n mice per group, as indicated. Genotypes labeled as in (B), with WT mice being HnrnplF/+ mice. (E) Scheme of mixed bone marrow (BM) chimera experiment. Mice were reconstituted with BM cells from μMT mice and either CD21-cre HnrnplF/+ (F/+) or CD21-cre HnrnplF/F (F/F) mice in a 1:1 ratio. (F) Proportion and number of splenic B and T cells in mice made as in (E), 12 days after immunization with NP-OVA, (n = 9 F/+, n = 8 F/F). (G) Subpopulation of newly formed (NF), MZ, FO and GC B-cell subpopulations, for the mice in (F). (H) Anti-NP IgG1 titers in the serum of mice from (F) 11 days after immunizations. (I) Ex vivo activation of splenic B cells purified from CD21-cre HnrnplF/+ (F/+) and CD21-cre HnrnplF/F (F/F) mice and cell counts after 3 days (n = 9 mice per group). (J) Representative western blot and quantification of hnRNPL protein levels in B cells, resting (d0) or 4 days post-activation (d4), as in (I). Data information: In (BD, F, G), data were presented for individual mice with lines indicating mean values. (HJ) Data were presented as mean ± SD. Differences in group means were considered significant when P value p < 0.05, as analyzed by: (B, C), one-way ANOVA with post hoc Tukey’s multiple comparison test; (D, H) Two-way ANOVA test with Sidak’s multiple comparison test; (F, G, I, J), unpaired two-tailed t-test with Welch’s correction (*p < 0.05, **p < 0.01, ***p < 0.001, ****p < 0.0001). Data compiled from (B, C) four experiments, (D, FH) 2 experiments, (I) three experiments, (J) indicated the number of replicates, each a different mouse.
Figure 2
Figure 2. MZ and GC B cells are hypersensitive to hnRNPL loss.
(A) Scheme of RosamT/mG reporter mouse model. (B) Scheme of competitive BM chimera experiments. Irradiated WT mice were reconstituted with CD45.1 WT BM mixed 1:1 with BM from either CD45.2 RosamT/mG CD21-cre HnrnplF/+ (F/+) or RosamT/mG CD21-cre HnrnplF/F (F/F). (C) The proportion of splenic B cells in the recipient mice originating from BM cells of CD45.1 WT (gray) or CD45.2 that had evidence of Cre activity (GFP+, green) or not (tdTomato+, orange), with representative flow cytometry plot of the latter analysis, (n = 8 mice each group). (D) As in (C) for Splenic NF, MZ, FO, and GC B cell populations in the same mice. Data information: In (C, D) data were presented as stacked mean ± SD. Data were compiled from two experiments. For clarity, only significant (p < 0.05) differences by unpaired, two-tailed Mann–Whitney test are indicated (*p < 0.05, **p < 0.01, ***p < 0.001).
Figure 3
Figure 3. hnRNPL supports class switch recombination.
(A) Representative flow cytometry plot of isotype switched IgG1+ B cells as a function of cell division, tracked by dilution of CTV staining in GFP+ (green; hnRNPL-excised) and tdTomato+ (orange; non-excised) B cells from RosamT/mG CD21-cre HnrnplF/+ (F/+) or RosamT/mG CD21-cre HnrnplF/F (F/F), 4 days after activation with LPS/IL-4. The plots compile proportions of IgG1+ cells per cell division gate as shown in the representative plots (n = 4 mice each group). (B) Normalized read counts from RNA-seq of Sμ and Sγ1 germline transcripts (GLT) in WT (+/+) and hnRNPL-deficient (F/F) B cells 1 day after activation with LPS/IL-4 (n = 3 mice each group). (C) hnRNPL occupancy by ChIP-qPCR at indicated amplicons of the IgH locus in WT splenic B cells resting (d0) (n = 2 mice each group) or activated with LPS/IL-4 for 2 days (d2), (n = 4 mice each group). Data information: In (AC), data were presented with individual mice values with mean shown as lines or bars. Results were compiled from two experiments, except resting B cells in (C), one experiment. Statistical significance (p < 0.05) by (A) two-way ANOVA with Sidak’s multiple comparison test, (B) DESeq Padj value indicated, (C) two-tailed paired t-test (*p < 0.05, **p < 0.01, ***p < 0.001). Statistical test was not performed for amplicons with only two biological replicates.
Figure 4
Figure 4. hnRNPL loss causes apoptosis and cell cycle arrest of activated B cells.
(A) The proportions of GFP+ (green; Hnrnpl-excised) and tdTomato+ (orange; non-excised) B cells from RosamT/mG CD21-cre HnrnplF/+ (F/+) or RosamT/mG CD21-cre HnrnplF/F (F/F) in culture over time after ex vivo activation with LPS/IL-4, (n = 4 mice each group, except at day 2.5 when n = 2 mice each group). (B) Apoptosis estimated by Annexin V flow cytometry staining of GFP+ and tdTomato+ B cells from F/+ and F/F mice, cultured as in (A), (n = 4 mice each group, except at day 2.5 when n = 2 mice each group). (C) Representative flow cytometry plots to estimate proliferation by dilution of CellTrace Violet (CTV) dye of GFP+ and tdTomato+ B cells from F/+ and F/F mice, cultured as in (A). (D) Cell cycle phases quantified from flow cytometry staining of DNA content of GFP+ and tdTomato+ B cells from F/+ and F/F mice (n = 2 mice each group), cultured as in (A). (E) Growth curves of induced germinal center B (iGB) cells derived from F/+ and F/F mice splenic B cells cultured on feeder cells expressing CD40L and BAFF, supplemented with IL-4, (n = 4 mice in each group). GFP+ and tdTomato+ cells were not discriminated in this experiment. (F) Representative flow cytometry plots showing CTV dilution of GFP+ and tdTomato+ F/+ and F/F iGBs, cultured as in (E). (G) Cell cycle profile of cells in (F) and proportion of cells in each cell cycle stage (n = 4 mice each group). (H) RNA-seq volcano plot showing differential gene expression in hnRNPL-deficient (GFP+ cells from RosamT/mG CD21-cre HnrnplF/F) versus WT (GFP+ cells from RosamT/mG CD21-cre) splenic B cells activated ex vivo for 1 day with LPS/IL-4. (I) Plot of normalized enrichment scores (NES) for GSEA Hallmark terms in hnRNPL-deficient over WT cells. Significantly enriched terms are defined and colored by NES. (J) Normalized read counts from RNA-seq of selected genes in WT (+/+) and hnRNPL-deficient (F/F) activated B cells. (K) Representative western blot of hnRNPL and p53 protein levels in B cells, purified from CD21-cre (+/+) and CD21-cre HnrnplF/F (F/F) mice, resting (d0) or activated with LPS/IL-4 for 24 h (d1), (n = 3 mice per group). The asterisk indicates the p53 band, assigned based on controls run in parallel. Data information: In (A, B, D, E, G, J) data were presented as individual mice (biological replicates) values with means shown by lines or bars, (K) data are presented as mean normalized quantification. Results are compiled from (A, B, D, E, G, K) two experiments, (D) one experiment. Statistical significance (p < 0.05) by (B, E, G) unpaired, two-tailed t-test with Welch’s correction (*p < 0.05; **p < 0.01; ***p < 0.001), (H) DEseq2, (I) GSEA, (J) DESeq2 Padj value indicated with p < 0.1 considered significant, (K) one sample t-test for hnRNPL and unpaired two-tailed t-test for p53.
Figure 5
Figure 5. Conserved roles for hnRNPL in mouse and human cells.
(A) Comparison of Hallmark gene sets differentially enriched across cell types. (B) Proportion of lncRNAs in the up- and downregulated genes in hnRNPL-depleted cells. (C) Pie chart showing the proportion of hnRNPL ChIP-seq peaks at annotated transcripts and plot of the cumulative proportion of hnRNPL peaks as a function of the distance from the nearest transcription start site (TSS), in K562 cells. (D) Transcription factor (TF) motifs enriched at hnRNPL-bound gene promoters (hnRNPL peak ±2 kb from their TSS) in K562 cells. (E) Venn diagrams showing the overlap between MYC- or hnRNPL-occupied loci in K562 cells, and genes significantly upregulated or downregulated in hnRNPL-depleted versus WT K562 cells. Data information: In (A) data were presented as normalized enrichment scores calculated by the GSEA algorithm for gene sets significantly enriched (Padj <0.05) in ≥3 datasets. The “p53 pathway” was also selected because it is relevant for B cells.
Figure 6
Figure 6. Conserved splicing events in hnRNPL-deficient cells.
(A) Splicing changes in hnRNPL-deficient (GFP+ cells from RosamT/mG CD21-cre HnrnplF/F) versus WT (GFP+ cells from RosamT/mG CD21-cre) cells, activated ex vivo for 1 day with LPS/IL-4. Expression changes of the same genes are also indicated. (B) Venn diagram of the overlap between genes with significant splicing alterations and differentially expressed genes in hnRNPL-deficient versus WT control B cells. (C) Top ten enriched biological process GO terms among genes with significant splicing alterations in hnRNPL-deficient B cells. (D) Enrichment of the indicated biological processes among genes with significantly affected splicing for each cell type. X symbols indicate GOs that were not significantly enriched in the corresponding dataset. (E) Conservation of splicing events significantly changed upon hnRNPL depletion among the indicated cell types. All non-zero intersections of ≥6 datasets are shown. The inset shows the genes with conserved splicing changes in ≥6 mouse and human cell types. (F) The number of splicing events identified in (E) that contain each of the indicated hnRNPL-binding motifs. (G) Examples of conserved hnRNPL-regulated splicing events from (E), showing exon inclusion levels in the control (CTL) and hnRNPL-depleted cell types. The transcript schemes indicate the exons (in red, the exon more included in hnRNPL-deficient cells), positions of amino acids coded by the included exon, and stop codons in the respective human transcripts. (H) Electrophoresis gel and quantification of RT-PCR products for the Sirt1 canonical and alternatively spliced non-canonical transcript, including the intermediate exon, in resting splenic B cells from CD21-cre (+/+), CD21-cre HnrnplF/+ (F/+) and CD21-cre HnrnplF/F (F/F) mice. (I) Representative western blot and quantification of the global levels of selected histone marks in resting and activated (LPS/IL-4 for 24 h) mouse splenic B cells purified from the indicated mice (as in H). Data information: In (A, G) data were mean inclusion level difference between hnRNPL-deficient and control B cells, for transcripts with splicing events within ≥10% and ≤95% difference between genotypes, FDR <0.1 and average junction read count ≥10, as calculated by rMATS, except for (G) dotted lines that indicate events that were detected at FDR <0.2, but did not pass more stringent thresholds of FDR <0.1, Inclusion level difference ≥10% and ≤95% and average junction read count ≥10. In (C, D), data shows -log10Padj value from Fisher’s one-tailed test, corrected for multiple testing with the default gProfiler g:SCS algorithm. In (E, F) data shows numbers of splicing events. In (H), data represent relative levels of canonical Sirt1 mRNA quantified by RT-qPCR (n = 2 mice per genotype, biological replicates), (I) data were densitometry quantification of western blot signals for individual mice, normalized to the control mice (n = 3 mice per genotype, from two experiments). P values from one sample t-test.
Figure 7
Figure 7. Mitochondrial defects precede B cell activation defects in hnRNPL-deficient B cells.
(A) Representative flow cytometry plots and quantification summarizing mitotracker APC and mitotracker green signal, as well as a proportion of B cells with depolarized mitochondria in purified resting (d0) and activated (LPS/IL-4) splenic B cells from CD21-cre (+/+), CD21-cre HnrnplF/+ (F/+) and CD21-cre HnrnplF/F (F/F) mice at days 1 (d1) and 2 (d2). (n = 4 mice per group). (B) Nd1 to Rpl35a gene dosage ratio calculated by RT-qPCR in cells from (A). (C) Normalized oxygen consumption rate (OCR) from Seahorse mitochondrial stress test (Mean ± SEM), and plots showing derived parameters of mitochondrial basal, ATP-linked, maximal, spare respiratory capacity, and mitochondrial proton leak, as well as ECAR measurement, in purified resting splenic B cells (n = 5 mice per group). (D) as in (C), but for B cells 1 day after activation with LPS/IL-4 (n = 7 mice per group). (E) Basal OCR to ECAR ratio for cells in (C) and (D). (F) Representative flow cytometry plots and quantification summarizing normalized median fluorescence intensity of ROS staining in resting and B cells activated with LPS/IL-4 (n = 4 mice per group). Data information: In (AF), data were represented as individual mice values with mean shown as bars. Plots compile results from (A, B) two experiments, (CE) three experiments, (F) two experiments. (AF) statistical significance (p < 0.05) tested by unpaired two-tailed t-test with Welch’s correction.
Figure EV1
Figure EV1. Characterization of mice with Hnrnpl deletion in B cells (Related to Figs. 1 and 2).
(A) Body and spleen weights in CD21-cre (+/+), CD21-cre HnrnplF/+ (F/+) and CD21-cre HnrnplF/F (F/F) mice 11 days post-immunization with NP-OVA. Data compiled from multiple mice (n = as indicated) and 4 experiments. (B) Splenic B and T cell counts for the mice in (A). (C) GC B cell counts for the mice in (A). (D) Gating and representative flow cytometry plot and proportions of splenic NF, MZ, FO, and GC B cell subpopulations for the mice in (A). (E) Body and spleen weights and splenocyte counts, of irradiated mice that received BM cells from μMT mice and either CD21-cre HnrnplF/+ (F/+) or CD21-cre HnrnplF/F (F/F) mice, (n = 9 F/+, n = 8 F/F. Data compiled from two experiments. (F) Initial proportion of CD45.1:CD45.2 BM cell mixes from CD45.1 WT and CD45.2 either RosamT/mG CD21-cre HnrnplF/+ (F/+) or RosamT/mG CD21-cre HnrnplF/F (F/F), used for reconstituting irradiated C57BL6/J CD45.2 mice. (G) Total B cell counts (symbols are individual mice) and proportion of splenic B cell subpopulations (with representative flow cytometry plots below) in mice reconstituted with BM mixes from (F), n = 8 mice per group, from two experiments. (H) Representative flow cytometry plots of the proportions of splenic B cell subpopulations newly formed (NF), marginal zone B (MZ), follicular B (Fo), and germinal center (GC) B cells in each group of mice reconstituted with BM mixes from (F). Data information: In (AE, G leftmost panel), data were presented for individual mice with lines indicating mean values. In (G), data were presented as mean ± SD. Statistical tests were: (AD) one-way ANOVA with post hoc Tukey’s multiple comparison test, (E) unpaired two-tailed t-test with Welch’s correction, (G) unpaired, two-tailed Mann–Whitney test, with p < 0.05 considered as significant differences in group means.
Figure EV2
Figure EV2. Cellular and transcriptional effects of hnRNPL loss in B cells (Related to Fig. 3).
(A) Representative flow cytometry plots showing the proportions of hnRNPL-excised (GFP+; green) and non-excised (tdTomato+; orange) splenic B cells from RosamT/mG CD21-cre HnrnplF/+ (F/+) or RosamT/mG CD21-cre HnrnplF/F (F/F), before and after (day 3) ex vivo activation with LPS/IL-4. (B) Representative flow cytometry histograms of parameters indicating cell size (FSC) and granularity (SSC) of activated B cells from (A), (n = 4 mice per group). (C) Top ten KEGG pathways enriched in genes upregulated in hnRNPL-deficient versus WT cells. The dendrograms indicate the degree of similarity (shared genes) between pathways. (D) Top ten KEGG pathways enriched in genes downregulated in hnRNPL-deficient versus WT cells. Legends, as in (C). (E) Quantification of gene expression by RT-qPCR for p21 (Cdkn1a), pro- and antiapoptotic factors in B cells, resting (d0) or activated (48 h post-LPS/IL-4) (d2), from CD21-cre HnrnplF/+ (F/+) or CD21-cre HnrnplF/F (F/F) mice, (n = 4 mice each group). Data information: In (B, E), data were presented for individual mice with lines or bars indicating mean values. Data compiled from two experiments. Statistical significance (p < 0.05) by unpaired, two-tailed t-test with Welch’s correction (*p < 0.05; **p < 0.01; ***p < 0.001).
Figure EV3
Figure EV3. Conserved roles of hnRNPL – (Related to Fig. 5).
(A) Quantile-normalized expression levels of HNRNPL and HNRNPLL in the indicated control (CTL) or hnRNPL-depleted cells, and ratio of HNRNPL over HNRNPLL read counts in each control cell type. (B) Quantile-normalized expression levels of the indicated genes in the various control or hnRNPL-depleted cells. (C) hnRNPL occupancy by ChIP-qPCR at the indicated loci in WT splenic B cells resting or activated (LPS/IL-4 for 2 days) and normalized expression levels of the corresponding genes in the same cells (GSE90094). (D) Comparison of significantly (adjusted p value <0.1 and fold-change ≥1.5) up- and downregulated genes upon hnRNPL depletion shared by the indicated cell types. All non-zero intersections of ≥6 datasets are shown. The insets show the relative expression (log2 fold-change compared to Control) of selected genes in the same cell types. Data information: In (A, B) data points are individual datasets, in (C) data points are individual mice with bars indicating means (n = 2 or 4 biological replicates, from two experiments). Statistical testing was done for amplicons with four replicates by two-tailed paired t-test.
Figure EV4
Figure EV4. Comparison of hnRNPL depletion effects among cell types (Related to Fig. 6).
(A) Number of splicing changes detected in different hnRNPL-deficient cell types as a function of read depth. Read length and species of the datasets are indicated by codes (legends), as well as number of replicates per condition (in parenthesis). (B) Mean exon inclusion levels for the indicated splicing events in control (CTL) and hnRNPL-depleted cell types. The transcript schemes indicate the exons (in red, the exon more included in hnRNPL-deficient cells), positions of amino acids coded by the included exon and stop codons in the respective human transcripts. (C) Sashimi plot showing the inclusion of an intermediate exon in SIRT1 regulated by hnRNPL status in selected cell types. (D) Quantile-normalized expression levels of indicated genes in the various CTL or hnRNPL-depleted cell types. (E) Representative western blot and quantification of hnRNPL protein levels in CH12-F3 cells expressing shRNA control or targeting hnRNPL (n = 2 biological replicates). Steady-state levels of canonical and non-canonical Sirt1 transcript isoforms measured by RT-qPCR normalized to the sh-Control (n = 3 biological replicates). (F) Decay rates and half-lives of canonical and non-canonical Sirt1 isoforms following transcription inhibition with 100 μM DRB in sh-Control and sh-hnRNPL CH12-F3 cells measured by RT-qPCR (n = 3 biological replicates). Data information: In (A, B, D), data points represent individual datasets. In (E, F), data points are biological replicates with bars indicating means. Statistical significance (p < 0.05) tested by unpaired two-tailed t-tests with Welch’s correction.
Figure EV5
Figure EV5. Mitochondrial function-related gene expression (Related to Fig. 7).
(A) Expression of the indicated genes from RNA-seq of splenic B cells activated ex vivo for 1 day with LPS/IL-4 from hnRNPL-deficient (GFP+ cells from RosamT/mG CD21-cre HnrnplF/F) and WT (GFP+ cells from RosamT/mG CD21-cre) mice. (B) Heatmap of selected genes in individual biological replicates from RNA-seq from data in Dataset EV1. (C) Representative flow cytometry histograms of ROS levels measured by the CM-H2DCFDA probe in CH12-F3 cells expressing shRNA targeting hnRNPL (sh-hnRNPL) or control (sh-Control). (n = 4 biological replicates per genotype from two experiments). (D) Relative expression level of selected genes measured by RT-qPCR in resting (d0) and ex vivo LPS/IL-4-activated splenic B cells from CD21-cre (+/+) and CD21-cre HnrnplF/F (F/F) mice. (n = 4 biological replicates per genotype from two experiments). Data information: In (A, C, D), data points are individual biological replicates with bars indicating means; in (B), row normalized data, both using values from Dataset EV1. Statistical significance (P adj <0.1 or p < 0.05) was tested (A) by Deseq2, (C, D)) by unpaired two-tailed t-tests with Welch’s correction.

References

    1. Akkaya M, Traba J, Roesler AS, Miozzo P, Akkaya B, Theall BP, Sohn H, Pena M, Smelkinson M, Kabat J, et al. Second signals rescue B cells from activation-induced mitochondrial dysfunction and death. Nat Immunol. 2018;19:871–884. doi: 10.1038/s41590-018-0156-5. - DOI - PMC - PubMed
    1. Anders S, Huber W. Differential expression analysis for sequence count data. Genome Biol. 2010;11:R106. doi: 10.1186/gb-2010-11-10-r106. - DOI - PMC - PubMed
    1. Begum NA, Stanlie A, Nakata M, Akiyama H, Honjo T. The histone chaperone Spt6 is required for activation-induced cytidine deaminase target determination through H3K4me3 regulation. J Biol Chem. 2012;287:32415–32429. doi: 10.1074/jbc.M112.351569. - DOI - PMC - PubMed
    1. Bhattacharya S, Levy MJ, Zhang N, Li H, Florens L, Washburn MP, Workman JL (2021) Gene expression omnibus GSE151296 (https://www.ncbi.nlm.nih.gov/geo/query/acc.cgi?acc=GSE151296). [DATASET]
    1. Bhattacharya S, Levy MJ, Zhang N, Li H, Florens L, Washburn MP, Workman JL. The methyltransferase SETD2 couples transcription and splicing by engaging mRNA processing factors through its SHI domain. Nat Commun. 2021;12:1–16. doi: 10.1038/s41467-021-21663-w. - DOI - PMC - PubMed