. 2024 Aug;56(8):1701-1711.
doi: 10.1038/s41588-024-01745-3. Epub 2024 May 14.

GAGE-seq concurrently profiles multiscale 3D genome organization and gene expression in single cells

Affiliations

GAGE-seq concurrently profiles multiscale 3D genome organization and gene expression in single cells

Tianming Zhou et al. Nat Genet. 2024 Aug.

Abstract

The organization of mammalian genomes features a complex, multiscale three-dimensional (3D) architecture, whose functional significance remains elusive because of limited single-cell technologies that can concurrently profile genome organization and transcriptional activities. Here, we introduce genome architecture and gene expression by sequencing (GAGE-seq), a scalable, robust single-cell co-assay measuring 3D genome structure and transcriptome simultaneously within the same cell. Applied to mouse brain cortex and human bone marrow CD34+ cells, GAGE-seq characterized the intricate relationships between 3D genome and gene expression, showing that multiscale 3D genome features inform cell-type-specific gene expression and link regulatory elements to target genes. Integration with spatial transcriptomic data revealed in situ 3D genome variations in mouse cortex. Observations in human hematopoiesis unveiled discordant changes between 3D genome organization and gene expression, underscoring a complex, temporal interplay at the single-cell level. GAGE-seq provides a powerful, cost-effective approach for exploring genome structure and gene expression relationships at the single-cell level across diverse biological contexts.


Conflict of interest statement

Competing interests

Z.D. is listed as the inventor on a provisional patent application that covered the GAGE-seq experimental protocol filed by the University of Washington. No competing interests are declared by the other authors.

Figures

Figure 1.
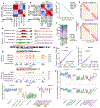
Figure 1.. Overview and validation of GAGE-seq.
a. Schematic representation of the GAGE-seq workflow detailing the simultaneous single-cell profiling of 3D genome architecture and gene expression. b-e. Validations demonstrating the specificity of GAGE-seq using mixed experiments with the human (K562) and mouse (NIH3T3). b and d. Scatter plots showing the collision level in the GAGE-seq scHi-C (b) and scRNA-seq (d) libraries, and histograms showing the binomial distribution of reads mapped to hg38 (top) and mm10 (right). c. Scatter plot showing the cis:trans ratio of scHi-C reads. e. Scatter plot showing the well-separation of scHi-C and scRNA reads of valid cellular indices from that of empty indices. Mouse is colored in green, human in orange, collisions in red, and empty indices in gray.
Figure 2.
Figure 2.. High-quality scHi-C and scRNA-seq data generated by GAGE-seq.
a. Pearson’s correlation between the aggregated scHi-C profiles from GAGE-seq replicates and the bulk in situ Hi-C data. b. Comparison of aggregated scRNA-seq profiles of GAGE-seq replicates with NEAT-seq, SHARE-seq, and SNARE-seq256. Pearson’s correlation is shown. c. Decay curves of chromatin contact for the GAGE-seq scHi-C libraries. d. Comparison of aggregated contact maps between two GAGE-seq K562 replicates (upper), and between the combined GAGE-seq K562 library and an in situ Hi-C library (lower). e. Comparison of A/B compartments and TAD-like domain calling at the human beta-globin locus between GAGE-seq (pseudo bulk) and in situ Hi-C. f. RNA read distribution across gene bodies in the GAGE-seq scRNA libraries. g. Aggregated single-cell gene expression profiles at the GAPDH locus. Upper panel: scRNA-seq signals of GAGE-seq libraries of K562, GM12878, and MDS-L cells (hg38). Lower panel: scRNA-seq signals of SHARE-seq in GM12878 cells (hg19). h. Reproducibility between two biological replicates of GAGE-seq scHi-C libraries. i. Reproducibility between two biological replicates of GAGE-seq scRNA libraries. r statistics are shown. j. Comparison of GAGE-seq scHi-C library size with published scHi-C,–,,– and co-assay methods,,. k. Comparison of scRNA-seq library size (upper) and the number of detected genes (lower) with published co-assay methods,,,,,–.
Figure 3.
Figure 3.. Cell types in mouse cortex characterized by GAGE-seq scHi-C and scRNA-seq.
a and c. UMAP visualization of mouse cortex scRNA-seq (a) and scHi-C profiles (c) from GAGE-seq. Insets: UMAP visualization of excitatory neuron subtypes (top) and inhibitory neuron subtypes (bottom). b. Cell type-specific expression (based on scRNA-seq in GAGE-seq) of known marker genes, including glial types, neuronal types, and neuron subtypes. d. Visualization of cell type-specific 3D chromatin architecture and gene expression at representative gene loci. Left: aggregated single-cell insulation score (100-Kb resolution, upper) and gene expression (lower) at the Girk2 locus and the Rbfox1 locus. Right: aggregated contact maps (50-Kb resolution) of the Girk2 locus (top panel, excitatory vs inhibitory neurons) and the Rbfox1 locus (low panel, L4 & L4/5 IT CTX vs L2/3 CTX). Cell types selected in the right panels are highlighted by green lines (higher expression) or red lines (lower expression) in the corresponding left panels. e. UMAP visualization of the integration of GAGE-seq and a MERFISH dataset. f. Inferred spatial patterns of gene expression and 3D genome features of L5 IT CTX marker genes. g. In situ plots of inferred single-cell gene expression (left) and scA/B value (right) for L5 IT CTX marker genes. Layer 3 was highlighted by black arrows in panels (f) and (g). The cell type abbreviations are based on the naming convention used in.
Figure 4.
Figure 4.. 3D genome features inform cell type-specific gene expressions in the mouse cortex.
a. Correlations between gene expression and 3D genome features across neuron cell types. Upper row: inhibitory (n=508) vs. excitatory (n=1938). Lower row: Pvalb (n=188) vs. other inhibitory (n=320). Left column: correlation between differential expression and differential 3D genome feature (Pearson’s correlation coefficients and the P-values from one-sided tests for nonzero correlations shown). Middle column: volcano plot of differential scA/B value and single-cell insulation score; Right column: volcano plot of differential expression. P-values from one-sided t-tests with unequal variance are shown in middle and right columns. b. Single-cell level correlation of gene expression with scA/B value (upper) or insulation score (lower) in inhibitory neurons (432 genes) and Pvalb (198 genes), respectively (Spearman’s correlation coefficients and the P-values from one-sided tests for nonzero correlations shown). c. Comparison of A/B compartment (200-Kb resolution) of the Erbb4 locus between inhibitory and excitatory neurons. Pearson’s correlation matrices of aggregated contact maps (top) and the A/B compartment scoretracks (bottom) are shown. d. Comparison of the pseudo-bulk contact map (50-Kb resolution) of the Erbb4 locus between Pvalb and other inhibitory subtypes. Pseudo-bulk contact maps (upper) and the insulation scores (bottom) are displayed. Two Pvalb-specific strides (white arrow) and melted TAD (black arrow) are shown in the top panel. The gene body is shown right under the contact matrices in (c) and (d), while the bottom panels highlight differential 3D genome features with light red boxes. e. Loop example in Pvalb (lower) and Sst and Meis2 (upper) inhibitory subtypes at 10-Kb resolution. Aggregated contact maps, regulatory element annotations (right), and TSS of Erbb4 (bittin arrow) are shown. f. Differential accessibility around the enhancer in Pvalb (left) vs. Sst and Meis2 (right), with a 1kb enhancer region highlighted (black arrow). The P-values of one-sided Mann-Whitney U tests are shown. g. Loop vs. non-loop contacts correlation with expression. P-values from two-sided tests for nonzero Spearman’s correlation coefficients are shown (n=3,105 cells).
Figure 5.
Figure 5.. Integrative analysis of GAGE-seq and chromatin accessibility in the mouse cortex.
a. Correlation coefficient (n=3,105 cells) between expression and TSS-CRE interaction frequency for each gene-CRE pairs from Paired-seq data, grouped by genomic distance between TSS and CRE. b. Comparison between gene-CRE pairs corroborated by other sources (red) and those identified only from Paired-seq data (yellow). The P-value of two-sided Mann-Whitney U test is shown. c-e. The combined effect of 3D genome and accessibility on expression at the Epha4 locus. c. Correlation of interaction-expression for a specific gene-CRE pair at the Epha4 gene, with dots representing single cells colored by cell type. d. Expression (upper) and TSS-CRE interaction frequency (lower) comparison among excitatory subtypes, revealing heightened levels in IT and PT subtypes. The P-values of one-sided Mann-Whitney U tests are shown. e. Accessibility comparison around the TSS and CRE (chr1: 77410959-77411960) of the Epha4 gene among excitatory subtypes, showing higher accessibility IT and PT subtypes. The P-values of two-sided Mann-Whitney U tests are shown. IT and PT subtypes are compared against CT, NP, and L6b subtypes in (d) and (e). In panel (e), *: P<1e-3; **: P<1e-5; ***: P<1e-10; the P-values in the upper left plot are (from left to right): 2e-11, 7e-20, 8e-34, 7e-52; the P-values in the upper right plot are: 6e-4, 6e-8, 7e-6, 2e-6, 1e-4. f. Binding sites of transcription factors Twist2 and Arx at the CRE of the Epha4 gene, depicting both the canonical motif (top) and the identified binding motif sequence (bottom) for each TF.
Figure 6.
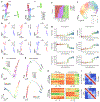
Figure 6.. Interplay between 3D genome variation and gene expression changes in human bone marrow differentiation.
a. UMAP visualization of GAGE-seq scRNA-seq (left) and scHi-C profiles (right) of human bone marrow CD34+ cells. b. Average expression of known marker genes on the UMAP plot. The 6 panels include n=124, 78, 24, 82, 126, and 356 genes for HSC, MPP, LMPP, MEP, MLP, and B-NK, respectively. c-d. Inferred B-NK lineage trajectory and pseudotime from scHi-C profiles (c) and jointly from scRNA-seq and scHi-C profiles (d), displayed by cell type (upper) and pseudotime (lower). e. Cell type compositions across 10 equally divided pseudotime bins. f. UMAP visualization of gene clusters determined by the temporal trend of expression and scA/B value. g. Temporal trends of gene expression (upper row), scA/B value (middle row), and single-cell insulation score (lower row) of gene clusters 9 (left column) and 10 (right column). h. scA/B (left) and single-cell insulation score (right) of the JAK1 (upper) and ITPR1 (lower) loci (at 100-Kb resolution). Each row represents a cell, ordered by the joint pseudotime from left to right. Heat maps were smoothed by a Gaussian kernel with a receptive field of 10 neighboring cells and 1 neighboring bin in each direction. i. Pseudo-bulk contact maps (at 50-Kb resolution) of HSC and B-NK at the JAK1 (upper) and ITPR1 (lower) loci.

Update of

References

    1. Dekker J, Belmont AS, Guttman M, Leshyk VO, Lis JT, Lomvardas S, et al. The 4D nucleome project. Nature 2017;549:219–26. - PMC - PubMed
    1. Cremer T, Cremer C. Chromosome territories, nuclear architecture and gene regulation in mammalian cells. Nat Rev Genet 2001;2:292–301. - PubMed
    1. Rao SSP, Huntley MH, Durand NC, Stamenova EK, Bochkov ID, Robinson JT, et al. A 3D map of the human genome at kilobase resolution reveals principles of chromatin looping. Cell 2014;159:1665–80. - PMC - PubMed
    1. Xiong K, Ma J. Revealing Hi-C subcompartments by imputing inter-chromosomal chromatin interactions. Nat Commun 2019;10:5069. - PMC - PubMed
    1. Dixon JR, Selvaraj S, Yue F, Kim A, Li Y, Shen Y, et al. Topological domains in mammalian genomes identified by analysis of chromatin interactions. Nature 2012;485:376–80. - PMC - PubMed

Methods-only References

    1. Li H, Durbin R. Fast and accurate short read alignment with Burrows–Wheeler transform. Bioinformatics 2009;25:1754–60. - PMC - PubMed
    1. Dobin A, Davis CA, Schlesinger F, Drenkow J, Zaleski C, Jha S, et al. STAR: ultrafast universal RNA-seq aligner. Bioinformatics 2013;29:15–21. - PMC - PubMed
    1. Goloborodko A, Abdennur N, Venev S, hbbrandao, gfudenberg. mirnylab/pairtools: v0.2.0. 2018.
    1. Wolf FA, Angerer P, Theis FJ. SCANPY: large-scale single-cell gene expression data analysis. Genome Biol 2018;19:15. - PMC - PubMed
    1. Zhou T GAGE-seq analysis workflow. 2024. 10.5281/zenodo.10888453 - DOI