. 2024 Jul;21(7):689-706.
doi: 10.1038/s41423-024-01174-6. Epub 2024 May 14.

Neutrophil-macrophage communication via extracellular vesicle transfer promotes itaconate accumulation and ameliorates cytokine storm syndrome

Affiliations

Neutrophil-macrophage communication via extracellular vesicle transfer promotes itaconate accumulation and ameliorates cytokine storm syndrome

Haixia Kang et al. Cell Mol Immunol. 2024 Jul.

Abstract

Cytokine storm syndrome (CSS) is a life-threatening systemic inflammatory syndrome involving innate immune hyperactivity triggered by various therapies, infections, and autoimmune conditions. However, the potential interplay between innate immune cells is not fully understood. Here, using poly I:C and lipopolysaccharide (LPS)-induced cytokine storm models, a protective role of neutrophils through the modulation of macrophage activation was identified in a CSS model. Intravital imaging revealed neutrophil-derived extracellular vesicles (NDEVs) in the liver and spleen, which were captured by macrophages. NDEVs suppressed proinflammatory cytokine production by macrophages when cocultured in vitro or infused into CSS models. Metabolic profiling of macrophages treated with NDEV revealed elevated levels of the anti-inflammatory metabolite, itaconate, which is produced from cis-aconitate in the Krebs cycle by cis-aconitate decarboxylase (Acod1, encoded by Irg1). Irg1 in macrophages, but not in neutrophils, was critical for the NDEV-mediated anti-inflammatory effects. Mechanistically, NDEVs delivered miR-27a-3p, which suppressed the expression of Suclg1, the gene encoding the enzyme that metabolizes itaconate, thereby resulting in the accumulation of itaconate in macrophages. These findings demonstrated that neutrophil-to-macrophage communication mediated by extracellular vesicles is critical for promoting the anti-inflammatory reprogramming of macrophages in CSS and may have potential implications for the treatment of this fatal condition.

Keywords: Cytokine storm syndrome; Extracellular vesicle; Itaconate; Macrophage; Neutrophil.


Conflict of interest statement

The authors declare no competing interests.

Figures

Fig. 1
Fig. 1
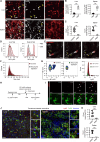
Characterization of the spatiotemporal dynamics of macrophages during cytokine storms. A For the cytokine shock model, the survival of mice was analyzed after intraperitoneal (i.p.) injection of 0.5 mg/kg TNF-α and 1 mg/kg IFN-γ (TNF-α + IFN-γ). PBS was used as a control (n = 5 mice per group). B For the TLR agonist-induced cytokine storm model, the survival of mice was analyzed after i.p. injection of 10 mg/kg poly I:C and 5 mg/kg LPS at the indicated times (poly I:C/LPS) (n = 5 mice per group). C Expression patterns of circulating tissue damage biomarkers and inflammatory cytokines in mice (top) at 4 h post-TNF-α and IFN-γ challenge or (bottom) at 8 h post-poly I:C/LPS challenge. D Quantification of IL-6 levels in multiple organs at 8 h post-poly I:C/LPS administration (n = 3) (total cytokine amount of IL-6 per organ). E, F Flow cytometry and statistical analyses of IL-6 intracellular expression levels in various cells in the livers of mice at 8 h post-poly I:C/LPS challenge. G Time-lapse images showing blood flow (magnetic) and macrophages (green) in the livers of mice administered TNF-α and IFN-γ. Mice were intravenously (i.v.) injected with AF647-conjugated anti-Ter119 and AF488-conjugated anti-F4/80 to examine blood flow and macrophages, respectively. Scale bar, 50 μm. H Quantification of the thrombus area at 0 and 5 h postinjection of TNF-α and IFN-γ in mice from (G) with μm2 per FOV (field of view). I Quantification of morphological changes in macrophages at the indicated times from (G). J Representative images of macrophages in the livers of mice at 8 h after PBS or poly I:C/LPS administration as described above (scale bar, 20 μm). K Quantification of macrophage death in (J) as a function of cell number per field of view (FOV). L Representative images showing macrophage death (SYTOX Green+ F4/80+) in the liver and spleen of mice 5 h after poly I:C/LPS administration (scale bar, 100 μm). M Quantitative analysis of macrophage death with cell number per field of view (FOV) in (L). N Survival of mice intravenously injected with blank liposomes (Blank) or clodronate liposomes (Clodronate) 24 h before poly I:C/LPS administration. n = 5 per group. The data (mean ± SEM) are representative of three independent experiments. *p < 0.05, **p < 0.01, and ***p < 0.001. Quantitative analysis of images was performed with ANOVA followed by Bonferroni post hoc correction (H, I, K, and M). The data are shown as the mean ± SEM. Survival analysis was performed using survival curve comparison (log-rank [Mantel‒Cox] test) (N)
Fig. 2
Fig. 2
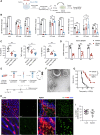
Neutrophils prevent excessive cytokine production and mortality during cytokine storms. A Experimental design. Survival of 7-week-old male C57BL/6 control (isotype) and neutrophil-depleted (anti-Ly6G) mice treated with (B) a lethal or (C) median lethal dose of poly I:C/LPS (n = 10 mice per group). D, E Quantitative analysis of the levels of multiple inflammatory factors in the serum of control (isotype) and neutrophil-depleted (anti-Ly6G) mice at 8 h after poly I:C/LPS administration. The expression levels were quantified by a Luminex multiplex liquid-chip assay. F Representative images showing macrophage death (SYTOX Green+ F4/80+) in the liver and spleen of mice subjected to control or neutrophil depletion treatment at 5 h after poly I:C/LPS administration. G Quantitative analysis of macrophage death in these groups with cell number per field of view (FOV) in (F). H A schematic showing the experimental design for neutrophil transfusion. A total of 5 × 106 neutrophils were adoptively transferred per mouse at the indicated times. Neutrophils for transfusion were isolated from naïve donor mice (naïve PMNs) or poly I:C-pretreated donor mice (poly I:C PMNs). I Survival of 7-week-old male C57BL/6 recipient mice that received PBS or neutrophil transfusion (n = 10 per group). J, K Quantitative analysis of the serum levels of multiple inflammatory factors in control and neutrophil-transferred mice at 8 h after poly I:C/LPS administration. The expression levels were quantified by a Luminex multiplex liquid-chip assay. L Experimental design. M Survival of 7-week-old male C57BL/6 mice subjected to control (blank + isotype), neutrophil single depletion (blank + anti-Ly6G), macrophage single depletion (clodronate + isotype), or dual depletion (clodronate + anti-Ly6G) treatment. n = 15 per group. *p < 0.05, **p < 0.01, and ***p < 0.001. Quantification of the images was performed with ANOVA with Bonferroni post hoc correction (G). The data are shown as the mean ± SEM. Survival analysis was performed using survival curve comparison (log-rank [Mantel‒Cox] test) (C, M). Other analyses were performed using an unpaired two-tailed Student’s test
Fig. 3
Fig. 3
Neutrophil-derived extracellular vesicles are engulfed by macrophages. A Images illustrating the neutrophil-derived extracellular vesicles (NDEVs) in the liver and spleen of PBS- or poly I:C/LPS-treated mice (gray, anti-Ly6G). Scale bar, 50 μm. Quantification of Ly6G+ particles (B) and Ly6G+ macrophages (C) in the indicated tissues of mice subjected to the indicated treatments. D Flow cytometry histogram showing intracellular Ly6G expression in macrophages isolated from the liver (left) and spleen (right). E Time-lapse images showing the process of neutrophil-derived microparticle generation in the livers of Ms4a3Rosa-tdTomato mice. Neutrophils were labeled by i.v. injection of fluorescence-conjugated anti-Ly6G (marked in gray). Scale bar, 10 μm. F Representative histogram showing the count and size distribution of extracellular vesicles in the peripheral blood of mice given the indicated treatments, which were measured using NanoFCM. G Representative NanoFCM plot (left) and histogram (right) showing the population and count of Ly6G+ particles in peripheral blood. H Experimental design. I Time-lapse images showing microparticle generation from transferred neutrophils in recipient mice from (H). Microparticles and neutrophils, Ly6G, red; macrophages, F4/80, green. Scale bar, 25 μm. J Immunofluorescence images showing transferred neutrophils (red) and derived extracellular vesicles (red) in the indicated tissues of mice from (I). The macrophages and nuclei were stained with anti-F4/80 (green) and Hoechst (blue), respectively. Scale bar, 30 μm. The right panels show enlarged ROIs (regions of interest). K Quantification of NDEVs inside macrophages in the indicated tissues. The data are representative of three independent experiments. *p < 0.05, **p < 0.01, and ***p < 0.001. The data are shown as the means ± SEMs. Quantification of the images was performed with ANOVA with Bonferroni post hoc correction (B, C, K). Other analyses were performed using an unpaired two-tailed Student’s test
Fig. 4
Fig. 4
NDEVs suppress inflammatory activation in macrophages in vitro and improve survival in vivo. A Schematic showing the workflow of the in vitro assay. B qRT‒PCR results showing the relative mRNA expression levels of Il6, Tnf, and Il1b in BMDMs subjected to the indicated treatments following stimulation with 2 μg/mL poly I:C and 1 μg/mL LPS. Blank culture supernatant and the corresponding sham treatments were used as controls. The expression levels were normalized to those of Hprt1. C ELISA of IL-6, TNF-α, and IL-1β protein levels in BMDMs treated with pellets isolated from sham culture medium (vehicle), NDEVs isolated from naïve PMN culture medium, or NDEVs isolated from poly I:C PMN culture medium. D qRT‒PCR results showing the relative mRNA expression levels of inflammatory factors in murine BMDMs treated with human neutrophil-derived EVs (human NDEVs). Specifically, 1 × 106 murine BMDMs were exposed to 1 × 109 human NDEVs for 6 h in a six-well plate containing 2 mL of culture medium. E Workflow showing NDEV isolation and transfusion. F Transmission electron micrograph of a negatively stained NDEV sample. Scale bar, 50 nm. G Survival of mice that received vehicle or NDEV transfusions, as shown in (E) (n = 10 per group). A total of 1 × 1010 NDEVs were administered intravenously to each mouse at 2 h and 12 h post-LPS injection. H Representative images showing transferred NDEVs in the liver and spleen. NDEVs were stained with fluorescent lipid dye before transfusion. Scale bar, 50 μm. The bottom panels are magnified views of the ROIs. Scale bar, 10 μm. NDEVs, green; macrophages, F4/80, red. I Statistical results (%) of NDEVs engulfed by macrophages in (H). The data are presented as the means ± SEMs and are representative of at least three independent experiments. *p < 0.05, **p < 0.01, and ***p < 0.001. Quantification of the images was performed with ANOVA with Bonferroni post hoc correction (I). Analysis was performed using an unpaired two-tailed Student’s test
Fig. 5
Fig. 5
NDEVs participate in metabolic reprogramming and increase itaconate level in macrophages. A Gene expression in BMDMs treated with vehicle or NDEVs was determined by bulk RNA-seq and is represented by heatmaps and GO analysis. Specifically, 1 × 106 BMDMs were treated with 1 × 109 NDEVs for 6 h, followed by stimulation with 2 μg/mL poly I:C and 1 μg/mL LPS. All samples were treated under the same conditions as those described above, unless indicated otherwise. B Bubble plot showing the KEGG enrichment analysis results of bulk mRNA sequencing data comparing vehicle-treated and NDEV-treated BMDMs. C, D Volcano plot and heatmap illustrating the results of nontargeted metabolomics profiling of vehicle-treated and NDEV-treated BMDMs after poly I:C/LPS stimulation. E Absolute intracellular levels of itaconate in BMDMs 6 h after the addition of vehicle or NDEVs, as measured via LC‒MS/MS. F Schematic showing the changes in itaconate-related metabolites in the TCA cycle. G Absolute intracellular levels of cis-aconitate in BMDMs subjected to the indicated treatments. H Absolute intracellular levels of succinate in BMDMs (n = 4). The data are presented as the means ± SEMs and are representative of three independent experiments. *p < 0.05, **p < 0.01, and *** p < 0.001. Analysis was performed using an unpaired two-tailed Student’s test
Fig. 6
Fig. 6
NDEVs inhibit inflammation in macrophages partially through Acod1-itaconate. A Venn diagrams showing common DEGs in NDEV-treated and OI-treated poly I:C/LPS-stimulated BMDMs and KEGG plots showing the enrichment of related pathways. First, 1 × 109 NDEVs, 125 μM OI, and 2 μg/mL poly I:C plus 1 μg/mL LPS were used as treatments. The BMDMs were harvested 6 h posttreatment and stimulation. BD Itaconate-related transcription patterns were analyzed by qRT‒PCR in vehicle-, NDEV-, and OI-treated BMDMs at 6 h after poly I:C/LPS stimulation as described above. E Western blot analysis of IκBζ protein levels in BMDMs treated with vehicle, NDEVs, or OI as described above. F Relative protein levels of IκBζ were determined based on band intensity in (E). G mRNA levels of inflammatory factors in WT BMDMs treated with vehicle, WT NDEVs, or Irg1−/−NDEVs after activation with poly I:C/LPS. H Comparison of the absolute intracellular levels of itaconate in 1 × 106 macrophages (per well) after the indicated treatments and in the presence of 1 × 109 NDEVs (per well). I mRNA levels of inflammatory factors in WT and Irg1−/− BMDMs subjected to the indicated treatments. The data are presented as the means ± SEMs and are representative of three independent experiments. *p < 0.05, **p < 0.01, and ***p < 0.001. Analysis was performed using an unpaired two-tailed Student’s test
Fig. 7
Fig. 7
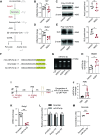
NDEV-delivered miR-27a-3p downregulates Suclg1 in macrophages. A Schematic showing the biosynthesis and catabolism of itaconate. B, C Relative transcriptional and protein levels of Acod1 in BMDMs treated with vehicle, 1 × 109 NDEVs, or 125 μM OI. D, E Relative transcriptional and protein levels of Suclg1 in BMDMs treated as described above. F Predicted binding sites (yellow) of mmu-miR-27a-3p and hsa-miR-27a-3p on mmu-Suclg1 mRNA. G Electrophoretic bands showing amplification products of miR-27a-3p in NDEVs. H qRT‒PCR results showing relative miR-27a-3p levels in macrophages treated with vehicle or NDEVs normalized to those in macrophages treated with miR-16. I Schematic illustrating the experimental design for assessing the expression of miR-27a-3p in neutrophils isolated from mice 8 h after PBS or poly I:C/LPS administration (CSS). J qRT‒PCR results showing the relative miR-27a‒3p expression level in the indicated neutrophils from (I). The expression levels were normalized to those of miR-16. K qRT‒PCR results showing relative Suclg1 mRNA levels in macrophages treated with either an exogenous scrambled sequence or synthesized miR-27a-3p mimics (10 nM) for 6 h. L Dual-luciferase reporter gene assay showing luciferase activity, which reflects binding activity between exogenous miR-27a-3p and the putative binding site on the Suclg1 mRNA 3’UTR shown in (F). The scrambled sequence and synthesized miR-27a-3p mimics were used at a concentration of 10 nM. The results are shown as the firefly luciferase assay/sea kidney luciferase assay. M Absolute intracellular itaconate levels in BMDMs treated with either a scrambled sequence or miR-27a-3p mimics as described above were measured using LC‒MS/MS. The data are representative of three independent experiments. The data are presented as the means ± SEMs. *p < 0.05, **p < 0.01, and ***p < 0.001. Analysis was performed using an unpaired two-tailed Student’s test
Fig. 8
Fig. 8
Mechanism underlying the protective roles of neutrophils during cytokine storms. NDEV-delivered miR-27a-3p suppresses the expression of Suclg1, which encodes the catabolic enzyme for itaconate, resulting in the accumulation of itaconate in macrophages. Itaconate, an anti-inflammatory metabolite, modulates inflammatory signaling pathways, such as the IκBζ pathway, and inhibits the production of proinflammatory factors. Thus, neutrophil-to-macrophage communication mediated by extracellular vesicles ameliorates cytokine storm syndrome

References

    1. Fajgenbaum DC, June CH. Cytokine Storm. N Engl J Med. 2020;383:2255–73. - PMC - PubMed
    1. Ryan DG, O’Neill LAJ. Krebs cycle reborn in macrophage immunometabolism. Annu Rev Immunol. 2020;38:289–313. - PubMed
    1. Maassen S, Coenen B, Ioannidis M, Harber K, Grijpstra P, Van den Bossche J, et al. Itaconate promotes a wound resolving phenotype in pro-inflammatory macrophages. Redox Biol. 2023;59:102591. - PMC - PubMed
    1. McKenna E, Wubben R, Isaza-Correa JM, Melo AM, Mhaonaigh AU, Conlon N, et al. Neutrophils in COVID-19: Not Innocent Bystanders. Front Immunol. 2022;13:864387. - PMC - PubMed
    1. Laforge M, Elbim C, Frere C, Hemadi M, Massaad C, Nuss P, et al. Tissue damage from neutrophil-induced oxidative stress in COVID-19. Nat Rev Immunol. 2020;20:515–6. - PMC - PubMed

LinkOut - more resources