. 2024 Jul;31(7):855-867.
doi: 10.1038/s41418-024-01307-4. Epub 2024 May 14.

Mutant p53 reactivation restricts the protumorigenic consequences of wild type p53 loss of heterozygosity in Li-Fraumeni syndrome patient-derived fibroblasts

Affiliations

Mutant p53 reactivation restricts the protumorigenic consequences of wild type p53 loss of heterozygosity in Li-Fraumeni syndrome patient-derived fibroblasts

Himanshi Agarwal et al. Cell Death Differ. 2024 Jul.

Abstract

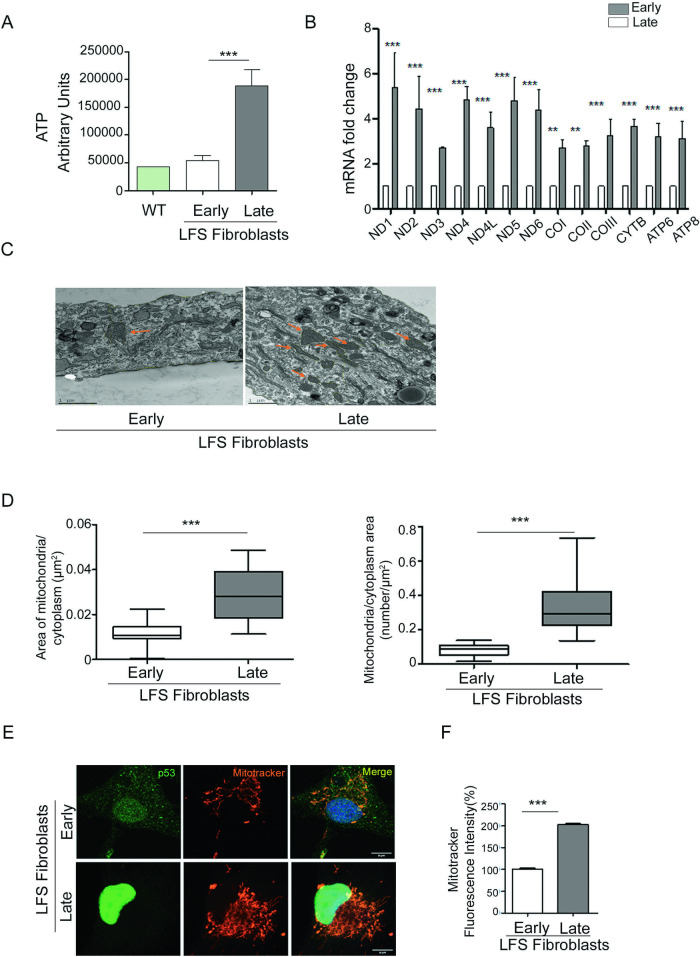
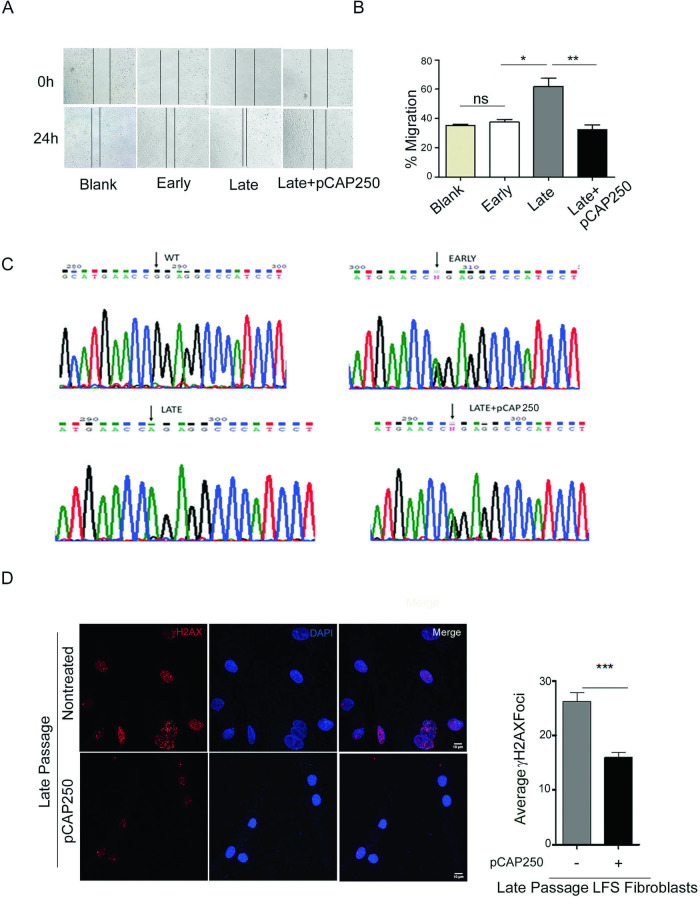
The p53 tumor suppressor, encoded by the TP53 gene, serves as a major barrier against malignant transformation. Patients with Li-Fraumeni syndrome (LFS) inherit a mutated TP53 allele from one parent and a wild-type TP53 allele from the other. Subsequently, the wild-type allele is lost and only the mutant TP53 allele remains. This process, which is termed loss of heterozygosity (LOH), results in only mutant p53 protein expression. We used primary dermal fibroblasts from LFS patients carrying the hotspot p53 gain-of-function pathogenic variant, R248Q to study the LOH process and characterize alterations in various pathways before and after LOH. We previously described the derivation of mutant p53 reactivating peptides, designated pCAPs (p53 Conformation Activating Peptides). In this study, we tested the effect of lead peptide pCAP-250 on LOH and on its associated cellular changes. We report that treatment of LFS fibroblasts with pCAP-250 prevents the accumulation of mutant p53 protein, inhibits LOH, and alleviates its cellular consequences. Furthermore, prolonged treatment with pCAP-250 significantly reduces DNA damage and restores long-term genomic stability. pCAPs may thus be contemplated as a potential preventive treatment to prevent or delay early onset cancer in carriers of mutant p53.


Conflict of interest statement

The authors declare no conflict of interest.

Figures

Fig. 1
Fig. 1. Loss of heterozygosity occurs in late passage LFS fibroblasts.
A Representative chromatograms showing TP53 heterozygosity at early passage (left panel) and at late passage (right panel). The adenine peak (arrows) is visible at late passage (N = 4). B Western blot analysis of lysates from early (E), middle (M), and late (L) passage cells. Total p53 was detected with the DO-1 antibody, and mutp53 was detected with a mutp53–specific antibody. GAPDH was used as a loading control (bottom lane) (N = 4). C Immunofluorescence analysis of early and late passage LFS fibroblasts. Mutp53–specific antibody (green) was used for LOH confirmation and nuclei were stained with DAPI (blue). (Scale bar, 20 μm.) Quantification of mutp53 staining was done using ImageJ (N = 4, n > 200). D Brightfield microscopic images of LFS fibroblasts undergoing senescence, as detected by β-gal assay; blue indicates senescent cells. Wild-type (WT) p53 fibroblasts at early (P12) and late (P21) and LFS fibroblasts at early and late passage were analyzed (N = 4). E Immunofluorescence analysis was performed on fibroblasts incubated with FITC-labeled mutp53–specific antibody (green), and yH2AX was detected by red fluorescence. Nuclei were stained with DAPI (blue). (Scale bar, 10 μm.) Quantification of DNA damage marker yH2AX was done using ImageJ (N = 4, n > 200). *p < 0.05, **p < 0.01, ***p < 0.001. Two-tailed unpaired Student’s t-test.
Fig. 2
Fig. 2. Loss of heterozygosity enhances mitochondrial metabolism.
A Intracellular ATP levels were measured by ATP Bioluminiscence Assay Kit CLS II on WT fibroblasts, early passage LFS fibroblasts, and late passage LFS fibroblasts (N = 4). B Human mitochondrial gene expression was measured by RT-qPCR, using specific primers (N = 4). C Transmission electron microscopy was performed to study mitochondrial size and density at early passage and late passage (mitochondria are shown with orange arrows). Images were taken at 6500× (N = 3, number of cells per condition >90) D Data were quantified using Image J. E Immunofluorescence analysis was performed on early and late passage LFS fibroblasts. Mutp53-specific antibody was used for LOH confirmation, and MitoTracker Red dye was used to label mitochondria Nuclei were stained with DAPI (blue). (Scale bar, 20 μm.) F Quantification of mitochondrial fluorescence intensity was performed using ImageJ (N = 4, n > 150). *p < 0.05, **p < 0.01, ***p < 0.001. Two-tailed unpaired Student’s t-test.
Fig. 3
Fig. 3. pCAP-250 restricts mutp53 expression and reduces the growth of late passage cells.
A Western blot analysis of lysates from WT, early passage LFS, late passage LFS, and late passage LFS cells treated with pCAP-250 or with a scrambled peptide. Total p53 was detected with the DO-1 antibody, and mutp53 was detected with a mutp53–specific antibody. GAPDH served as loading control. Data was quantified using ImageJ (N = 4). B Cells were plated in 10-cm dishes at a density of 100,000 cells/dish and then treated with either pCAP-250 or a scrambled peptide or left untreated as a control (NTC). The cells were counted by brightfield imaging at 4× after 72 h (N = 4). C Immunofluorescence analysis was performed on nontreated late passage cells and late passage cells treated with pCAP-250. Ki67-specific antibody was labeled with FITC, and the nuclei were stained with DAPI (blue). (Scale bar, 20 μm) Images were taken at 20X and staining was quantified using ImageJ (N = 4, n > 150). D Brightfield microscopic images of cells undergoing senescence, as detected by β-gal assay. Blue represents senescent cells. WT and LFS fibroblasts were imaged at early and late passages, along with late passage LFS cells treated with pCAP-250, and senescent cells were quantified (N = 4). *p < 0.05, **p < 0.01, ***p < 0.001, ns not significant. Two-tailed unpaired Student’s -test.
Fig. 4
Fig. 4. pCAP-250 helps restore mitochondrial metabolism.
A Intracellular ATP levels were measured by ATP Bioluminiscence Assay Kit CLS II. All fibroblast lines showed enhanced ATP levels after LOH (N = 4). B Extracellular lactate concentration was measured by Sigma kit. Conditioned medium (50 µL) samples from early passage, late passage, and late passage plus pCAP-250 cells were mixed with master reaction mix and incubated for 30 min. Absorbance was then measured at 570 nm. The X-axis represents concentration (nmol/mL) (N = 4). C Confocal microscopy was performed on untreated late passage cells and late passage cells treated with pCAP-250. Cells were labeled with mutp53-specific antibody to confirm LOH and MitoTracker Red to label mitochondria. Nuclei were stained with DAPI (blue). (Scale bar, 10 μm.) Quantification was done using ImageJ (N = 4, n = 100) D Electron microscopy was performed to monitor mitochondrial size and density. Images were taken at 6500× at early and late passage and late passage treated with pCAP-250 (mitochondria are indicated by orange arrows) (N = 3). E Data was quantified using Image J. F Human mitochondrial gene expression was measured by RT-qPCR using specific primers (N = 4). *p < 0.05, **p < 0.01, ***p < 0.001. Two-tailed unpaired Student’s t-test.
Fig. 5
Fig. 5. pCAP-250 reduces cancer cell migration and DNA damage and prevents WT TP53 LOH in late passage LFS cells.
A Scratch assay was performed on U2OS cells using conditioned medium from LFS fibroblasts at early passage, late passage, and late passage with pCAP-250. Representative images were taken with a brightfield microscope (N = 4). B Gap distance was quantified for all conditions at 24 h. The Y-axis represents percentage migration, and the X-axis represents passage number. C Representative chromatograms depicting the status of the TP53 gene. Black arrow indicates WT fibroblast (CGG), heterozygous status (CNG) at early passage, mutant only (CAG) at late passage, and heterozygous status (CNG) in late passage treated with pCAP-250 (N = 4). D Immunofluorescence was performed to monitor γH2AX foci, indicative of DNA damage. DNA damage was measured in late passage cells with or without pCAP-250 treatment. γH2AX was detected by red fluorescence. Nuclei were stained with DAPI (blue) (Scale bar, 10 μm.) Quantification was done using Image J (N = 4, n > 150). *p < 0.05, **p < 0.01, ***p < 0.001. Two-tailed unpaired Student’s t-test.
Fig. 6
Fig. 6. pCAP-250 prevents chromosomal aberrations and repairs DNA damage in late passage LFS fibroblasts.
A Comet assay was performed on early passage, late passage, and late passage plus pCAP-250 cultures. Data was acquired using epifluorescence imaging (Scale bar, 50 μm.) and Tail length was quantified using ImageJ (N = 4, n > 200). B RT-qPCR was performed on early passage cells, late passage cells and late passage cells treated with pCAP-250, to quantify the expression of genes encoding the DNA repair enzymes XPC, MSH2 and FEN1, which are regulated by WT p53. Cisplatin served as a positive control to induce the expression of these genes by WTp53 activation (N = 4). C CPD lesions were detected in late passage cells 53528 treated with increasing doses of UV radiation. The cells were incubated in culture medium for 24 h, and lesions were counted and quantified by ImageJ (n = 50). D Spectral karyotyping was performed on LFS early passage, late passage, and late passage cells treated with pCAP-250 (n = 10). Percentages of cells with chromosomal aberrations were calculated. *p < 0.05, **p < 0.01, ***p < 0.001, ns not significant. Two-tailed unpaired Student’s t-test.

References

    1. Bártek J, Bártková J, Vojtĕsek B, Stasková Z, Lukás J, Rejthar A, et al. Aberrant expression of the p53 oncoprotein is a common feature of a wide spectrum of human malignancies. Oncogene. 1991;6:1699–703. - PubMed
    1. Greenblatt MS, Bennett WP, Hollstein M, Harris CC. Mutations in the p53 tumor suppressor gene: clues to cancer etiology and molecular pathogenesis. Cancer Res. 1994;54:4855–78. - PubMed
    1. Lonetto G, Koifman G, Silberman A, Attery A, Solomon H, Levin-Zaidman S, et al. Mutant p53-dependent mitochondrial metabolic alterations in a mesenchymal stem cell-based model of progressive malignancy. Cell Death Differ. 2019;26:1566–81. doi: 10.1038/s41418-018-0227-z. - DOI - PMC - PubMed
    1. Kastan MB, Onyekwere O, Sidransky D, Vogelstein B, Craig RW. Participation of p53 Protein in the Cellular Response to DNA Damage. Cancer Res. 1991;51:6304–11. - PubMed
    1. Maltzman W, Czyzyk L. UV irradiation stimulates levels of p53 cellular tumor antigen in nontransformed mouse cells. Mol Cell Biol. 1984;4:1689–94. - PMC - PubMed

Substances

LinkOut - more resources